Open Access
Fig. 5
Download original image
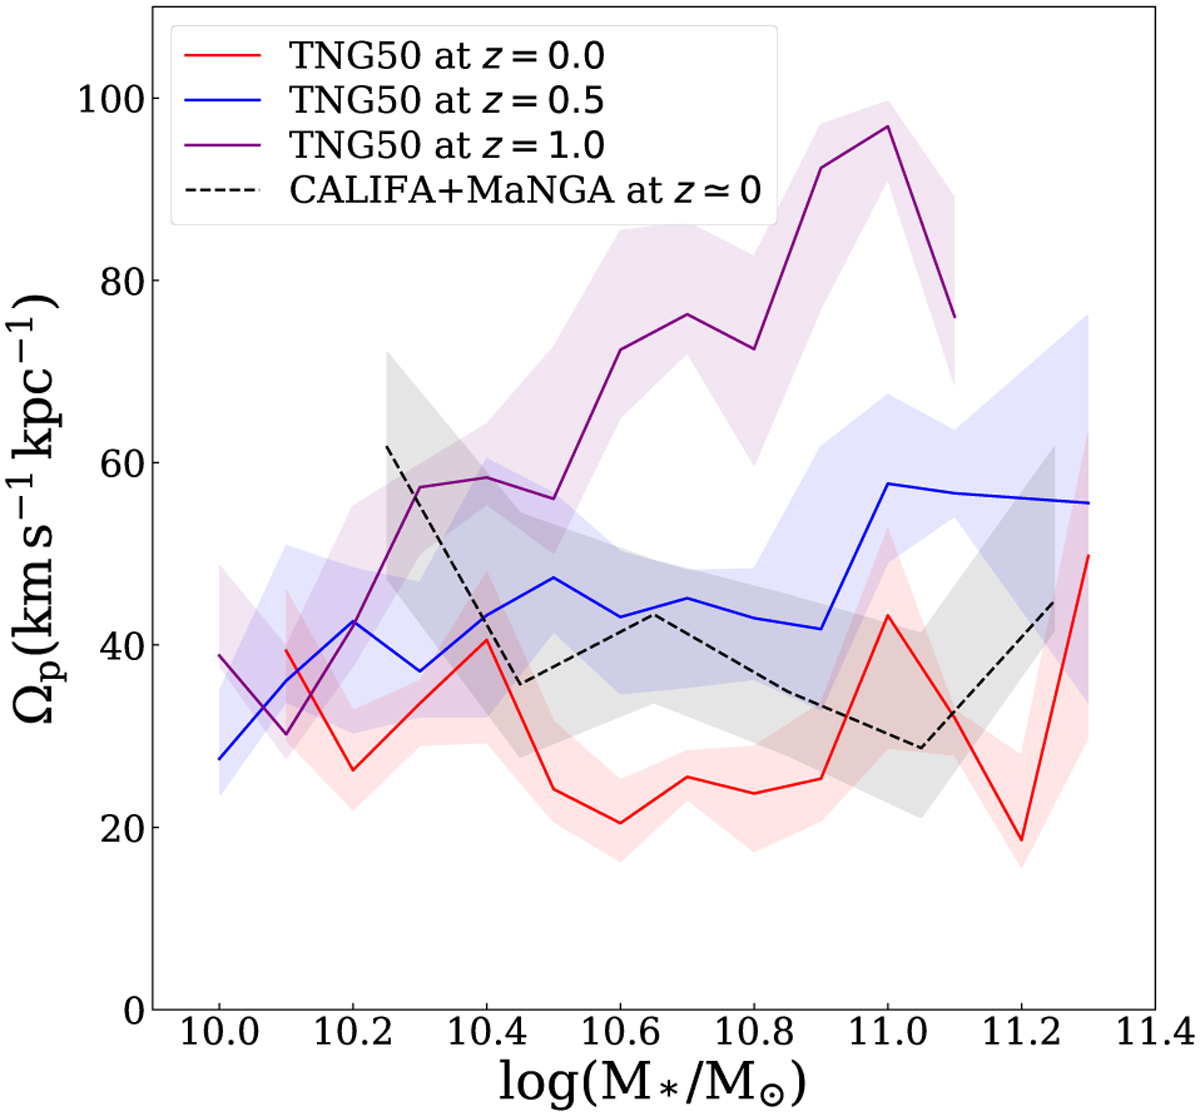
Solid lines displaying the median value of the bar pattern speed vs. stellar mass for TNG50 at different redshifts, ɀ = 0.0, ɀ = 0.5, and ɀ = 1.0, and for the observed CALIFA + MaNGA sample at ɀ ≃ 0.0. There are 60 galaxies in this sample with ΔΩp/Ωp ≤ 0.5 that are included in this figure.
Current usage metrics show cumulative count of Article Views (full-text article views including HTML views, PDF and ePub downloads, according to the available data) and Abstracts Views on Vision4Press platform.
Data correspond to usage on the plateform after 2015. The current usage metrics is available 48-96 hours after online publication and is updated daily on week days.
Initial download of the metrics may take a while.