Fig. 11.
Download original image
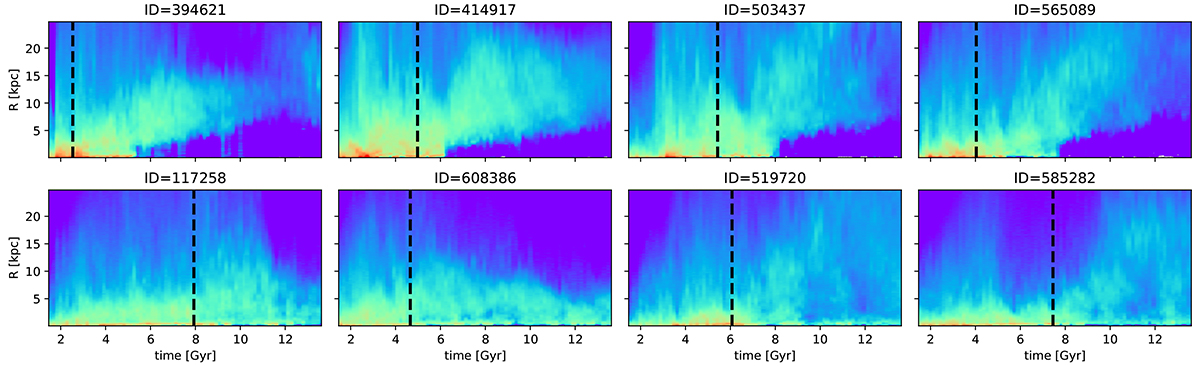
Time evolution of gas density profiles for eight example simulated barred galaxies from TNG50-1. The IDs given in the plots are for z = 0. Vertical black dashed lines mark the bar formation times. The examples correspond to the cases from Fig. 2, where those in the top panel experienced a significant slowdown and those in the bottom panel had smaller changes in Ωp.
Current usage metrics show cumulative count of Article Views (full-text article views including HTML views, PDF and ePub downloads, according to the available data) and Abstracts Views on Vision4Press platform.
Data correspond to usage on the plateform after 2015. The current usage metrics is available 48-96 hours after online publication and is updated daily on week days.
Initial download of the metrics may take a while.