Fig. 5.
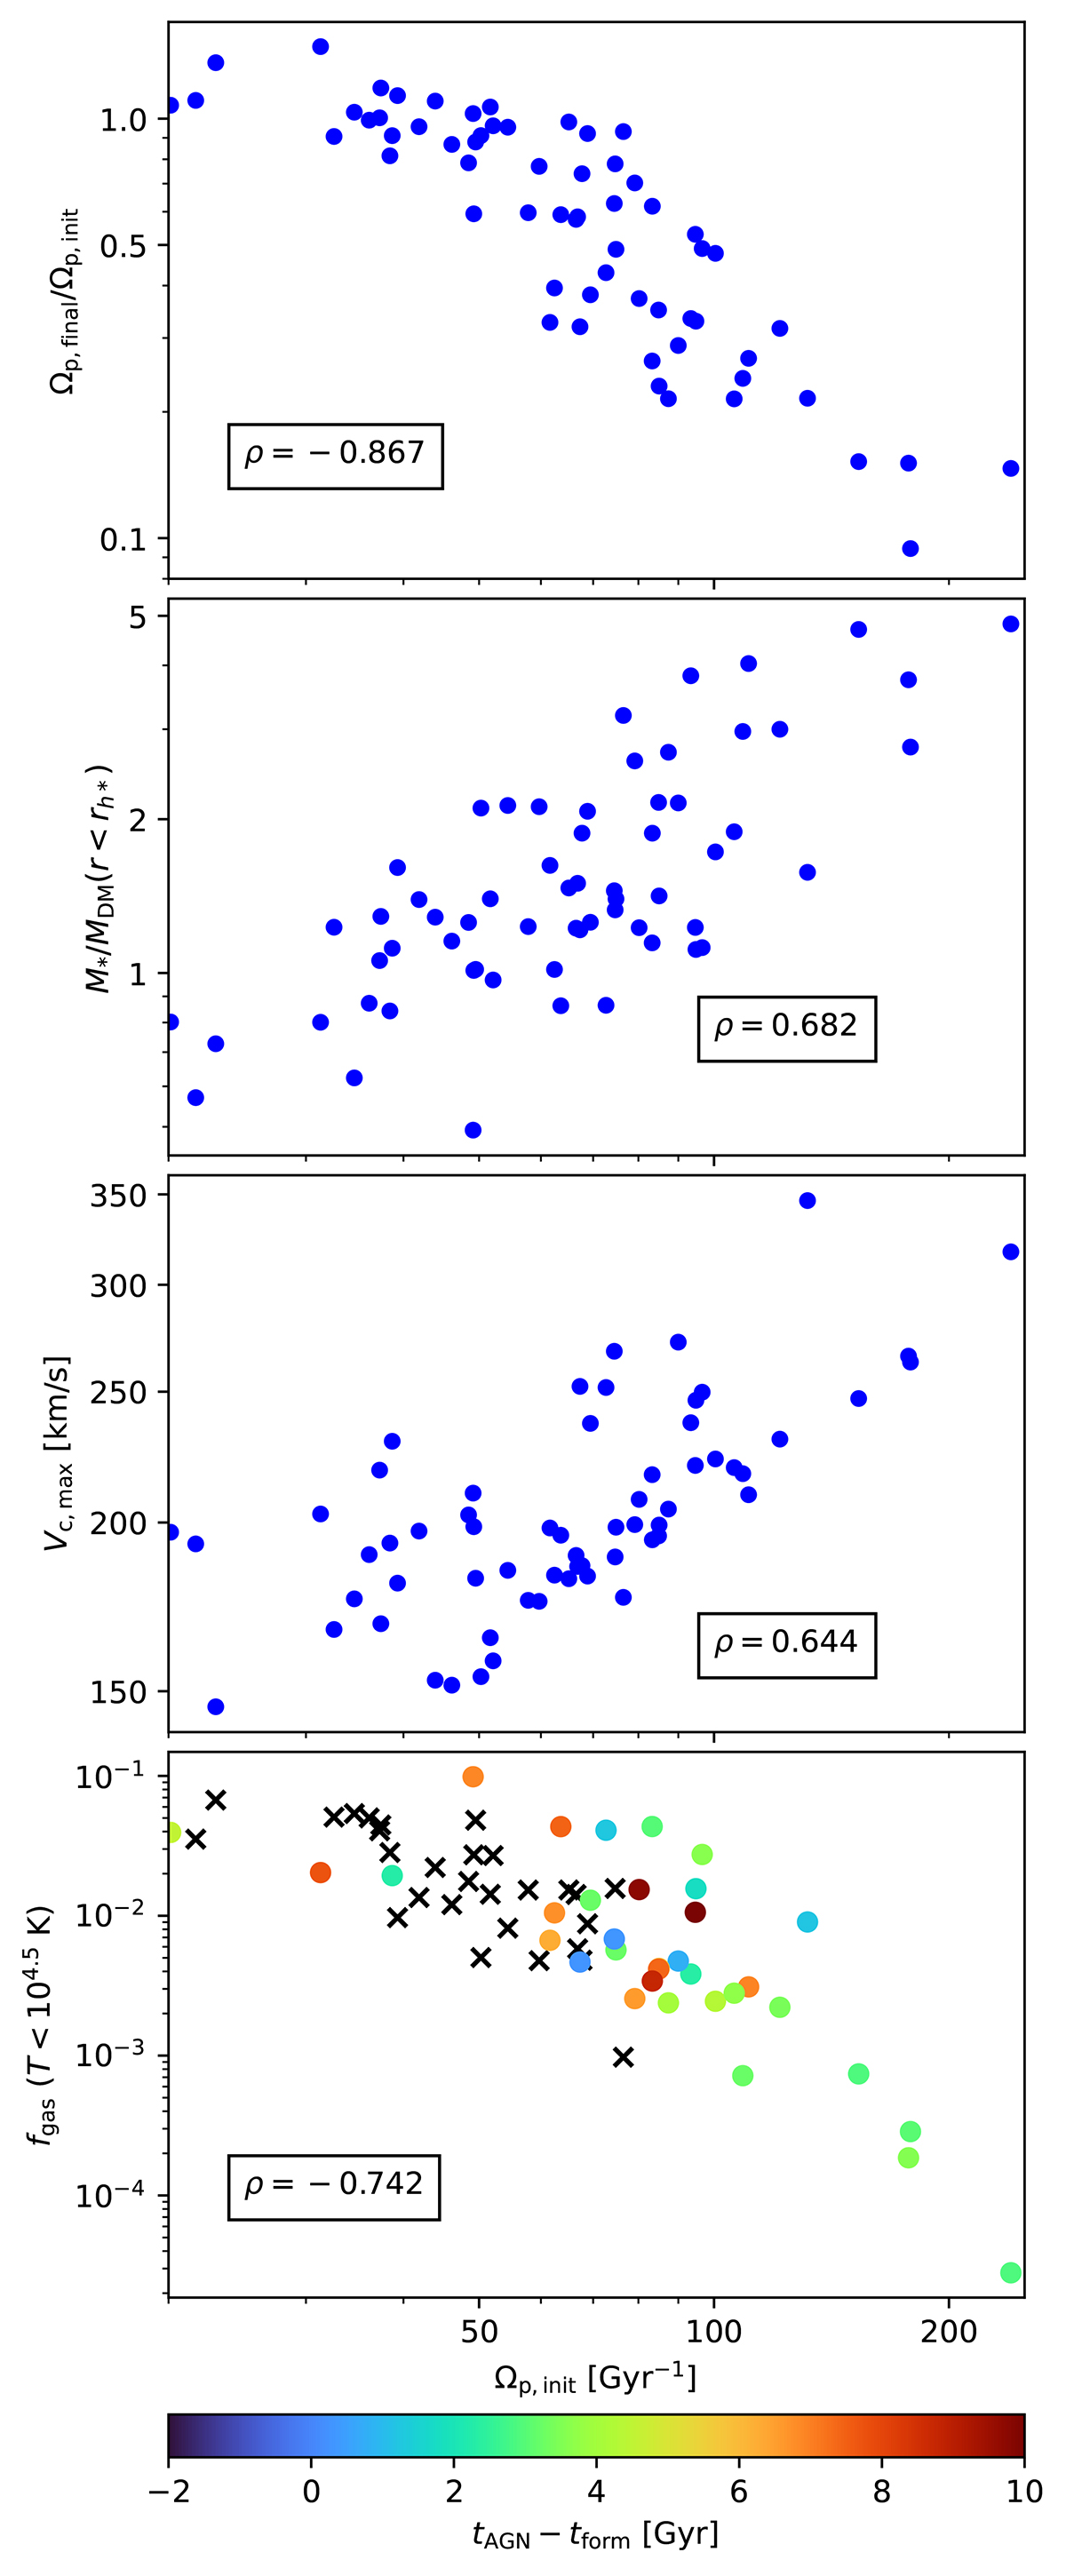
Download original image
Correlations between initial bar pattern speeds of Ωp, init and its ratio with the final value Ωp, final (top panel), the stellar-to-dark-mass ratio measured within the stellar half-mass radius M*/MDM(r < rh*) (second top panel), the maximum circular velocity Vc, max (second bottom panel), and the cold gas fraction fgas (T < 104.5 K) also measured inside r < rh* (bottom panel). The values are averaged from six consecutive snapshots at the bar formation. The colour in the bottom panel marks the difference between the times when AGN-feedback prescription switched from thermal to kinetic and the bar formation times (or black crosses if this switch never occurred). In each panel, Spearman’s correlation coefficients ρ are provided.
Current usage metrics show cumulative count of Article Views (full-text article views including HTML views, PDF and ePub downloads, according to the available data) and Abstracts Views on Vision4Press platform.
Data correspond to usage on the plateform after 2015. The current usage metrics is available 48-96 hours after online publication and is updated daily on week days.
Initial download of the metrics may take a while.