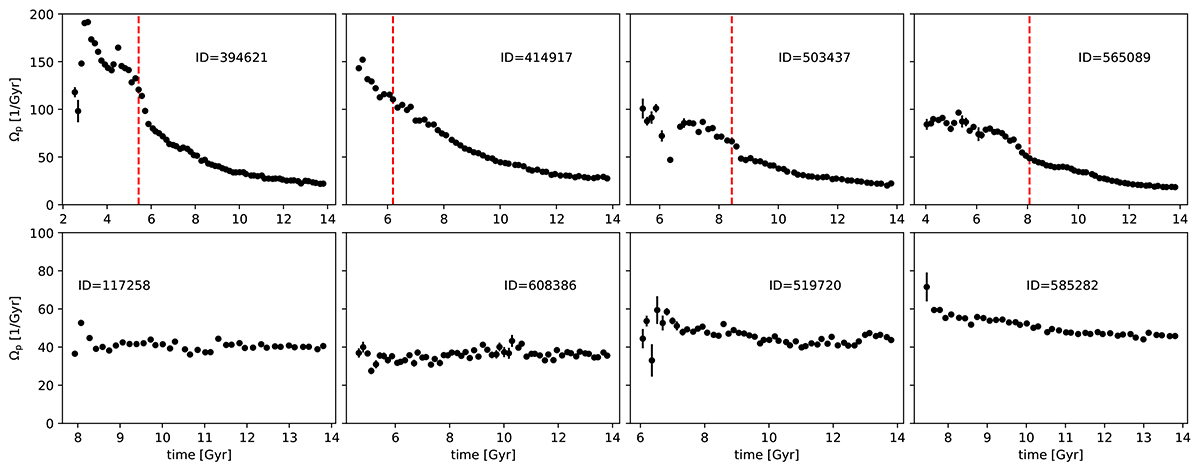
Fig. 2.
Download original image
Eight examples of bar-pattern-speed evolution (the IDs given are for z = 0) with significant slowdown (top) or little evolution (bottom). The time axis begins with the first snapshot where a bar is detected. Dashed vertical red lines indicate the time tAGN when kinetic feedback from the AGN reaches a threshold that coincides with the appearance of a hole in the simulated gas discs.
Current usage metrics show cumulative count of Article Views (full-text article views including HTML views, PDF and ePub downloads, according to the available data) and Abstracts Views on Vision4Press platform.
Data correspond to usage on the plateform after 2015. The current usage metrics is available 48-96 hours after online publication and is updated daily on week days.
Initial download of the metrics may take a while.