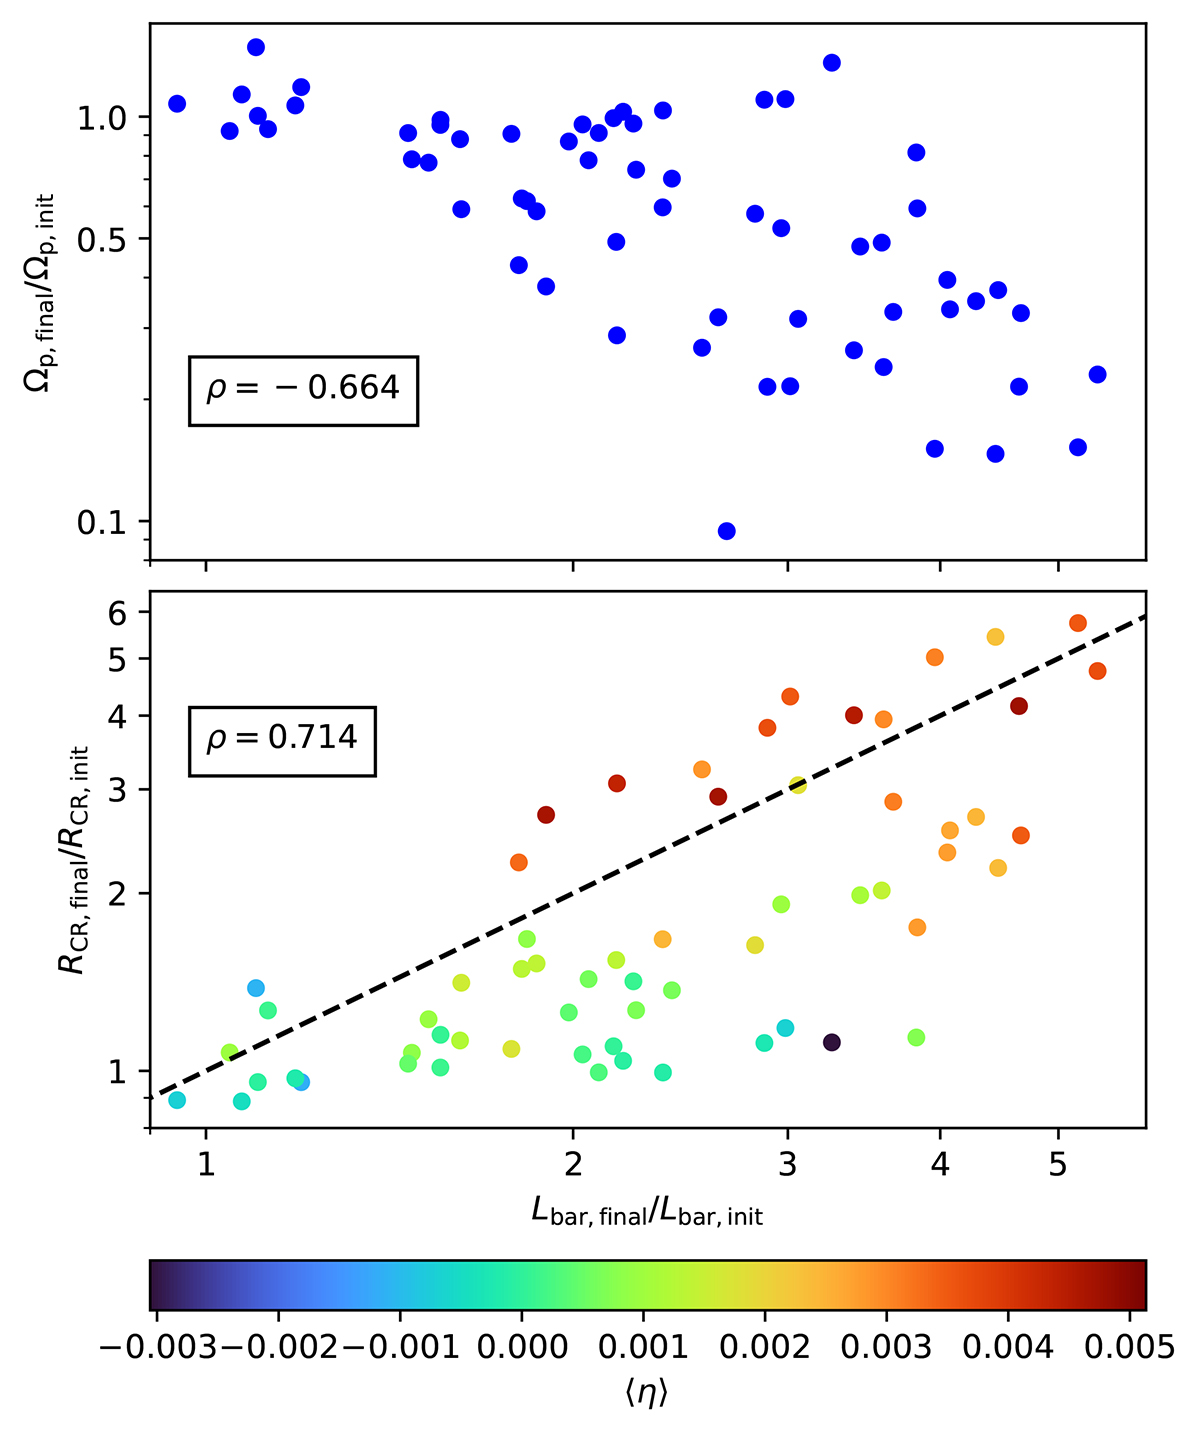
Fig. 8.
Download original image
Correlations between final-to-initial ratios of pattern speeds Ωp and bar lengths Lbar (top) and corotation radii RCR (bottom). The dashed black line in the bottom panel marks where ℛ would not change; i.e. ℛfinal/ℛinit = 1. The colour of points in the top panel indicates the mean slowing rate ⟨η⟩. The bars that slow down more lie above the ℛfinal/ℛinit = 1, which means their ℛ goes up and they also slow down in terms of ℛ.
Current usage metrics show cumulative count of Article Views (full-text article views including HTML views, PDF and ePub downloads, according to the available data) and Abstracts Views on Vision4Press platform.
Data correspond to usage on the plateform after 2015. The current usage metrics is available 48-96 hours after online publication and is updated daily on week days.
Initial download of the metrics may take a while.