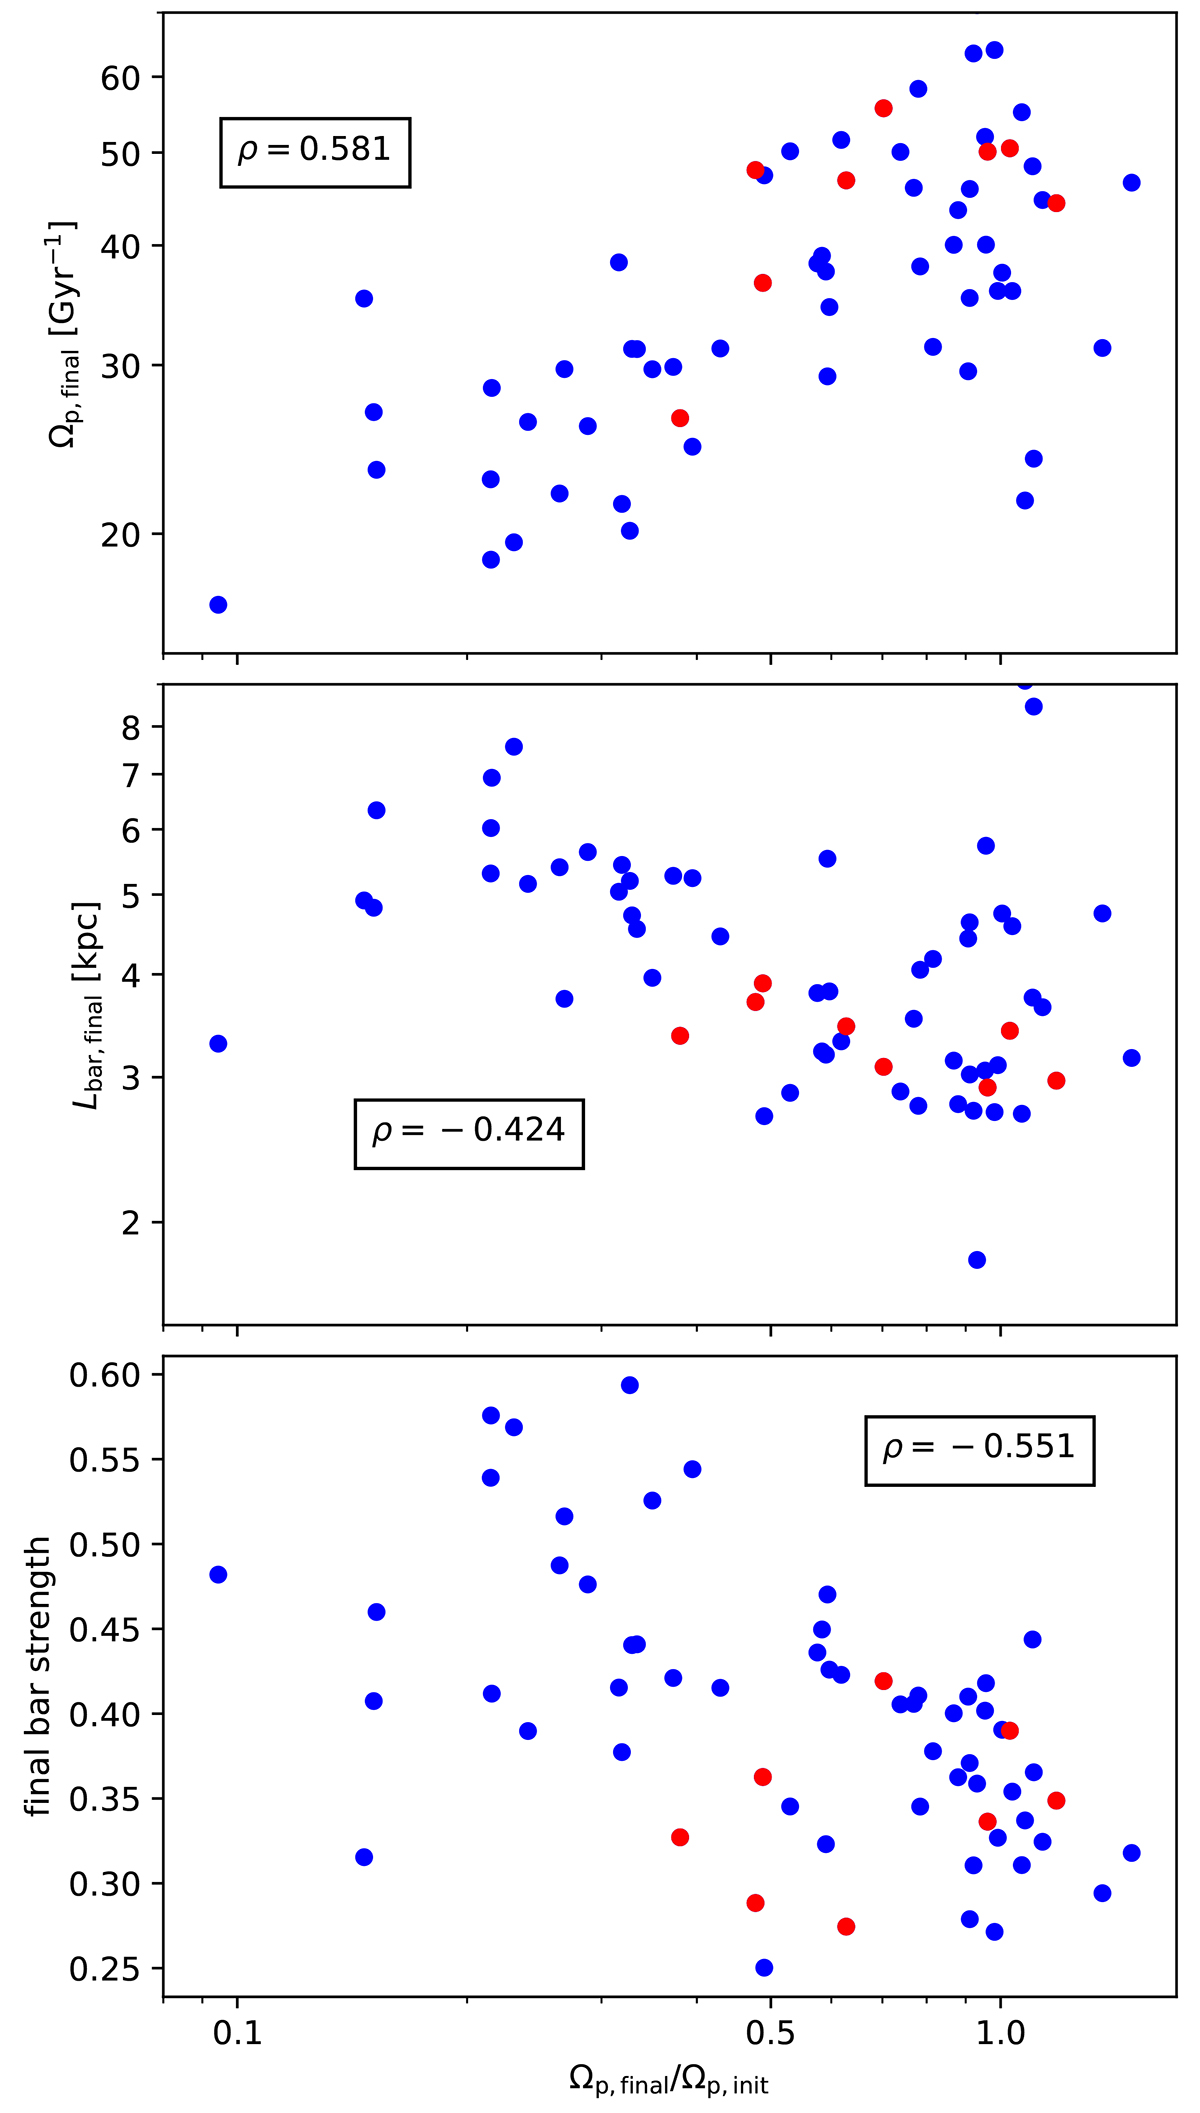
Fig. 9.
Download original image
Correlations between final-to-initial pattern-speed ratio and the final pattern speed (top), bar length, and bar strength, measured as the maximum of the m = 2 Fourier amplitude. Red points mark cases with more irregular evolution of Ωp. Bars that have slowed down significantly tend to grow stronger and longer and have lower absolute pattern speed.
Current usage metrics show cumulative count of Article Views (full-text article views including HTML views, PDF and ePub downloads, according to the available data) and Abstracts Views on Vision4Press platform.
Data correspond to usage on the plateform after 2015. The current usage metrics is available 48-96 hours after online publication and is updated daily on week days.
Initial download of the metrics may take a while.