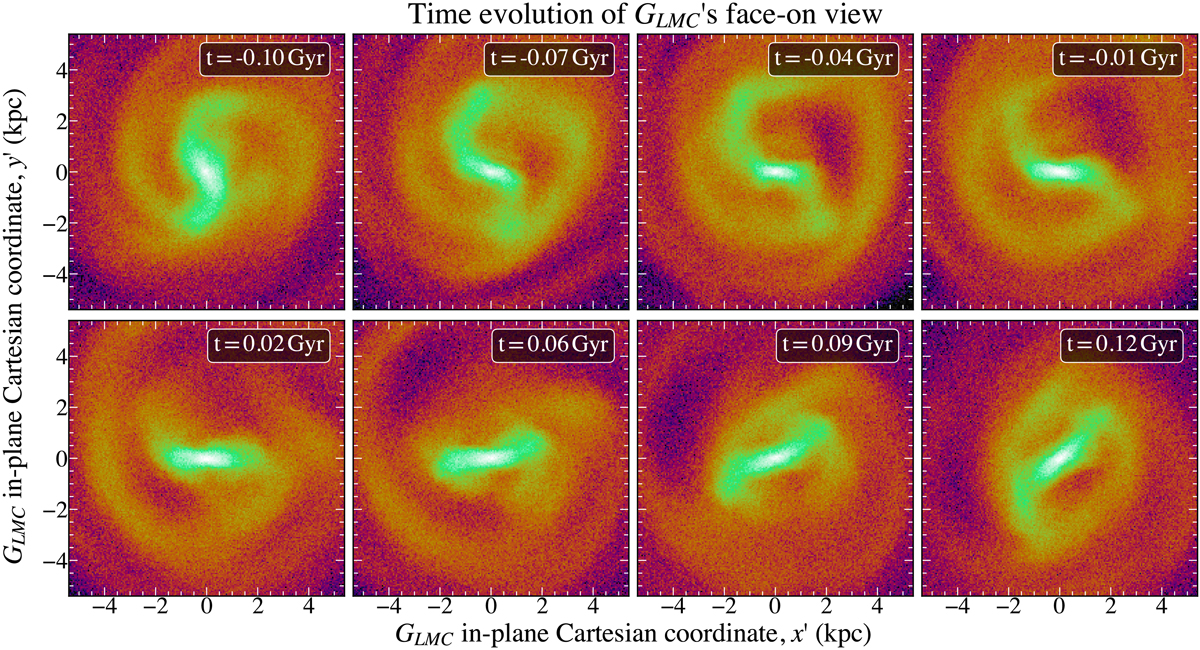
Fig. 1.
Download original image
Time evolution of the stellar density map of the GLMC disc seen face-on. The panels have a constant time difference of 31 Myr, and the total time evolution is 220 Myr (from t = −0.10 Gyr to t = 0.12 Gyr). All maps are shown in the GLMC in-plane (x′,y′) Cartesian coordinate system. A video version of this figure is available online.
Current usage metrics show cumulative count of Article Views (full-text article views including HTML views, PDF and ePub downloads, according to the available data) and Abstracts Views on Vision4Press platform.
Data correspond to usage on the plateform after 2015. The current usage metrics is available 48-96 hours after online publication and is updated daily on week days.
Initial download of the metrics may take a while.