| Issue |
A&A
Volume 698, June 2025
|
|
|---|---|---|
| Article Number | L14 | |
| Number of page(s) | 10 | |
| Section | Letters to the Editor | |
| DOI | https://doi.org/10.1051/0004-6361/202554628 | |
| Published online | 06 June 2025 | |
Letter to the Editor
Mass, gas, and Gauss around a T Tauri Star with SPIRou
1
Université de Toulouse, CNRS, IRAP, 14 avenue Belin, 31400 Toulouse, France
2
Department of Earth Sciences, University of Hawai’i at Mānoa, Honolulu, Hawai’i 96822, USA
3
Institute for Astrophysics, University of Vienna, 1180 Vienna, Austria
4
Center for Astrophysics | Harvard & Smithsonian, 60 Garden street, Cambridge, MA 02138, USA
5
Canada-France-Hawaii Telescope, 65-1238 Mamalahoa Hwy, Kamuela, HI 96743, USA
6
Department of Physics and Astronomy, University of North Carolina Chapel Hill, Chapel Hill, NC 27599, USA
⋆ Corresponding author: This email address is being protected from spambots. You need JavaScript enabled to view it.
Received:
18
March
2025
Accepted:
15
May
2025
Abstract
Studies of young planets help us understand planet evolution and investigate important evolutionary processes such as atmospheric escape. We monitored IRAS 04125+2902, a 3 Myr-old T Tauri star with a transiting planet and a transitional disk, with the SPIRou infrared spectropolarimeter on the Canada-France-Hawaii Telescope. Using these data, we constrained the mass and density of the Jupiter-size companion to < 0.16 M♃ and < 0.23 g cm−3, respectively (90% upper limits). These rule out a Jovian-like object and support the hypothesis that it is an ancestor to the numerous sub-Neptunes found around mature stars. We unambiguously detected magnetic fields at the stellar surface, small-scale fields reaching 1.5 kG and the large-scale field mostly consisting of a 0.80−0.95 kG dipole inclined by 5−15° to the rotation axis. Accretion onto the star is low and/or episodic at a maximum rate of ≃10−11 M⊙ yr−1, indicating that IRAS 04125+2902 is most likely in a magnetic “propeller” regime, presumably explaining the star’s slow rotation (11.3 d). We discovered persistent Doppler-shifted absorption in a metastable He I line, clear evidence for a magnetized wind from a gaseous inner disk. Variability in absorption suggests structure in the disk wind that could reflect disk-planet interactions.
Key words: techniques: polarimetric / techniques: radial velocities / planets and satellites: formation / stars: formation / stars: magnetic field / stars: pre-main sequence
© The Authors 2025
 Open Access article, published by EDP Sciences, under the terms of the Creative Commons Attribution License (https://creativecommons.org/licenses/by/4.0), which permits unrestricted use, distribution, and reproduction in any medium, provided the original work is properly cited.
This article is published in open access under the Subscribe to Open model. This email address is being protected from spambots. You need JavaScript enabled to view it. to support open access publication.
1. Introduction
Observing young planets and comparing them to their older counterparts is a powerful method for studying planet evolution (Dai et al. 2024; Barber et al. 2024a; Fernandes et al. 2025). Also, some evolutionary processes such as atmospheric escape can be studied directly by observations of young planets where rates are expected to be fastest. Most exoplanets on close-in orbits have been discovered by the photometric transit method, and many of these have been monitored with Doppler radial velocity (RV) spectrometers to confirm their existence and measure their masses. However, very young stars are rapidly rotating, highly magnetically active and can still be accreting from primordial disks. As a result, they are photometrically and spectroscopically variable, inhibiting detection by the transit and RV methods. Only a handful of young planets have been found by either method in nearby < 20 Myr star-forming regions. We thus know little about the progenitors of planets found around mature stars.
A transiting, Jupiter-size planet on a 8.8-d (0.08 au) orbit was recently discovered in TESS photometry of IRAS 04125+2902, a 0.7 M⊙ member of the Taurus star-forming region (Barber et al. 2024b). At 3.0 ± 0.4 Myr (Luhman 2025), the host star is 3× younger than the previous record holder. Sparse RV observations limited the planet’s mass to no more than that of Jupiter (Barber et al. 2024b). Instead of a Jovian planet, it could be a highly inflated ancestor to (sub) Neptunes orbiting older stars, but a more stringent mass constraint is needed to confirm this possibility.
The star hosts a transitional disk responsible for excess emission at λ > 8 μm (Luhman et al. 2009; Furlan et al. 2009; Espaillat et al. 2015). Paradoxically, mm-wave imaging reveals a nearly face-on (i ∼ 30°) disk with a 20 au cavity, extending to 50–60 au (Espaillat et al. 2015), and highly inclined to both the orbit of the planet and that of its distant stellar companion (Barber et al. 2024b). The U-band emission suggests accretion (Espaillat et al. 2015), and extinction along the line of sight (LOS) is AV = 2.7 ± 0.2 mag (Espaillat et al. 2015; Barber et al. 2024b), higher than that from dust maps (1.85, Green 2018). Both hint at an inner disk but more direct evidence is required.
Finally, IRAS 04125+2902 is slowly rotating (11.3 d) for a Taurus star (Rebull et al. 2020). This could reflect efficient magnetic braking by the disk (e.g., Gehrig et al. 2023), but a measurement of the stellar field is required to evaluate this. Otherwise, its slow rotation could be somehow connected to the existence/detection of the planet or stellar companion. Here, we use spectropolarimetric monitoring of IRAS 04125+2902 to detect and model the stellar magnetic field, better constrain the planet’s mass, and unambiguously detect an inner gaseous disk.
2. Observations and data reduction
We observed IRAS 04125+2902 with SPIRou (Donati et al. 2020), the near-infrared precision velocimeter/spectropolarimeter on the 3.6-m Canada-France-Hawaii Telescope (CFHT) atop Maunakea in Hawaii. SPIRou collects unpolarized and polarized stellar spectra over λ = 0.95–2.50 μm at a resolving power of 70 000 in a single exposure. We obtained unpolarized (Stokes I) and circularly polarized (Stokes V) spectra of IRAS 04125+2902 at 42 epochs over 118 d between 2024 Oct. 24 to 2025 Feb. 19 (RUNIDs #24BH02 and #25AD98, PI E. Gaidos). Observations obtained on Nov. 15 and Nov. 24 in poor weather were discarded. Seventeen observations were obtained during TESS monitoring of the star in Sector 86 (2024 Nov. 21 to Dec. 18, Fig. A.1). Each SPIRou observation consists of sequences of 4 sub-exposures obtained at different azimuths of the polarimeter Fresnel rhomb retarders. This procedure can remove systematics in polarization spectra (to first order, Donati et al. 1997). Each recorded sequence yields a pair of Stokes I and V spectra, plus a null polarization diagnostic of potential instrument or reduction issues.
All the spectra of IRAS 04125+2902 were processed with the SPIRou reduction package APERO (Cook et al. 2022). We applied “least-squares deconvolution” (LSD, Donati et al. 1997) to all reduced spectra with a line mask computed with the VALD-3 database (Ryabchikova et al. 2015) for a set of atmospheric parameters (Teff = 4000 K and log g = 4.0) matching those of IRAS 04125+2902, selecting only atomic lines deeper than 10% of the continuum level, for a total of ≃1500 lines (average wavelength and Landé factor of 1750 nm and 1.2). We also constructed a second LSD mask with only the ≃300 CO lines of the CO bandhead, known to be insensitive to magnetic fields and thus less affected by stellar activity. We finally applied the line-by-line analysis (LBL, Artigau et al. 2022) to derive RVs from all (i.e., ≃25 000) spectral features simultaneously (using the median spectrum of Gl 846 as reference) and to quantify the small temperature variations dT that result from starspots (Artigau et al. 2024). The observation log is given in Table B.1.
3. Characterizing the magnetic field
For each pair of Stokes I and V LSD profiles, we computed the longitudinal magnetic field Bℓ, i.e., the LOS-projected component of the vector magnetic field averaged over the visible hemisphere, following Donati et al. (1997). This yielded Bℓ values from −47 to 101 G (median 31 G) with uncertainties from 9 to 18 G (median 10 G), confirming that the field is clearly detected at the stellar surface. Fitting these values by Gaussian process regression (GPR) with a quasi-periodic kernel (Haywood et al. 2014; Rajpaul et al. 2015, see Appendix C for more details) and a Monte-Carlo Markov chain (MCMC) process, we re-estimated the rotation period Prot = 11.35 ± 0.04 d as well as the coherence timescale of Bℓ (97 ± 30 d), with all inferred hyper-parameters listed in Table D1. Figure D.1 clearly shows Bℓ evolving over the course of our observations.
We proceeded in the same way with dT (see Fig. D.1), showing clear quasi-periodic variation from −63 to 29 K with uncertainties between 1.3 and 2.4 K (median 1.4 K), and yielding a slightly shorter Prot = 11.28 ± 0.05 d and an identical coherence timescale. As expected, the minimum temperature occurs in conjunction with the minimum brightness in the contemporaneous TESS light curve, at, e.g., BJD = 2460645.8 and 2460657.1.
We also analyzed the median intensity spectrum of IRAS 04125+2902 with ZeeTurbo (Cristofari et al. 2023) to reassess the main stellar parameters and estimate the intensity of its small-scale magnetic field. Assuming solar abundances, we derived a photospheric temperature of Teff = 3889 ± 30 K and a logarithmic surface gravity of log g = 3.92 ± 0.05, in good agreement with previous estimates (López-Valdivia et al. 2021; Barber et al. 2024b). In addition, we find that the small-scale field reaches ⟨B⟩ = 1.52 ± 0.05 kG, slightly higher than (but still consistent with) the previous estimate of 1.36 ± 0.32 kG by López-Valdivia et al. (2021). More specifically, we find that the median spectrum is best reproduced by a linear combination of synthetic spectra associated with fields of 0, 2 and 4 kG and the respective filling factors 0.27 ± 0.02, 0.70 ± 0.03, and 0.03 ± 0.01.
We modeled the Stokes I and V LSD profiles of IRAS 04125+2902 using Zeeman-Doppler imaging (ZDI) to simultaneously reconstruct the topology of the large-scale magnetic field and the distribution of brightness features at the stellar surface. We also used our dT measurements to infer a relative light curve at SPIRou wavelengths (using the Planck function to convert temperature changes into brightness fluctuations) which we adjusted at the same time as the Stokes I and V LSD profiles. Given the relatively fast evolution of Bℓ (see Fig. D.1), we split our data into three subsets covering the intervals Oct.-Nov. 2024, Dec. 2024, and Feb. 2025, each spanning only a few rotation periods. We used the same code as in previous ZDI analyses of SPIRou data (e.g., Donati et al. 2023, 2024) to reconstruct the brightness distribution and the large-scale magnetic field at the rotating stellar surface from phase-resolved sets of Stokes I and V LSD profiles and dT photometry (see Appendix E).
We assumed IRAS 04125+2902 rotates as a solid body with Prot = 11.35 d, and set the inclination angle of the rotation axis to the LOS to i = 80° (to limit mirroring between hemispheres in the ZDI inversion process) and the LOS projected equatorial rotation velocity v sin i to 6.3 km s−1 (the most likely value given Prot, i and the published radius R⋆ = 1.45 ± 0.07 R⊙, Barber et al. 2024b). Finally, we set the respective filling factor of the small-scale field to fI = 0.75 (in agreement with the results of ZeeTurbo) and find that the filling factor of the large-scale field that best fits our LSD Stokes V profiles is equal to fV ≃ 0.25, slightly larger than but still consistent with that derived for other young, active low-mass stars (see, e.g., Donati et al. 2023).
The recovered large-scale magnetic topologies are dominantly poloidal, and also include a toroidal component at the stellar surface (hosting a few % of the recovered magnetic energy) in the form of two azimuthal field rings of opposite polarities encircling the star at intermediate latitudes (in each hemisphere). The poloidal component mainly consists of a dipole (with ≃90% of the poloidal energy) of polar strength 0.80−0.95 kG, slightly tilted to the rotation axis (by ≃5° towards phase 0.80 in 2024 and ≃15° towards phase 0.70 in 2025). The brightness image shows only weakly contrasted features causing the observed temperature changes (see Fig. D.1) and the associated ≃5% variation in flux (at 1750 nm). Figure 1 shows the ZDI reconstructions from the Dec. 2024 data (with the corresponding fits to the LSD Stokes IV profiles and photometry displayed in Fig. E1). The other two sets of reconstructions are similar (see Fig. E2), with the main difference being the stronger dipole field and larger dipole tilt to the rotation axis in 2025 Feb., as anticipated from our Bℓ curve whose amplitude is significantly larger at this epoch (see Fig. D.1). We also note that the cool spot located on the magnetic equator at phase 0.30 tends to migrate towards smaller phases, suggesting a small level of differential rotation at the surface of the star (with an equator rotating faster than the pole). This temporal evolution over a few month is similar to what is reported for other young low-mass stars (e.g., Zaire et al. 2024).
 |
Fig. 1. Maps of the reconstructed brightness and large-scale magnetic field of IRAS 04125+2902 derived with ZDI from 16 Stokes I and V LSD profiles and dT measurements collected between BJD 2460648 and 2460668. Left to right: Logarithmic brightness relative to the quiet photosphere, and the radial, azimuthal and meridional field components in spherical coordinates (in G). Maps are shown in a flattened polar projection down to latitude −60°, with the north pole at the center and the equator depicted as a bold line. Outer ticks indicate phases of observations. |
Our modeling yields an average small-scale field of 1.4 kG in 2024 and 1.5 kG in 2025, which is in reasonable agreement with that estimated with ZeeTurbo (1.52 ± 0.05 kG).
4. Constraining the planet mass
To estimate the mass of IRAS 04125+2902 b, we attempted to detect the stellar barycentric motion induced by the planet. We derived RVs from our LSD profiles of atomic lines by describing each individual profile as a first-order Taylor expansion constructed from the median of all profiles (as in, e.g., Donati et al. 2024). We proceeded in the same way to infer RVs from our LSD profiles of CO bandhead lines, which, despite being much sparser, are insensitive to magnetic fields and, hence, to activity. All derived RVs with their uncertainties are listed in Table B.1. As is typical of low-mass stars, the CO lines are, on average, red-shifted with respect to the atomic lines (by ≃0.3 km s−1) due to the relative brightness of convective downwelling for the former.
We fit these RVs with a MCMC process, using a double quasi-periodic GP model to describe the activity (one GP for each set of lines, sharing the same Prot, i.e., with 9 hyper-parameters) and a planet signature assuming a circular orbit and the ephemeris from transit photometry (Barber et al. 2024b). The inferred GPR parameters are listed in Table F1. As expected, atomic lines contain a 2.5× larger activity signal than the CO lines (with respective average semi-amplitudes of 174 ± 38 and 69 ± 23 m s−1). The stellar rotation period we determine from the jitter is Prot = 11.32 ± 0.05 d, falling between those inferred from Bℓ and dT. The planet signature has a derived semi-amplitude of  m s−1, only slightly above the 2σ threshold.
Being derived from all spectral features simultaneously, the LBL RVs of IRAS 04125+2902 are more precise than those inferred from LSD profiles of atomic and CO lines, with error bars in the range of 6−13 m s−1 (see Table B.1). Fitting the LBL RVs with MCMC and GPR yields an even smaller semi-amplitude of the tentative 2σ planet signature  m s−1, with an activity jitter of semi-amplitude 76 ± 15 m s−1 (consistent with that in the CO lines). The resulting GPR fit is shown in Fig. 2, with corresponding parameters listed in Table F2. We note the significantly shorter decay time (of 18 ± 4 d), reflecting the higher RV precision and the larger activity level in the first third of our monitoring. The corresponding periodograms, stacked periodogram and phase-folded filtered RVs are shown in Figs. F1 and F2.
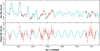 |
Fig. 2. Raw (top) and activity-filtered (bottom) LBL RVs (red circles) derived from all spectral features of IRAS 04125+2902. The top plot shows the MCMC fit to the RV data, including GPR modeling of the activity (cyan full line, with dotted lines depicting the 68% confidence intervals). The bottom plot shows the activity-filtered RVs with the best fit of the planet signature (cyan full line). The rms of RV residuals is 4 m s−1. |
The 90% and 99% upper limits on K inferred from the MCMC modeling of the LBL RVs (and further confirmed with injection-recovery tests) are 20 and 30 m s−1.  m s−1 corresponds to a planet mass of
  M♃, with 90% and 99% upper limits of 0.16 and 0.24 M♃, respectively, The bulk density is
  g cm−3, with 90% and 99% upper limits of 0.23 and 0.35 g cm−3, respectively (0.28 and 0.42 g cm−3, including the uncertainty on the planet radius).
5. Accretion and ejection from an inner disk
Emission in the Paschen-β and Brackett-γ lines of H I (1282.16 and 2166.12 nm, respectively) can be used as a measure of accretion (Natta et al. 2004; Rigliaco et al. 2012), but can also reveal outflows (Whelan et al. 2004). There is no indication of emission in our spectra of either line but Pa-β is slightly variable relative to neighboring lines (Fig. G1). The equivalent widths (EWs) of Pa-β and Br-γ are within 3.4 and 7.2 picometer (pm) respectively, of those derived from SPIRou spectra of V819 Tau and TWA 9A, young, non-accreting stars of similar spectral type. We thus used 4 and 8 pm as upper limits for the EWs of the accretion-induced emission fluxes in these two lines, with temporal variability affecting EWs at a smaller level (see Table B.1 for Pa-β). This yields maximum logarithmic accretion luminosities (in L⊙ yr−1) of −3.9 ± 0.3 using the calibrated relations of Alcalá et al. (2017), and thereby maximum logarithmic mass-accretion rates at the surface of the star log Ṁ (in M⊙ yr−1) of −11.0 ± 0.3.
Spectra of the 1083.3 nm triplet of metastable He I reveal a P Cygni-like profile with emission from the star, prominent blue-shifted absorption at ≈ − 23 km s−1 and complex variability (Fig. 3). The red-shifted side is more stable than the blue side, but in one spectrum there is absorption (red curve in Fig. 3), suggestive of infall during magnetospheric accretion (with the Pa-β EW at this epoch being ≃0.7 km s−1 smaller than average). The velocity of the persistent absorption feature (−23 km s−1) is much lower than that of stellar winds (100s of km s−1 Edwards et al. 2006; Kwan et al. 2007) and is instead indicative of a wind arising from an inner gaseous disk. P Cygni-like profiles are common among the He I lines of T Tauri stars and indicate a LOS through the wind of a highly inclined disk (Edwards et al. 2006; Erkal et al. 2022). Highly variably, blue-shifted absorption extends to −240 km s−1, beyond which it ceases, suggesting a kinematic or chemical (He I abundance) boundary These velocities are too high for thermal/photoevaporative flow (sound speeds in H are < 12 km s−1), suggesting instead a magneto-centrifugal wind. The spectrum with the most prominent blue-shifted absorption (UT 2024 Dec. 07, blue curves in Fig. 3) is the first in a series of spectra spanning two weeks showing absorption with increasing blue-shift, possibly due to structure in the wind (see Sect. 6).
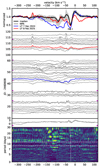 |
Fig. 3. Top panel: Median spectrum of IRAS 04125+2902 in the vicinity of the 1083-nm He I triplet, with the grey region denoting the 68% percentile range for all spectra, and the red and blue spectra those showing the largest red-shifted (0 to 110 km s−1) and blue-shifted (−240 to −50 km s−1) absorption. Middle panels: Differential spectra relative to the median obtained at individual visits, spaced according to the relative epoch (note the two gaps in time). The red and blue spectra are as in the top panel and magenta ticks mark planet transits. Bottom panel: Lomb-Scargle periodogram, with horizontal lines marking the 8.83- and 11.3-d planet orbital and stellar rotational periods, and the vertical line marking the stable absorption feature at −23 km s−1. |
6. Summary and discussion
We carried out spectropolarimetric monitoring of the planet-hosting transitional T Tauri star IRAS 04125+2902 with SPIRou at CFHT over 118 d, securing 40 high-quality Stokes I and V spectra. By applying LSD and LBL to these data, we recovered Zeeman signatures and temperature variations demonstrating that the stellar surface has variations in brightness and magnetic fields. Both Bℓ and dT are modulated at Prot and the modulation pattern of both quantities evolves over 118 d. From the Zeeman broadening of magnetically sensitive lines, we infer that the small-scale surface field reaches 1.52 ± 0.05 kG.
Our RV analysis only marginally detects the Keplerian signature of the planet, with LBL RVs yielding a semi-amplitude of  m s−1. The corresponding planet mass is
  M♃, with 90% and 99% upper limits of 0.16 and 0.24 M♃, yielding a bulk density of
  g cm−3 with 90% and 99% upper limits of 0.23 and 0.35 g cm−3 (0.28 and 0.42 g cm−3 including the uncertainty on the planet radius). We rule out the scenario that IRAS 04125+2902 b is a Jovian planet and instead favor the scenario of a progenitor of a (sub) Neptune with a hydrogen-rich envelope inflated by the entropy of formation. IRAS 04125+2902 b resembles AU Mic b in this respect (Mallorquín et al. 2024) and to a lesser extent V1298 b and c (Barat et al. 2024), but not AU Mic c whose bulk density is much higher. Our result demonstrates that newly formed planets need time to settle into their mature characteristics, especially those closest to their host stars. We can also rule out the planet as a sink for the angular momentum (AM) that would otherwise have spun up IRAS 04125+2902 since a Neptune-mass IRAS 04125+2902 b would contain no more than 3% of the total.
Application of ZDI to the Stokes I and V LSD profiles and the photometry derived from dT shows that the large-scale magnetic field of IRAS 04125+2902 is dominated by a dipole field with a strength 0.80−0.95 kG inclined to the rotation axis by 5° (in 2024) to 15° (in 2025). The star also hosts a surface toroidal field, in the form of two azimuthal field rings of opposite polarities (one in each hemisphere) encircling the star at mid-latitudes.
IRAS 04125+2902 was identified as a possible low accretor (Espaillat et al. 2015), but no excess emission appears in the Pa-β and Br-γ lines of H I, limiting accretion at the surface of the star to a maximum log Ṁ (in M⊙ yr−1) of ≃11.0 ± 0.3. However, persistent and variable blue-shifted absorption, along with episodic red-shifted absorption in the 1083 nm He I triplet unambiguously indicate the presence of an inner gaseous disk, well within the 20-au inner edge of the disk detected at IR/mm wavelengths. Similarly, Thanathibodee et al. (2022) found that 30% of a sample of disk-hosting stars without elevated H-α emission indicative of accretion exhibit He I absorption.
Combining the limit on Ṁ with our measurement of the large-scale magnetic dipole field in the expression of Bessolaz et al. (2008) yields a lower limit on the magnetosphere size and disk truncation radius rmag of 16 ± 3 R⋆ or equivalently rmag ≥ 1.75 ± 0.35 rcor where rcor is the corotation radius, meaning that IRAS 04125+2902 is in the “propeller” regime of accretion (Romanova et al. 2004; Ustyugova et al. 2006; Zanni & Ferreira 2013), with the inner disk gas being expelled outwards in a magnetocentrifugal wind, presumably the one detected in He I. IRAS 04125+2902 shares similarities with the weak propeller case of Romanova et al. (2018), where most disc gas is expelled at velocities exceeding half the escape velocity (of 300 km s−1) and only a small fraction is accreted onto the star. The detected azimuthal field rings may trace sheared field lines connecting the star to the disk and its wind beyond rcor and allowing for outward AM transfer, possibly maintaining the slow stellar rotation. We speculate that accretion onto IRAS 04125+2902 was reduced by the disruption of its disk by the stellar companion, placing it prematurely into a propeller regime that has delayed its spin-up. Its current slower rotation and concomitant lower activity have allowed, in turn the photometric detection of its transiting planet.
Figure 4 illustrates a plausible geometry for the system. An inner gas disk could survive the present level of accretion for the age of the star if its initial mass was ≳10−4 M⊙, but it could be fed from an outer disk in the manner of the PDS 70 system (Gaidos et al. 2024; Pinilla et al. 2024). The stable feature at −23 km s−1 could be produced by slower flow near the foot of the wind at low inclination to the LOS, while the variable, highly blue-shifted absorption could represent the faster region of the wind almost parallel to the LOS, with the bound to variability at −240 km s−1 representing the entry point of our LOS into the wind. The tentative periodic signals in the range of periods 12−25 d in the absorption between −100 and −150 km s−1 (bottom panel of Fig. 3) may correspond to Keplerian periods between rcor and rmag where a wind could be launched.
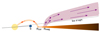 |
Fig. 4. Illustration of the IRAS 04125+2902 system with the central star, planet (on a slightly inclined orbit), inner gaseous disk, and magnetocentrifugal wind, showing how the line of sight could produce the features in the SPIRou spectrum of the He I line. |
More intriguing is the blue-shifted absorption event that appears after the transit of IRAS 04125+2902 b, peaks ∼1 d after the transit (blue curve) and lasts about two weeks, with the peak absorption moving from about −40 to −180 km s−1. This could probe a gas over-density moving directly towards us and covering ∼1 au along the LOS. Alternatively, our LOS could be passing through an extended structure, e.g., a spiral arm extending from the inner edge where velocities are slower, to further out where gas is accelerated. Since IRAS 04125+2902 b is not likely to be massive enough to gravitationally excite spiral waves (Baruteau et al. 2014), alternative mechanisms could be excitation by thermal effects (Zhu et al. 2025, shocks or shadowing) or the planet’s magnetic field, or a trail of gas from the planet itself. With IRAS 04125+2902 b located well within the stellar magnetosphere, we can also expect star-planet magnetic interactions and the generation of radio emission through the electron cyclotron maser instability (Kavanagh et al. 2021).
Additional RV observations could further constrain the mass of IRAS 04125+2902 b. A sub-Saturn mass and density would imply an extended low molecular weight atmosphere that is an attractive target for transit transmission spectroscopy (e.g., with HST or JWST, Barat et al. 2024; Thao et al. 2024). Long-term spectropolarimetric monitoring with SPIRou could reveal an evolution in the strength and geometry of the magnetic field, as seen for other T Tauri stars (e.g., Donati et al. 2024). Furthermore, the He I line could be used to investigate the response of the inner disk and its wind to these changes. Observations at higher cadence could search for a repetition of the accelerating blue-shifted absorption transient and evaluate whether there is a potential connection with the planet. More sensitive searches for inner-disk gas (e.g., in CO lines with ALMA) and dust (with JWST) are also warranted. Finally, radio observations of IRAS 04125+2902 with, e.g., LOFAR, to detect and characterize star-planet magnetic interactions (Kavanagh et al. 2021) could ultimately allow us to constrain the planet’s magnetic field.
Acknowledgments
EG and AM were supported by NASA Awards 80NSSC20K0957 and 80NSSC25K7148 (Exoplanets Research Program). Our study is based on data obtained at the CFHT, operated by the CNRC (Canada), INSU/CNRS (France) and the University of Hawai’i.
References
- Alcalá, J. M., Manara, C. F., Natta, A., et al. 2017, A&A, 600, A20 [NASA ADS] [CrossRef] [EDP Sciences] [Google Scholar]
- Artigau, É., Cadieux, C., Cook, N. J., et al. 2022, AJ, 164, 84 [NASA ADS] [CrossRef] [Google Scholar]
- Artigau, É., Cadieux, C., Cook, N. J., et al. 2024, AJ, 168, 252 [Google Scholar]
- Barat, S., Désert, J.-M., Goyal, J. M., et al. 2024, A&A, 692, A198 [NASA ADS] [CrossRef] [EDP Sciences] [Google Scholar]
- Barber, M. G., Thao, P. C., Mann, A. W., et al. 2024a, ApJ, 973, L30 [Google Scholar]
- Barber, M. G., Mann, A. W., Vanderburg, A., et al. 2024b, Nature, 635, 574 [NASA ADS] [CrossRef] [Google Scholar]
- Baruteau, C., Crida, A., Paardekooper, S. J., et al. 2014, in Protostars and Planets VI, eds. H. Beuther, R. S. Klessen, C. P. Dullemond, & T. Henning, 667 [Google Scholar]
- Bessolaz, N., Zanni, C., Ferreira, J., Keppens, R., & Bouvier, J. 2008, A&A, 478, 155 [NASA ADS] [CrossRef] [EDP Sciences] [Google Scholar]
- Chib, S., & Jeliazkov, I. 2001, J. Am. Stat. Assoc., 96, 270 [Google Scholar]
- Cook, N. J., Artigau, É., Doyon, R., et al. 2022, PASP, 134, 114509 [NASA ADS] [CrossRef] [Google Scholar]
- Cristofari, P. I., Donati, J. F., Folsom, C. P., et al. 2023, MNRAS, 522, 1342 [NASA ADS] [CrossRef] [Google Scholar]
- Dai, F., Goldberg, M., Batygin, K., et al. 2024, AJ, 168, 239 [NASA ADS] [CrossRef] [Google Scholar]
- Donati, J.-F., Semel, M., Carter, B. D., Rees, D. E., & Collier Cameron, A. 1997, MNRAS, 291, 658 [NASA ADS] [CrossRef] [Google Scholar]
- Donati, J.-F., Howarth, I. D., Jardine, M. M., et al. 2006, MNRAS, 370, 629 [NASA ADS] [CrossRef] [Google Scholar]
- Donati, J. F., Kouach, D., Moutou, C., et al. 2020, MNRAS, 498, 5684 [Google Scholar]
- Donati, J. F., Cristofari, P. I., Finociety, B., et al. 2023, MNRAS, 525, 455 [NASA ADS] [CrossRef] [Google Scholar]
- Donati, J. F., Cristofari, P. I., Alencar, S. H. P., et al. 2024, MNRAS, 535, 3363 [Google Scholar]
- Edwards, S., Fischer, W., Hillenbrand, L., & Kwan, J. 2006, ApJ, 646, 319 [Google Scholar]
- Erkal, J., Manara, C. F., Schneider, P. C., et al. 2022, A&A, 666, A188 [NASA ADS] [CrossRef] [EDP Sciences] [Google Scholar]
- Espaillat, C., Andrews, S., Powell, D., et al. 2015, ApJ, 807, 156 [Google Scholar]
- Fernandes, R. B., Bergsten, G. J., Mulders, G. D., et al. 2025, AJ, 169, 208 [Google Scholar]
- Finociety, B., & Donati, J. F. 2022, MNRAS, 516, 5887 [NASA ADS] [CrossRef] [Google Scholar]
- Furlan, E., Watson, D. M., McClure, M. K., et al. 2009, ApJ, 703, 1964 [Google Scholar]
- Gaidos, E., Thanathibodee, T., Hoffman, A., et al. 2024, ApJ, 966, 167 [NASA ADS] [CrossRef] [Google Scholar]
- Gehrig, L., Gaidos, E., & Güdel, M. 2023, A&A, 675, A179 [NASA ADS] [CrossRef] [EDP Sciences] [Google Scholar]
- Green, G. 2018, J. Open Source Soft., 3, 695 [NASA ADS] [CrossRef] [Google Scholar]
- Haywood, R. D., Collier Cameron, A., Queloz, D., et al. 2014, MNRAS, 443, 2517 [Google Scholar]
- Kavanagh, R. D., Vidotto, A. A., Klein, B., et al. 2021, MNRAS, 504, 1511 [Google Scholar]
- Kwan, J., Edwards, S., & Fischer, W. 2007, ApJ, 657, 897 [Google Scholar]
- Landi degl’Innocenti, E., & Landolfi, M. 2004, Polarisation in spectral lines (Dordrecht/Boston/London: Kluwer Academic Publishers) [CrossRef] [Google Scholar]
- López-Valdivia, R., Sokal, K. R., Mace, G. N., et al. 2021, ApJ, 921, 53 [CrossRef] [Google Scholar]
- Luhman, K. L. 2025, AJ, 169, 179 [Google Scholar]
- Luhman, K. L., Mamajek, E. E., Allen, P. R., Muench, A. A., & Finkbeiner, D. P. 2009, ApJ, 691, 1265 [NASA ADS] [CrossRef] [Google Scholar]
- Mallorquín, M., Béjar, V. J. S., Lodieu, N., et al. 2024, A&A, 689, A132 [NASA ADS] [CrossRef] [EDP Sciences] [Google Scholar]
- Natta, A., Testi, L., Muzerolle, J., et al. 2004, A&A, 424, 603 [NASA ADS] [CrossRef] [EDP Sciences] [Google Scholar]
- Pinilla, P., Benisty, M., Waters, R., Bae, J., & Facchini, S. 2024, A&A, 686, A135 [NASA ADS] [CrossRef] [EDP Sciences] [Google Scholar]
- Rajpaul, V., Aigrain, S., Osborne, M. A., Reece, S., & Roberts, S. 2015, MNRAS, 452, 2269 [Google Scholar]
- Rebull, L. M., Stauffer, J. R., Cody, A. M., et al. 2020, AJ, 159, 273 [Google Scholar]
- Rigliaco, E., Natta, A., Testi, L., et al. 2012, A&A, 548, A56 [NASA ADS] [CrossRef] [EDP Sciences] [Google Scholar]
- Romanova, M. M., Ustyugova, G. V., Koldoba, A. V., & Lovelace, R. V. E. 2004, ApJ, 616, L151 [CrossRef] [Google Scholar]
- Romanova, M. M., Blinova, A. A., Ustyugova, G. V., Koldoba, A. V., & Lovelace, R. V. E. 2018, New Astron., 62, 94 [Google Scholar]
- Ryabchikova, T., Piskunov, N., Kurucz, R. L., et al. 2015, Phys. Scr., 90, 054005 [Google Scholar]
- Serna, J., Hernandez, J., Kounkel, M., et al. 2021, ApJ, 923, 177 [NASA ADS] [CrossRef] [Google Scholar]
- Skilling, J., & Bryan, R. K. 1984, MNRAS, 211, 111 [NASA ADS] [CrossRef] [Google Scholar]
- Thanathibodee, T., Calvet, N., Hernández, J., Maucó, K., & Briceño, C. 2022, AJ, 163, 74 [NASA ADS] [CrossRef] [Google Scholar]
- Thao, P. C., Mann, A. W., Feinstein, A. D., et al. 2024, AJ, 168, 297 [Google Scholar]
- Ustyugova, G. V., Koldoba, A. V., Romanova, M. M., & Lovelace, R. V. E. 2006, ApJ, 646, 304 [Google Scholar]
- Whelan, E. T., Ray, T. P., & Davis, C. J. 2004, A&A, 417, 247 [NASA ADS] [CrossRef] [EDP Sciences] [Google Scholar]
- Zaire, B., Donati, J. F., Alencar, S. P., et al. 2024, MNRAS, 533, 2893 [Google Scholar]
- Zanni, C., & Ferreira, J. 2013, A&A, 550, A99 [NASA ADS] [CrossRef] [EDP Sciences] [Google Scholar]
- Zhu, Z., Zhang, S., & Johnson, T. M. 2025, ApJ, 980, 259 [Google Scholar]
Appendix A: TESS light curve during sector 86
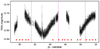 |
Fig. A.1. 200-sec cadence TESS light curve of IRAS 04125+2902 during Sector 86, as obtained by TESSExtractor (Serna et al. 2021), showing rotational variability and a single flare. Red triangles indicate epochs of SPIRou observations and vertical dotted lines indicate transits of the planet IRAS 04125+2902 b. |
Appendix B: Observation log
Table B.1 gives the full log and associated Bℓ, dT, RV and Pa-β EW measurements at each observing epoch from our SPIRou spectra of IRAS 04125+2902.
Log of our SPIRou observations of IRAS 04125+2902 in semesters 2024B and 2025A.
Appendix C: Gaussian process regression
To investigate the rotational modulation of the Bℓ and dT data, allowing for a temporal evolution of the modulation pattern, we used quasi-periodic GPR. This is achieved by finding out the hyper parameters of the covariance function that best describes our data, arranged in a vector denoted as y. The quasi-periodic covariance function c(t, t′) we used in this purpose is as follows:
 (C.1)
(C.1)
where θ1 is the amplitude of the GP, θ2 its recurrence period (directly linked to Prot), θ3 the evolution timescale (in d) on which the shape of the modulation changes, and θ4 a smoothing parameter describing the amount of harmonic complexity needed to describe the data (Haywood et al. 2014; Rajpaul et al. 2015). We then select the set of hyper parameters that yields the highest likelihood ℒ, defined by:
 (C.2)
(C.2)
where C is the covariance matrix for our epochs, Σ the diagonal variance matrix associated with y, and S = θ52J (J being the identity matrix) the contribution from an additional white noise source used as a fifth hyper-parameter θ5. Finally, we used a MCMC process to explore the hyper-parameter domain, yielding posterior distributions and error bars for each of them. The marginal logarithmic likelihood logℒM of a given solution is computed using the approach of Chib & Jeliazkov (2001) as in, e.g., Haywood et al. (2014).
Appendix D: Magnetic field and temperature fluctuations
Results of our GPR MCMC modeling of the Bℓ (top rows) and dT (bottom rows) curves of IRAS 04125+2902.
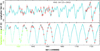 |
Fig. D.1. Longitudinal magnetic field Bℓ (top panel) and temperature changes dT (bottom panel) of IRAS 04125+2902 (red open circles) as measured with SPIRou, and quasi-periodic GPR fit to the data (cyan full line) with corresponding 68% confidence intervals (cyan dotted lines). |
Appendix E: Zeeman-Doppler imaging
ZDI allows us to reconstruct the brightness distribution and the large-scale magnetic field at the surface of a rotating star from phase-resolved sets of Stokes I and V LSD profiles and contemporaneous photometry. This is performed through an iterative process, starting from a small magnetic field and a featureless brightness map and progressively adding information at the surface of the star until the modeled profiles and photometry match the observed ones at the required level, usually a unit reduced chi-square χr2 ≃ 1. As this inversion problem is ill-posed, regularization is required to ensure a unique solution; in our case, we use the principles of maximum entropy image reconstruction (Skilling & Bryan 1984) to select the image that features minimal information among those matching the data.
In practice, we modeled the stellar surface as a grid of 5000 cells, whose spectral contributions are computed using Unno-Rachkovsky’s analytical solution of the polarized radiative transfer equation in a plane-parallel Milne Eddington atmosphere (Landi degl’Innocenti & Landolfi 2004), with a local profile centered on 1750 nm and featuring a Doppler width and Landé factor of 2.5 km s−1 and 1.2 respectively (as in previous studies). We then computed the synthetic profiles at the observed rotation cycles by summing the contributions of all grid cells, taking into account their respective velocities with respect to the observer. Relative brightness at the surface of the star is simply described as a series of independent values, whereas the large-scale magnetic field is expressed as a spherical harmonic expansion in which the poloidal and toroidal components of the vector field are parametrized with three independent sets of complex coefficients (Donati et al. 2006; Finociety & Donati 2022).
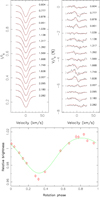 |
Fig. E.1. Top panels: Observed (black line) and ZDI modeled (red line) LSD Stokes I (left) and V (right) profiles of IRAS 04125+2902 for our 2024 December data set. Both fits to the LSD Stokes I and V profiles yield χr2 = 1, i.e., are consistent with the data down to photon noise. Rotation cycles (counting from 3, see Table B.1) are indicated to the right of the LSD profiles, while ±1σ error bars are added to the left of the Stokes V signatures. Bottom panel: Photometry derived from dT (red circles) and ZDI fit (green line), reproducing most of the observed variability caused by large surface brightness features. |
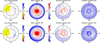 |
Fig. E.2. Same as Fig. 1 for the other two subsets (October+November 2024 and February 2025 in the top and bottom row respectively), showing the limited temporal evolution in the brightness and magnetic maps over the 118 d of our monitoring. |
Appendix F: GPR fit and periodograms of RV curves
Same as Table D1 for our joint modeling of the RV curves of atomic and CO lines of IRAS 04125+2902.
Same as Table F1 for the LBL RVs.
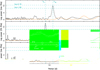 |
Fig. F.1. Periodograms of the raw (top plot), filtered (middle plot) and residual (bottom plot) LBL RVs of IRAS 04125+2902. The cyan vertical dashed lines trace the derived Prot and known orbital period Pb of IRAS 04125+2902 b, whereas the horizontal dashed lines indicate the 1 per cent and 0.1 per cent false alarm probabilities in the periodograms of our RV data. The orange curve depicts the periodogram of the window function. |
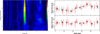 |
Fig. F.2. Stacked periodograms (left panel) and phase-folded (right panel, top plot) filtered RVs of IRAS 04125+2902. The stacked periodogram (with colors coding periodogram power) shows a marginal signal at the orbital period that strengthens as RV points are added to the analysis. In the right panel, the black stars show the RVs averaged over phase bins of 10%, with the phase-folded residuals displayed in the bottom plot. |
Appendix F: Paschen β and Brackett γ lines
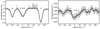 |
Fig. G.1. SPIRou median and rms spectrum of IRAS 04125+2902 in the vicinity of the Paschen β (left panel) and Brackett γ (right panel) of H I. Marginally larger variability shows up in Paschen β relative to the neighboring lines of Ca I and Ti I. Residuals of OH emission lines are responsible for the positive features in the 68% scatter. |
All Tables
Log of our SPIRou observations of IRAS 04125+2902 in semesters 2024B and 2025A.
Results of our GPR MCMC modeling of the Bℓ (top rows) and dT (bottom rows) curves of IRAS 04125+2902.
Same as Table D1 for our joint modeling of the RV curves of atomic and CO lines of IRAS 04125+2902.
All Figures
|
Fig. 1. Maps of the reconstructed brightness and large-scale magnetic field of IRAS 04125+2902 derived with ZDI from 16 Stokes I and V LSD profiles and dT measurements collected between BJD 2460648 and 2460668. Left to right: Logarithmic brightness relative to the quiet photosphere, and the radial, azimuthal and meridional field components in spherical coordinates (in G). Maps are shown in a flattened polar projection down to latitude −60°, with the north pole at the center and the equator depicted as a bold line. Outer ticks indicate phases of observations. |
| In the text | |
|
Fig. 2. Raw (top) and activity-filtered (bottom) LBL RVs (red circles) derived from all spectral features of IRAS 04125+2902. The top plot shows the MCMC fit to the RV data, including GPR modeling of the activity (cyan full line, with dotted lines depicting the 68% confidence intervals). The bottom plot shows the activity-filtered RVs with the best fit of the planet signature (cyan full line). The rms of RV residuals is 4 m s−1. |
| In the text | |
|
Fig. 3. Top panel: Median spectrum of IRAS 04125+2902 in the vicinity of the 1083-nm He I triplet, with the grey region denoting the 68% percentile range for all spectra, and the red and blue spectra those showing the largest red-shifted (0 to 110 km s−1) and blue-shifted (−240 to −50 km s−1) absorption. Middle panels: Differential spectra relative to the median obtained at individual visits, spaced according to the relative epoch (note the two gaps in time). The red and blue spectra are as in the top panel and magenta ticks mark planet transits. Bottom panel: Lomb-Scargle periodogram, with horizontal lines marking the 8.83- and 11.3-d planet orbital and stellar rotational periods, and the vertical line marking the stable absorption feature at −23 km s−1. |
| In the text | |
|
Fig. 4. Illustration of the IRAS 04125+2902 system with the central star, planet (on a slightly inclined orbit), inner gaseous disk, and magnetocentrifugal wind, showing how the line of sight could produce the features in the SPIRou spectrum of the He I line. |
| In the text | |
|
Fig. A.1. 200-sec cadence TESS light curve of IRAS 04125+2902 during Sector 86, as obtained by TESSExtractor (Serna et al. 2021), showing rotational variability and a single flare. Red triangles indicate epochs of SPIRou observations and vertical dotted lines indicate transits of the planet IRAS 04125+2902 b. |
| In the text | |
|
Fig. D.1. Longitudinal magnetic field Bℓ (top panel) and temperature changes dT (bottom panel) of IRAS 04125+2902 (red open circles) as measured with SPIRou, and quasi-periodic GPR fit to the data (cyan full line) with corresponding 68% confidence intervals (cyan dotted lines). |
| In the text | |
|
Fig. E.1. Top panels: Observed (black line) and ZDI modeled (red line) LSD Stokes I (left) and V (right) profiles of IRAS 04125+2902 for our 2024 December data set. Both fits to the LSD Stokes I and V profiles yield χr2 = 1, i.e., are consistent with the data down to photon noise. Rotation cycles (counting from 3, see Table B.1) are indicated to the right of the LSD profiles, while ±1σ error bars are added to the left of the Stokes V signatures. Bottom panel: Photometry derived from dT (red circles) and ZDI fit (green line), reproducing most of the observed variability caused by large surface brightness features. |
| In the text | |
|
Fig. E.2. Same as Fig. 1 for the other two subsets (October+November 2024 and February 2025 in the top and bottom row respectively), showing the limited temporal evolution in the brightness and magnetic maps over the 118 d of our monitoring. |
| In the text | |
|
Fig. F.1. Periodograms of the raw (top plot), filtered (middle plot) and residual (bottom plot) LBL RVs of IRAS 04125+2902. The cyan vertical dashed lines trace the derived Prot and known orbital period Pb of IRAS 04125+2902 b, whereas the horizontal dashed lines indicate the 1 per cent and 0.1 per cent false alarm probabilities in the periodograms of our RV data. The orange curve depicts the periodogram of the window function. |
| In the text | |
|
Fig. F.2. Stacked periodograms (left panel) and phase-folded (right panel, top plot) filtered RVs of IRAS 04125+2902. The stacked periodogram (with colors coding periodogram power) shows a marginal signal at the orbital period that strengthens as RV points are added to the analysis. In the right panel, the black stars show the RVs averaged over phase bins of 10%, with the phase-folded residuals displayed in the bottom plot. |
| In the text | |
|
Fig. G.1. SPIRou median and rms spectrum of IRAS 04125+2902 in the vicinity of the Paschen β (left panel) and Brackett γ (right panel) of H I. Marginally larger variability shows up in Paschen β relative to the neighboring lines of Ca I and Ti I. Residuals of OH emission lines are responsible for the positive features in the 68% scatter. |
| In the text | |
Current usage metrics show cumulative count of Article Views (full-text article views including HTML views, PDF and ePub downloads, according to the available data) and Abstracts Views on Vision4Press platform.
Data correspond to usage on the plateform after 2015. The current usage metrics is available 48-96 hours after online publication and is updated daily on week days.
Initial download of the metrics may take a while.