Fig. F.1.
Download original image
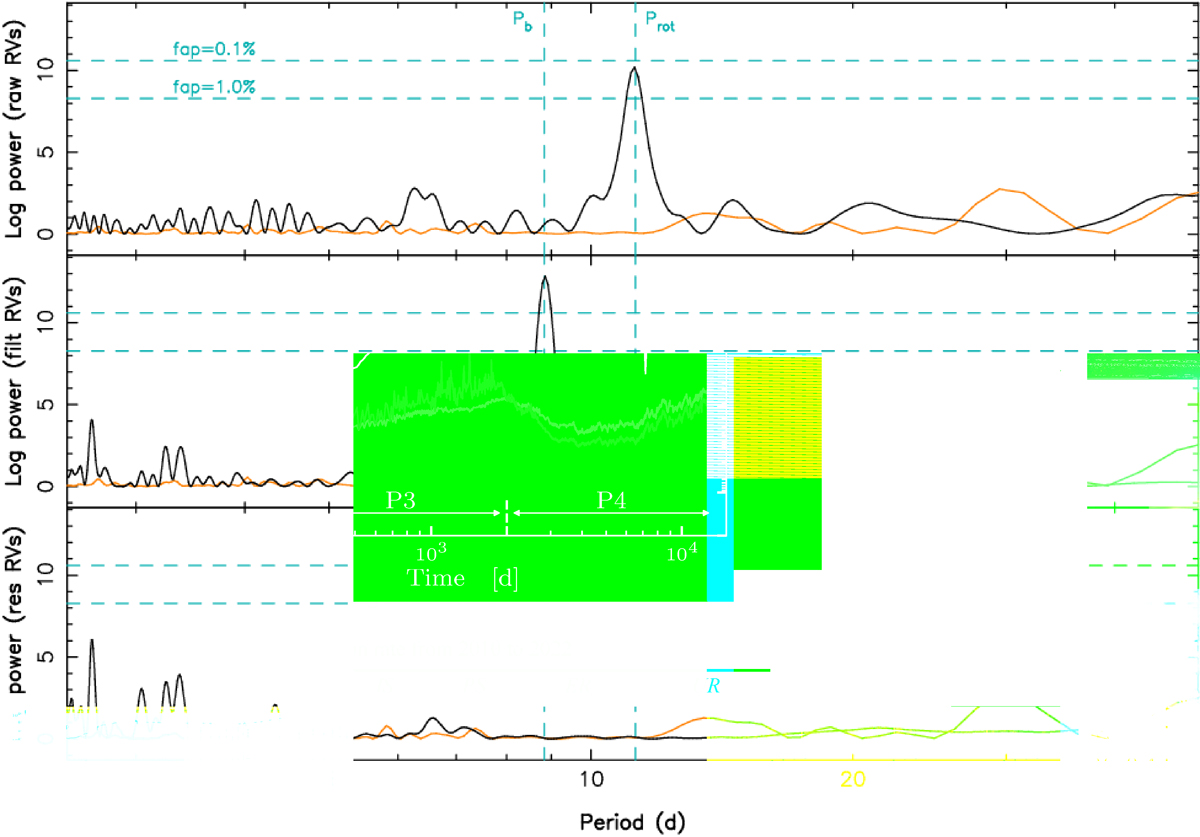
Periodograms of the raw (top plot), filtered (middle plot) and residual (bottom plot) LBL RVs of IRAS 04125+2902. The cyan vertical dashed lines trace the derived Prot and known orbital period Pb of IRAS 04125+2902 b, whereas the horizontal dashed lines indicate the 1 per cent and 0.1 per cent false alarm probabilities in the periodograms of our RV data. The orange curve depicts the periodogram of the window function.
Current usage metrics show cumulative count of Article Views (full-text article views including HTML views, PDF and ePub downloads, according to the available data) and Abstracts Views on Vision4Press platform.
Data correspond to usage on the plateform after 2015. The current usage metrics is available 48-96 hours after online publication and is updated daily on week days.
Initial download of the metrics may take a while.