Fig. 3.
Download original image
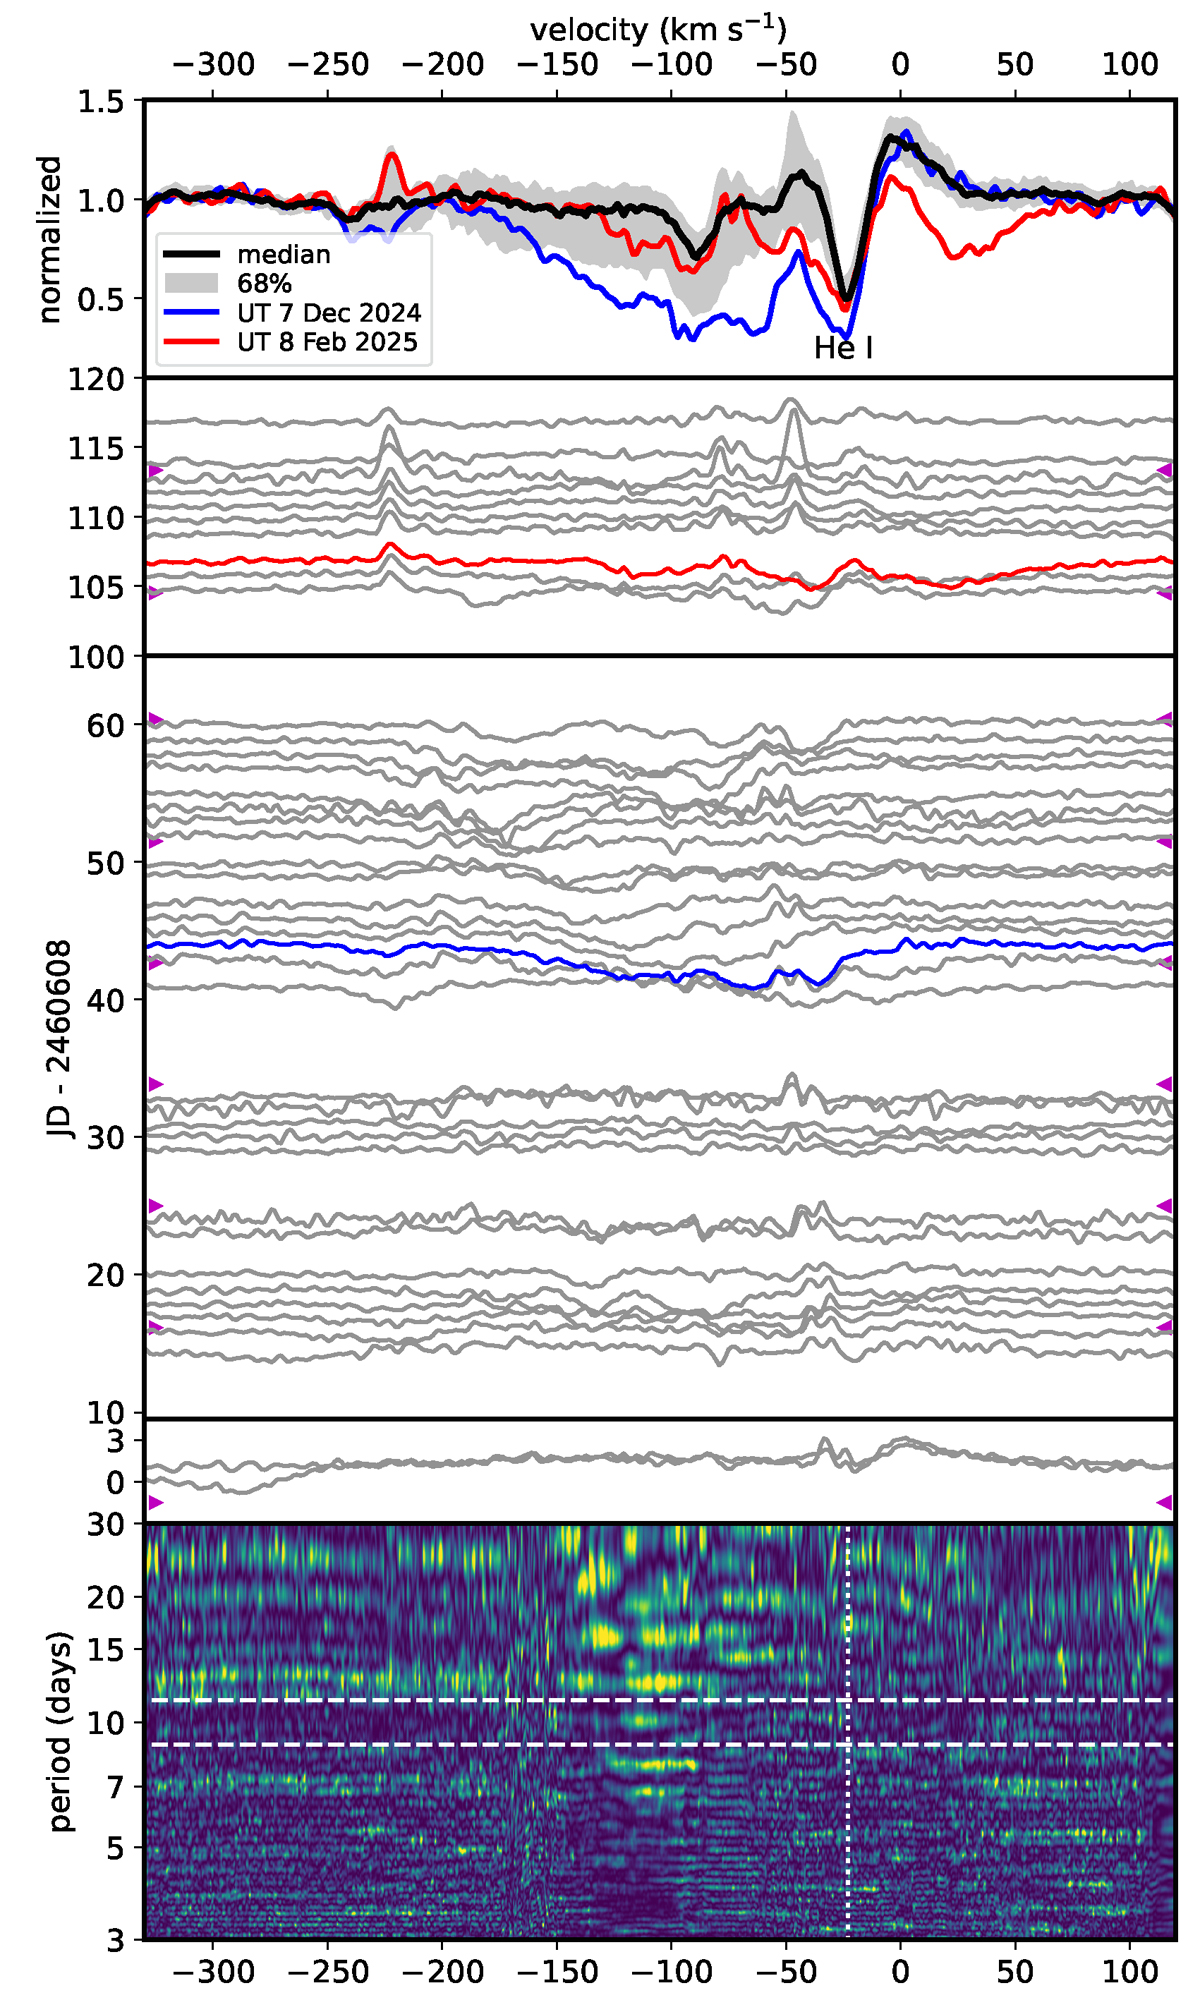
Top panel: Median spectrum of IRAS 04125+2902 in the vicinity of the 1083-nm He I triplet, with the grey region denoting the 68% percentile range for all spectra, and the red and blue spectra those showing the largest red-shifted (0 to 110 km s−1) and blue-shifted (−240 to −50 km s−1) absorption. Middle panels: Differential spectra relative to the median obtained at individual visits, spaced according to the relative epoch (note the two gaps in time). The red and blue spectra are as in the top panel and magenta ticks mark planet transits. Bottom panel: Lomb-Scargle periodogram, with horizontal lines marking the 8.83- and 11.3-d planet orbital and stellar rotational periods, and the vertical line marking the stable absorption feature at −23 km s−1.
Current usage metrics show cumulative count of Article Views (full-text article views including HTML views, PDF and ePub downloads, according to the available data) and Abstracts Views on Vision4Press platform.
Data correspond to usage on the plateform after 2015. The current usage metrics is available 48-96 hours after online publication and is updated daily on week days.
Initial download of the metrics may take a while.