Open Access
Fig. E.2.
Download original image
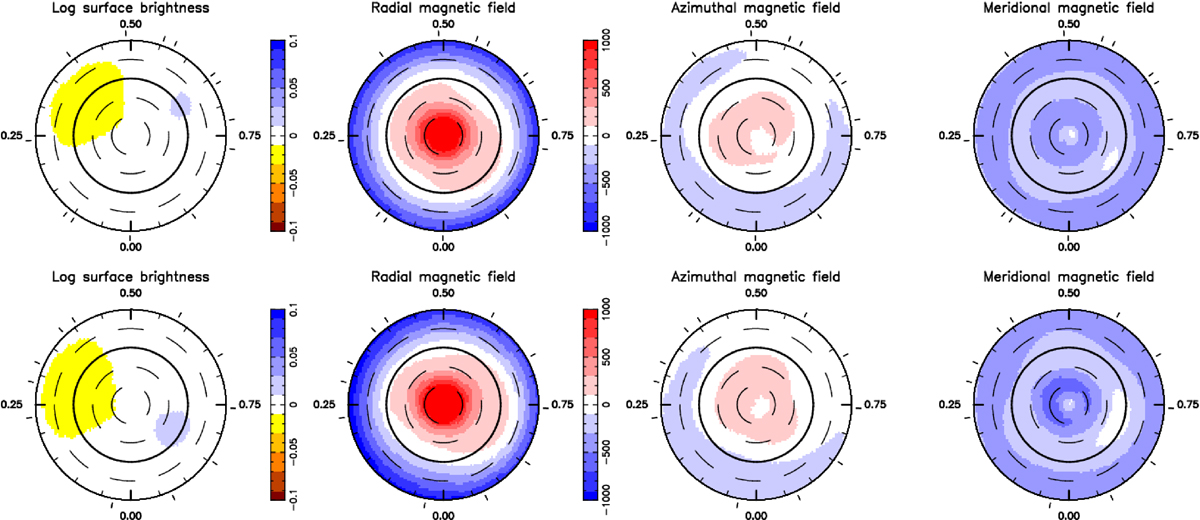
Same as Fig. 1 for the other two subsets (October+November 2024 and February 2025 in the top and bottom row respectively), showing the limited temporal evolution in the brightness and magnetic maps over the 118 d of our monitoring.
Current usage metrics show cumulative count of Article Views (full-text article views including HTML views, PDF and ePub downloads, according to the available data) and Abstracts Views on Vision4Press platform.
Data correspond to usage on the plateform after 2015. The current usage metrics is available 48-96 hours after online publication and is updated daily on week days.
Initial download of the metrics may take a while.