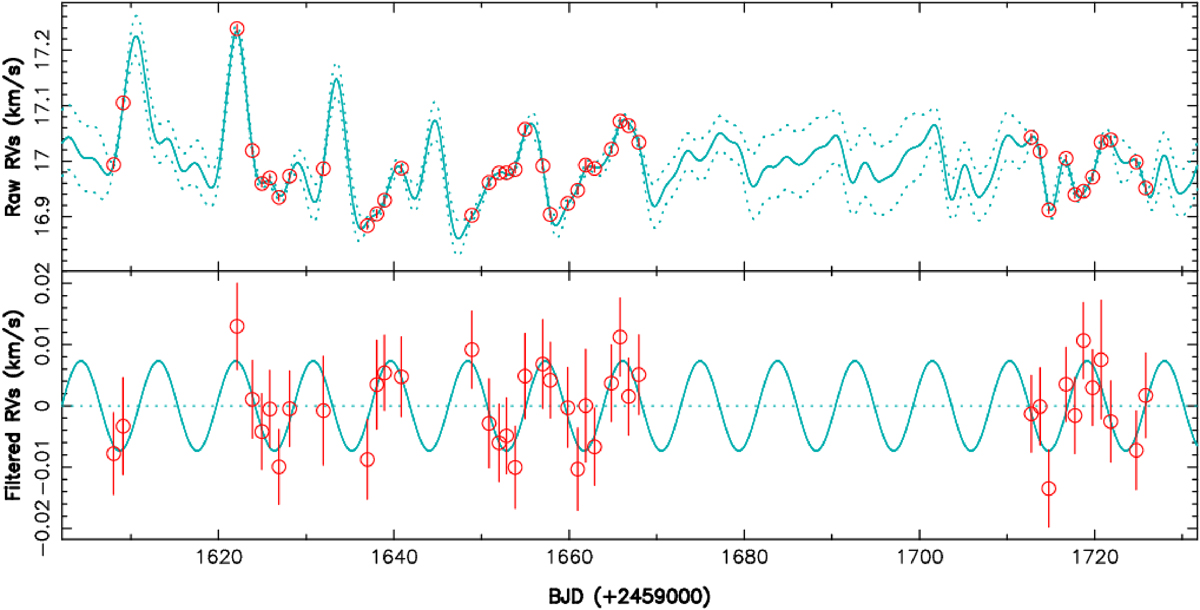
Fig. 2.
Download original image
Raw (top) and activity-filtered (bottom) LBL RVs (red circles) derived from all spectral features of IRAS 04125+2902. The top plot shows the MCMC fit to the RV data, including GPR modeling of the activity (cyan full line, with dotted lines depicting the 68% confidence intervals). The bottom plot shows the activity-filtered RVs with the best fit of the planet signature (cyan full line). The rms of RV residuals is 4 m s−1.
Current usage metrics show cumulative count of Article Views (full-text article views including HTML views, PDF and ePub downloads, according to the available data) and Abstracts Views on Vision4Press platform.
Data correspond to usage on the plateform after 2015. The current usage metrics is available 48-96 hours after online publication and is updated daily on week days.
Initial download of the metrics may take a while.