Fig. F.2.
Download original image
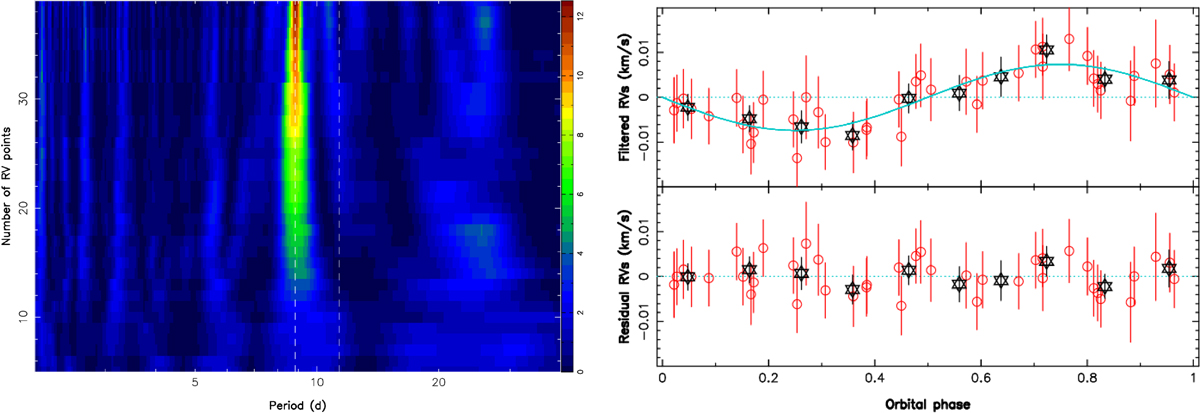
Stacked periodograms (left panel) and phase-folded (right panel, top plot) filtered RVs of IRAS 04125+2902. The stacked periodogram (with colors coding periodogram power) shows a marginal signal at the orbital period that strengthens as RV points are added to the analysis. In the right panel, the black stars show the RVs averaged over phase bins of 10%, with the phase-folded residuals displayed in the bottom plot.
Current usage metrics show cumulative count of Article Views (full-text article views including HTML views, PDF and ePub downloads, according to the available data) and Abstracts Views on Vision4Press platform.
Data correspond to usage on the plateform after 2015. The current usage metrics is available 48-96 hours after online publication and is updated daily on week days.
Initial download of the metrics may take a while.