| Issue |
A&A
Volume 696, April 2025
|
|
|---|---|---|
| Article Number | A45 | |
| Number of page(s) | 31 | |
| Section | Astrophysical processes | |
| DOI | https://doi.org/10.1051/0004-6361/202453577 | |
| Published online | 01 April 2025 | |
Dissecting the formation of gas-versus-star counter-rotating galaxies from the NewHorizon simulation
1
Université Côte d’Azur, Observatoire de la Côte d’Azur, CNRS, Laboratoire Lagrange, Bd de l’Observatoire, CS 34229, 06304 Nice Cedex 4, France
2
ILANCE, CNRS – University of Tokyo International Research Laboratory, Kashiwa, Chiba 277-8582, Japan
3
Kavli IPMU (WPI), UTIAS, The University of Tokyo, Kashiwa, Chiba 277-8583, Japan
4
Institut d’Astrophysique de Paris, CNRS and Sorbonne Université, UMR 7095, 98 bis Boulevard Arago, F-75014 Paris, France
5
Research Institute, Kochi University of Technology, Tosa Yamada, Kochi 782-8502, Japan
6
Department of Physics, School of Science, The University of Tokyo, 7-3-1 Hongo, Bunkyo-ku, Tokyo 113-0033, Japan
7
Research Center for the Early Universe, School of Science, The University of Tokyo, 7-3-1 Hongo, Bunkyo-ku, Tokyo 113-0033, Japan
8
Department of Astronomy and Yonsei University Observatory, Yonsei University, Seoul 03722, Republic of Korea
9
Observatoire Astronomique de Strasbourg, Université de Strasbourg, CNRS, UMR 7550, F-67000 Strasbourg, France
10
Center for Astrophysics | Harvard & Smithsonian, Cambridge, MA, USA
11
IPhT, DRF-INP, UMR 3680, CEA, L’Orme des Merisiers, Bât 774, 91191 Gif-sur-Yvette, France
12
Kyung Hee University, Dept. of Astronomy & Space Science, Yongin-shi, Gyeonggi-do 17104, Republic of Korea
⋆ Corresponding author; This email address is being protected from spambots. You need JavaScript enabled to view it.
Received:
21
December
2024
Accepted:
21
February
2025
Abstract
Gas-versus-star counter-rotating galaxies are characterized by the presence of a disk of stars and a disk of gas that are co-spatial but rotating in opposite directions. Using the NEWHORIZON simulation, we identified and studied ten such galaxies in field environments with a stellar mass of M* ∼ [1–5] × 1010 M⊙. For all of them, the retrograde accretion of gas either from gas stripping from a nearby companion or from the circumgalactic medium is the starting point of the formation process. This is followed by the coexistence of two distinct disks of gas (or components) rotating in opposite directions, with the pre-existing disk in the inner parts of the galaxy and the accreted gas in the outer parts. The latter progressively replaces the former, leading to the final gas-star kinetic misalignment configuration. During the process, star formation is first enhanced and then progressively decreases. We roughly estimate that a higher fraction of the pre-existing gas is converted into stars rather than being expelled. We also found that the black hole (BH) activity tends to be enhanced during the removal of the pre-existing gas. Furthermore, our analysis suggests that the formation of a counter-rotating gas component is always accompanied with the formation of counter-rotating stellar disks. These stellar disks can have diverse properties, but in general, they host a younger and more metal rich population of stars with respect to the main disk, depending on the star formation history and BH activity. The central part of counter-rotating disks also tend to be characterized by a younger population, an enhanced star formation rate, and a higher metallicity than their outer parts. The high metallicity comes from the progressive metal enrichment of the accreted gas through mixing with the pre-existing gas and by supernovae activity as the accreted gas sinks toward the center of the galaxy. In case of major mergers, a large amount of accreted stars from the companion would be distributed at large distances from the remnant center due to conservation of the initial orbital angular momentum. This process might favor the observation of two distinct counter-rotating stellar disks, particularly in observed projected velocity fields from integral field spectroscopy surveys, as well as stellar streams characterized by specific age-metallicity properties.
Key words: methods: numerical / galaxies: evolution / galaxies: general / galaxies: interactions / galaxies: stellar content / galaxies: kinematics and dynamics
© The Authors 2025
 Open Access article, published by EDP Sciences, under the terms of the Creative Commons Attribution License (https://creativecommons.org/licenses/by/4.0), which permits unrestricted use, distribution, and reproduction in any medium, provided the original work is properly cited.
This article is published in open access under the Subscribe to Open model. This email address is being protected from spambots. You need JavaScript enabled to view it. to support open access publication.
1. Introduction
In the traditional picture of galaxy formation, galaxies form when baryonic gas falls into the gravitational potential well of their dark matter halos. The gas is initially heated by shocks and then cools radiatively, forming dense clouds that sink to the center of the halo and in which stars are formed (Fall & Efstathiou 1980; Mo et al. 1998; Cole et al. 2000). The stellar component of galaxies, especially the disk, is thus expected to inherit most of the dynamical properties of the gas component out of which it forms. In particular, the average angular momentum (AM) vectors of both components are expected to be well aligned.
However, this traditional picture is seriously challenged by the presence of kinematic misalignments between gas and stellar components commonly observed in nearby galaxies, mainly in ∼30–40% of elliptical and lenticular galaxies. Indeed, the discovery of such galaxies has increased due to the advent of galaxy surveys using integral field spectroscopy (IFS) such as SAURON (Bacon et al. 2001), ATLAS3D (Cappellari et al. 2011), CALIFA (Sánchez et al. 2012), SAMI (Croom et al. 2012), and MaNGA (Bundy et al. 2015). In particular, these surveys permit the projected 2D maps of both stellar and gas velocity to be derived, and from these maps, one can estimate the kinematic position angle of the stars (PA*) and the gas (PAgas), which is defined as the orientation of the mean stellar and gas motions on a map of velocities. A galaxy is commonly defined as kinematically misaligned if the difference of kinematic position, ΔPA = |PA* − PAgas|, is greater than 30°. In some extreme cases, ΔPA can even be close to 180°, meaning that the stellar and gas components are counter rotating.
Due to their atypical properties, gas-versus-stars counter-rotating galaxies have been the center of particular attention in the past two decades. They indeed represent ideal laboratories to test theoretical models of galaxy formation. Most of the time, they not only own a counter-rotating gaseous component but also one or several counter-rotating stellar components. Thus, most observational studies have tried to detect and analyze these specific galaxies in order to constrain the origin of the misaligned velocity fields between gas and stellar components by characterizing their stellar populations, their gas-phase metallicity, their morphology, their kinematic properties, and their cosmological environment (e.g., Sarzi et al. 2006; Davis et al. 2011; Coccato et al. 2011; Johnston et al. 2013; García-Lorenzo et al. 2015; Jin et al. 2016; Bryant et al. 2019; Raimundo 2021; Omori & Takeuchi 2021; Li et al. 2021; Bevacqua et al. 2022; Xu et al. 2022; Zhou et al. 2022, 2024; Bao et al. 2022; Zinchenko 2023; Katkov et al. 2024).
Based on the different analyses from the literature, counter-rotating components tend to have younger stellar populations compared to the main stellar disks, and their ionized gas rotates in the same direction as the secondary stellar components; that is, it also counter rotates with respect to the main disk. Moreover, observations indicate that counter-rotating stars could have either a lower, similar, or higher metallicity with respect to stars belonging to the main disk (Coccato et al. 2011; Johnston et al. 2013; Katkov et al. 2013, 2016). In view of such observational trends, a scenario in which counter-rotating components are assembled from gas accreted on retrograde orbits from the nearby environment is privileged. The sources of cold gas accretion may be dwarf-satellite merging (Kaviraj et al. 2009) or cosmological gas filaments (Kereš et al. 2005; Dekel & Birnboim 2006; Ocvirk et al. 2008), though it is often difficult to disentangle them. The presence of different stellar populations between co- and counter-rotating stars therefore seems to rule out any internal origin of counter-rotating stars with, for instance, stars moving on retrograde orbits during a bar dissolution process (Evans & Collett 1994).
In addition, observational studies suggest that the central part of the counter-rotating stellar disks generally has a younger population, an enhanced star formation rate, and a higher metallicity compared to the outer part (Jin et al. 2016; Chen et al. 2016). The gas-stellar kinetic misalignment seems more frequent in spheroidal-dominated galaxies than in late-type galaxies (Kannappan & Fabricant 2001; Pizzella et al. 2004; Davis et al. 2011; Bryant et al. 2019; Duckworth et al. 2020), and it is also found in non-interacting systems (e.g., Sánchez et al. 2012; Katkov et al. 2014).
In parallel to observational analyses, numerical simulations have provided new insights to explain the origin of the gas-star kinetic misalignment observed in some galaxies. The simulations do support the idea that an external origin, such as gas accretion, galaxy interaction, and galaxy mergers, is generally needed. They have also confirmed that the accreted gas (from nearby galaxies of filaments) exchanges AM with the pre-existing co-rotating gas, causing it to fall toward the center of the galaxy (Thakar & Ryden 1996; Roškar et al. 2010; van de Voort et al. 2015; Taylor et al. 2018; Kimm et al. 2017; Starkenburg et al. 2019; Khim et al. 2020; Khoperskov et al. 2021; Lu et al. 2021; Cenci et al. 2024). This process may also trigger low-level active galactic nuclei (AGN) feedback (Raimundo et al. 2023) and boost the black hole (BH) luminosity and growth and significantly inject more energy into the surrounding gas (Duckworth et al. 2019). Finally, according to theoretical studies, it may be possible to distinguish between different formation paths, such as galaxy merger, galaxy fly-by, interaction with dense environments, and interaction with central galaxies in a galaxy cluster environment (Khim et al. 2021) or several accretions from different filaments (Algorry et al. 2014).
One interesting aspect that is still being debated concerns the co-evolution of the pre-existing gas disk and the accreted one. For instance, based on IllustrisTNG (Pillepich et al. 2018) and idealized simulations, Khoperskov et al. (2021) suggest that the pre-existing gas might either be mixed with the infalling component or expelled. Cenci et al. (2024) studied Milky Way mass galaxies from the FIREbox cosmological simulation (Feldmann et al. 2023; Hopkins et al. 2014). They presented the most dramatic case of kinetic misalignment in which almost all the pre-existing gas (95%) is converted into stars. Using the Illustris simulation (Vogelsberger et al. 2014; Starkenburg et al. 2019) also identified two main channels responsible for the gas loss: a strong feedback burst and gas stripping during a fly-by passage through a more massive group environment.
The aim of the present paper is to contribute to the theoretical effort by proposing a detailed analysis of the complex process of the formation of this class of galaxies. We use the NEWHORIZON simulation (Dubois et al. 2021), which allows for detailed analysis of the stellar and gas dynamics, thanks to its high spatial resolution (∼34 pc) that accurately resolves a typical scale height of galactic disks (Park et al. 2021; Yi et al. 2024). The high spatial resolution also allows for a reliable estimation of the stellar galactic disk AM, while the high mass resolution permits better characterization of the stellar population. Moreover, NEWHORIZON enables characterization of the stellar populations in each simulated galaxy (through their age and global metallicity), which is essential to constraining and interpreting the observations.
The paper is organized as follows. Section 2 briefly introduces the NEWHORIZON simulation and the numerical modeling used in this work (simulations and post-process). Section 3 presents a detailed analysis of the individual evolution of four galaxies that present differences in their formation path. Then, we discuss the main results and trends in Sect. 4. We summarize and conclude in Sect. 5.
2. Methodology
Throughout this paper, we analyze the results of the NEWHORIZON1 simulation. The details of the simulation has been described in many previous papers (e.g, Dubois et al. 2021; Peirani et al. 2024), so we only summarize here its main features.
2.1. The NewHorizon simulation
NEWHORIZON is a high-resolution zoom-in simulation from the HORIZON-AGN simulation (Dubois et al. 2014), which extracts a spherical sub-volume with a radius of 10 comoving Mpc. A standard ΛCDM cosmology was adopted with the total matter density Ωm = 0.272, the dark energy density ΩΛ = 0.728, the baryon density Ωb = 0.045, the Hubble constant H0 = 70.4 km s−1 Mpc−1, the amplitude of the matter power spectrum σ8 = 0.81 and the power-law index of the primordial power spectrum ns = 0.967, according to the WMAP-7 data (Komatsu et al. 2011). The initial conditions have been generated with MPGRAFIC (Prunet et al. 2008) at the resolution of 40963 for NEWHORIZON in contrast to 10243 for HORIZON-AGN. The dark matter mass resolution reaches 1.2 × 10⁶ M⊙ compared to 8 × 10⁷ M⊙ in HORIZON-AGN. As far as star particles are concerned, their typical mass resolution is ∼104 M⊙ for NEWHORIZON.
Both simulations were run with the RAMSES code (Teyssier 2002) in which the gas component is evolved using a second-order Godunov scheme and the approximate Harten-Lax-Van Leer-Contact (HLLC; Toro 1999) Riemann solver with linear interpolation of the cell-centered quantities at cell interfaces using a minmod total variation diminishing scheme. In NEWHORIZON, refinement is performed according to a quasi-Lagrangian scheme with approximately constant proper highest resolution of 34 pc. The refinement is triggered in a quasi-Lagrangian manner, if the number of DM particles becomes greater than 8, or the total baryonic mass reaches 8 times the initial DM mass resolution in a cell. Extra levels of refinement are successively added at z = 9, 4, 1.5 and 0.25 (i.e., for expansion factor a = 0.1, 0.2, 0.4 and 0.8, respectively). The simulation is currently completed until the redshift z = 0.18.
2.2. Galaxy catalog
Galaxies are identified using the structure finder ADAPTAHOP (Aubert et al. 2004; Tweed et al. 2009) an improved version of the HOP algorithm (Eisenstein & Hut 1998). This method identifies structures from the particle positions only. It determines first the local density of each stellar particle from the 20 nearest neighbors using the standard SPH (smoothed particle hydrodynamics) spline kernel (Monaghan 1992). Then the algorithm jumps from one particle to its highest density neighbor until it reaches a local maximum. Once all the local maxima of the field are found, a peak patch around each maximum is defined as the set of particles above a specific density threshold. We have used a density threshold equal to 178 times the average matter density at that redshift, a value commonly used in the literature to identify collapsed and virialized objects. Moreover, since NEWHORIZON is a zoom simulation, low mass-resolution dark matter particles might “pollute” some halos, especially when they are located close to the boundary of the high resolution area. We remove those DM halos and their embedded galaxies when the low-mass resolution particles budget is higher than 4% of the total halo mass. In the following, we define the mass of each galaxy by the value returned by ADAPTAHOP.
2.3. Identification of gas-versus-stars counter rotating galaxies
In the present work, we are mainly interested in studying the formation of galaxies in which the gas component is counter-rotating with respect to a co-spatial stellar component. Following Khim et al. (2021), by “gas component” we refer here to the “galactic cold gas” separated from the non-cold surrounding. To do so, we used the linear cut in the logarithmic density-temperature plane using Eq. (1) from Torrey et al. (2012):
![Mathematical equation: $$ \begin{aligned} \mathrm{log} (T/[\mathrm{K}]) = 6 + 0.25\,\mathrm{log} (\rho /10^{10}[\mathrm{M_\odot }\,h^{2}\,\mathrm{kpc}^{-3}]). \end{aligned} $$](/articles/aa/full_html/2025/04/aa53577-24/aa53577-24-eq1.gif) (1)
(1)
Depending on the density, the “galactic cold gas” is mainly characterized by a temperature of about 10 000–30 000 K. It is used for the star formation model in the simulation and has similar properties to the gas component observed in Hα emission lines (≃10 000 K) in IFS such as SAMI.
To identify such objects in the simulation, we have computed the 3D angle (Ψ) subtended between the stellar and gas AM vectors, at different redshifts. These two vectors are calculated by taking all stars (cold gas cells) within one effective radius (Re), estimated by taking the geometric mean of the half-mass radius of the projected stellar densities along each of the simulation’s Cartesian axes. In our selection process, we first identified galaxies satisfying both a stellar mass greater than 109 M⊙ (corresponding to ∼10 000 stellar particles) and Ψ > 120°. Then, we visually inspected both the edge-on projected velocity fields and the distribution of the circularity parameter (see the definition below) relative to the star and gas components. Galaxies displaying complex velocity fields without any clear distinct peaks close to 1 and –1 in the distribution of the circularity parameter of stars and gas respectively were discarded.
For instance, Fig. 1 shows the values of the 3D angle Ψ for galaxies extracted at z = 0.66 and z = 0.18. Among the six galaxies that satisfy the above criteria at z = 0.18, five were ultimately selected (G23, G31, G45, G70 and G83). Interestingly, the same number (and a similar fraction of galaxies) has been derived at z = 0.66. The galaxy G31 is selected in the two samples, suggesting either a long or several gas-star kinetic misalignment phases. Indeed, the galaxy identity is unique across all redshifts so that the same identity means the same galaxy at different redshifts. We repeated this procedure for snapshots regularly spaced in time (every ∼0.5 Gyr) from z = 3 to z = 0.18. At the end, ten low-mass galaxies in the simulation presented a clear gaseous counter-rotating component. In the next section, we study this sample of galaxies whose relevant information is summarized in Table 1.
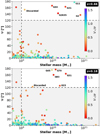 |
Fig. 1. Three-dimensional angles Ψ subtended between the stellar and gas AM vectors, both estimated within one effective radius Re, at z = 0.66 (upper panel) and z = 0.18 (lower panel). Our final sample of gas-versus-stars counter-rotating galaxies consists of galaxies with non-disturbed morphology (or in an ongoing merging phase) with a mass greater than 109 M⊙ and Ψ > 120°. We also used a color coding according to the quantity V*/σ (also estimated within one effective radius). Gas-star kinetic misaligned galaxies are more likely to form in spheroidal-dominated galaxies (associated with low V*/σ values). |
Identity and mass of each galaxy identified at z = 0.18 from the NEWHORIZON simulation and studied in this work.
Another way to identify counter-rotating galaxies is to use the so-called circularity parameter introduced by Abadi et al. (2003). The circularity parameter for each stellar particle (ϵ*) or gas cell (ϵg) is calculated based on the specific AM (Jz) of each particle or cell along the galaxy stellar spin axis divided by the maximum specific AM allowed on a circular orbit with the same specific binding energy E, namely, ϵ ≡ Jz/Jmax(E). In this case, ϵ ranges between –1 and 1. Another definition can be found in the literature in which the specific AM of each stellar particle is divided by the AM corresponding to a circular orbit Jcirc:
 (2)
(2)
where G is the gravitational constant and Mtot is the total mass (DM+gas+stars+BH) within a sphere of radius “r” centered on the galaxy center. In each definition, stellar particles or gas cells with ϵ > 0 (ϵ < 0) are on co-rotating (counter-rotating) orbits with respect to the average rotation axis of the stellar component. The two definitions lead to consistent trends and results, as already pointed out by Cenci et al. (2024). In the following, we use the latter definition as it requires less computational effort. Then, to identify gas-star counter-rotating galaxies, one can select objects in which a large fraction of cold gas cells are in retrograde motion within one effective radius by considering, for instance, the average satisfying ⟨ϵg⟩< − 0.5. We have also checked that this approach leads to the selection of the same sample of galaxies.
We note that there is potentially a third (though indirect) way to identify galaxies with the presence of stars-gas counter-rotating components. As we demonstrate in the next sections, these galaxies also display clear stars-stars counter-rotating components which can be revealed by the presence of a double-peaked in the stellar velocity dispersion maps (e.g., Krajnović et al. 2011; Rubino et al. 2021; Bevacqua et al. 2022; Bao et al. 2024; Katkov et al. 2024). We discuss this aspect in Sect. 4.1.
In Fig. 1, we also used a color coding according to the quantity V*/σ, where V* is the rotation stellar velocity and σ, the stellar velocity dispersion. The ratio V*/σ can be used as a proxy of galaxy morphology (see Peirani et al. 2024, for more information). The two panels of the figure clearly indicate that gas-vs.-stellar counter-rotating galaxies are more likely to be found in more spheroid dominated galaxies (V*/σ < 0.5) which is consistent with observational analysis (Xu et al. 2022).
3. Results
The ten galaxies identified in the last section develop during their lifetime at least one phase of gas-versus-stars counter-rotating disks. As we show in more detail in the next sections, the physical mechanism responsible for such configurations is common for all them. It consists of two successive phases:
(i) The first phase starts with the cosmic accretion of gas from a nearby companion, by tidal stripping, or from the circumgalactic medium. This accretion is always retrograde. An example is displayed in the upper panel of Fig. 2. It shows the projected distribution of gas of an interacting galaxy system at z = 0.46. The central galaxy is G23, with a mass of 1.7 × 10¹⁰ M⊙, and has a counterclockwise rotation, as specified by the dashed circular arrow. The companion galaxy has a mass of 8.8 × 10⁷ M⊙ located at a distance of ∼40 kpc and is moving on an indirect orbit, as suggested by its projected trajectory in the plane. Due to the relative short distance between the two objects and due to the gravitational potential of the central and more massive galaxy, a bridge of gas is created: by tidal stripping, G23 is accreting a fraction of gas of its companion.
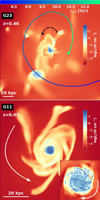 |
Fig. 2. Projected gas density (ρ) around two galaxies from our sample, G23 (upper panel) and G11 (lower panel). These two panels illustrate each of the two successive phases leading to the formation of gas-versus-stars counter-rotating disks. In the upper panel, the central galaxy (G23) has a counterclockwise rotation, as specified by the dashed circular arrow, and is accreting some gas from a companion galaxy through tidal stripping. In this specific case, the orbit of the satellite galaxy is indirect (or retrograde) as illustrated by the orientation of the two arrows. Then, the retrograde accretion of gas may lead afterward to the coexistence of two disks of gas that rotate in opposite sense, as shown in the lower panel by the spectacular case of G11. The accreted gas lies in the outer parts of the galaxy while the pre-existing one is concentrated in the inner parts. The process ends when the latter is totally replaced by the former. |
(ii) Next, the second phase is characterized by the coexistence of two cold gas disks (or two gas components) that rotate in an opposite sense: in the inner part, the pre-existing gas that belongs to the central galaxy, and in the outer part, the accreted gas from the companion. A clear and spectacular example of such a configuration is shown in the lower panel of Fig. 2. In this galaxy, G11, the pre-existing disk is compressed by the surrounding gas and tends to have a higher density. It is displayed in blue color while the accreted material, less dense, appears in orange color. A zoom-in of the central part is displayed is the lower right corner. The orientations of spiral arms clearly indicate that the two disks have opposite AM vectors. We study in detail this galaxy in the next section and show that the pre-existing disk is progressively replaced by the accreted gas leading to the existence of only one disk of gas that finally counter-rotates with the main stellar component.
In the following, we study in details the formation process of gas-versus-stellar kinematic misalignment, by considering four individual cases, G11, G70, G31 and G2635, which present some noticeable differences in their respective formation paths.
3.1. G11: Two successive clear episodes of gas versus gas counter-rotating disks
The galaxy G11 is very interesting because it undergoes two successive retrograde gas accretions during its lifetime. This galaxy has been partially studied in Peirani et al. (2024) and more specifically in the evolution of its central black hole, BH1049 (see their Figs. 7 and 8). The following analysis therefore presents some additional information about the formation path of this system. First, in Fig. 3, we show both the projected u-g-r band images of the stellar component, the projected gas density and the associated 2D velocity fields, at five different epochs, nicknamed &#Xtextcircled;a, &#Xtextcircled;b, &#Xtextcircled;c, &#Xtextcircled;d and &#Xtextcircled;e. It is worth mentioning that the projected velocity fields presented throughout the paper are for qualitative purposes only. They are derived from the intrinsic mass distribution of stars (or gas), but more realistic modeling can be considered by calculating the light distribution produced by the different stellar populations (see, for instance, Nanni et al. 2022; Sarmiento et al. 2023). At epoch &#Xtextcircled;a (z = 1.19), the galaxy is still evolving through a complex formation phase, undergoing minor merger episodes and cosmic gas accretions. The galaxy has a clear stellar disk along with a rather small co-rotating disk of gas (due to a recent minor merger), as suggested by the respective 2D projected velocity fields. Then, at epoch &#Xtextcircled;b (z = 1.0), a retrograde accretion of cosmic gas (most probably from gas stripping from nearby galaxies) has taken place at larger radii and the coexistence of two gas components can be distinguished. The central one is the pre-existing gas disk which is still co-rotating with the stellar component, contrary to the outer gas disk. At epoch &#Xtextcircled;c (z = 0.64), the former has been totally replaced by the latter. At this time, a clear gas-versus-stars counter-rotating disks can be clearly seen from the projected velocity fields. However, a new episode of (indirect) gas accretion (mainly from fly-by galaxies) is already in place, and the scenario is repeating: coexistence of two noticeable gas component rotating in opposite direction in &#Xtextcircled;d, ending with the replacement by the new disk at epoch &#Xtextcircled;e. We note that since this second gas accretion episode starts from a gas-versus-stars counter-rotating disks configuration, the final product is a galaxy in which the main gas and stellar components are now co-rotating.
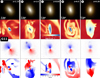 |
Fig. 3. For galaxy G11, projected u-g-r band images of the stellar component (first row), projected gas density (ρ, second row), and the associated projected velocity fields (third and fourth rows) at five different epochs (symbolized by items &#Xtextcircled;a–&#Xtextcircled;e). The values of rotation velocities are indicated by the color bar, the red parts are moving away from us while the blue ones are approaching us. The galaxy undergoes two successive episodes of retrograde gas accretion. At epoch &#Xtextcircled;a, the stars and central gas component are co-rotating. Then the first gas accretion lead to the coexistence of two disks of gas which rotate in opposite direction: the accreted material in the outer parts and the pre-existing one on the inner region (&#Xtextcircled;b). At epoch &#Xtextcircled;c, the new disk of gas has totally replaced the pre-existing one leading to the stellar-gas counter-rotating configuration. However, a new episode of retrograde gas accretion with respect to the inner disk (hence this new gas component is co-rotating with the stars) is already starting. Then epochs &#Xtextcircled;d and &#Xtextcircled;e repeat the same steps namely coexistence of two counter-rotating gas disks ending with a complete replacement. |
To look deeper in the formation process of this galaxy, we show in Fig. 4 the cosmic evolution of some of its relevant properties. In the top panel, we compute Φ(r), the angle between the AM vector of the stellar component (computed by taking all stars within one effective radius), and the AM of all stars located within two concentric spheres of radius r − dr and r + dr. Φ(r) is estimated within 0 < r < 10 kpc using 50 bins (that is, dr = 0.1 kpc). In the second row, we also compute Φ(r) but considering this time all “cold” gas cells located within two concentric spheres of radius r − dr and r + dr. Φ(r) is simply defined by
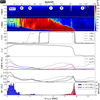 |
Fig. 4. Cosmic evolution of relevant properties relative to G11. From top to bottom: (1) Mass-weighted angle Φ(r) between the AM vector of the stellar component (computed by taking all stars within one effective radius) and the AM vector of all stars located within two concentric spheres of radius r − dr and r + dr. Φ(r) estimated within 0 < r < 10 kpc using 50 bins. The dotted line indicates the time evolution of Re; (2) Φ(r) computed this time with all “cold” gas cells located within two concentric spheres of radius r and r + dr. (3) Evolution of the 3D angle Ψ subtended between the stellar and gas AM vectors estimated within one (solid line), two (dashed line) or five (dotted line) effective radii. (4) Ratio of the stellar rotational velocity to the stellar velocity dispersion V*/σ estimated within one effective radius. (5) Masses of cold gas that co- or counter-rotate with the stellar component, estimated by selecting all (cold) gas cells with positive (blue lines) or negative (red lines) circularity parameters. We also estimate these two quantities within one, two, or five effective radii. (6) Evolution of the (cold) gas fraction, fgas = Mgas/(Mgas + Mstars) also estimated within one, two, or five effective radii. (7) Mass of new stars formed in situ within five effective radii in successive intervals and color coded according to positive (blue lines) and negative (red lines) circularity parameters. We also plot in the same panel, the cosmic star formation rate estimated by identifying all stars born in situ within the last 100 Myr within one, two, or five effective radii. We note that the z-axis of the cylindrical coordinate at any time corresponds to the total AM vector direction of the stellar component estimated within one effective radius. |
 (3)
(3)
where “i” refers either to the stars or the cold gas component. These two plots give a precise idea about the relative orientation of the AM of stars (or gas) at a specific radial distance with respect to the total AM of the galaxy. It is worth mentioning that the z-axis of the cylindrical coordinate at any time corresponds to the total AM vector direction of the stellar component estimated within one effective radius. In the present case, the time evolution of the distribution of Φ(r) for stars is almost always “blue”. This simply means that all layers of the stellar component, up to 10 kpc, are generally co-rotating all together. In the second row, the gas component displays a different behavior. Indeed, in the outer parts, the red color indicates here the existence of accreted gas in counter-rotation with a dominant contribution to the AM budget. The two coexisting disks of gas can be identified until the epoch &#Xtextcircled;c where the “red” has totally replaced the “blue” regions.
The second episode of (indirect) gas accretion, as discussed above, incidentally starts roughly at the same period (if we limit the analysis to 10 kpc). The “blue” component (i.e., co-rotating stellar component) started to dominate in the outer parts and progressively replaced the “red” one (i.e., counter-rotating stellar component) until TUniverse ∼ 10 Gyr. From this time, the first and second rows are characterized by Φ(r) with low values, suggesting that the stellar and gas component are now globally co-rotating at every layers up to a radial distance of 10 kpc.
To date the precise time of the formation of the gas-versus-stars counter-rotating disks, we plot in the third row, the cosmic evolution of 3D angle Ψ subtended between the stellar and gas AM vectors, introduced in Sect. 2.3. This angle is estimated by taking all stars and cold gas cells within one, two and five effective radii. The transition between co-rotating (Ψ close to 0°) and counter-rotating disks (Ψ close to 180°) generally depends on the definition of the radial distance within which the stellar and gas AM are computed. In the present case, if the angular momenta are estimated within 5 effective radii, the transition happens earlier since the retrograde accreted gas tends to have in first place a higher contribution to the AM budget at large radii.
To complete the analysis, in the next rows, we show the evolution of V*/σ which gives information on the morphology evolution of the galaxy. Next, we present the evolution of the mass of the cold gas estimated within one, two and five effective radii. We also separate the mass of gas that co- or counter-rotates with the stellar component, by selecting all (cold) gas cells with positive (blue lines) or negative (red lines) circularity parameters. The evolution of the (cold) gas fraction, fgas = Mgas/(Mgas + Mstars) is also shown. The last row shows the cosmic star formation history by selecting all stars born in situ within the last 100 Myr, within one, two or five effective radii. We also plot in the same panel, the mass of new stars, ΔM* formed within successive intervals, and color coded according to positive (blue lines) and negative (red lines) circularity parameters.
From the last three rows, we note that during the two phases in which the new disk is progressively replacing the pre-existing one, the star formation is quite high especially between TUniverse ∼ 4 and 5 Gyr. The mass of cold gas of the inner disk is also decreasing along with the gas fraction. The same phenomenon is observed during the second episode of gas infall. A question that naturally arises concerns the fate of the inner disks of gas. For instance, the inner gas disks might be mainly removed by the accreted gas component, as suggested by Khoperskov et al. (2021), or might be mainly converted into stars, as advocated by Cenci et al. (2024). Unfortunately, it is rather challenging to give a clear answer here since in the RAMSES code, the motion properties of gas are treated using an Eulerian approach. Therefore, it is rather difficult to follow precisely each portion of gas in time2. However, we can try to provide some clues. Indeed, from the evolution of the mass of cold gas (fifth row), we can estimate the mass of cold gas which has “disappeared” during the process, by estimating the difference between the maximum mass value and the minimum one within five effective radii. The choice of five effective radii is motivated to delimit reasonably the inner disk of gas. Regarding the first accretion phase, in the time interval [4.3–7.8] Gyr, the mass of cold gas decreases from ∼6.3 × 10⁹ M⊙ to 0 M⊙ while the mass of new stars that formed with ϵ* > 0 (within five effective radii) during the same interval is ∼6.21 × 10⁹ M⊙. Regarding the second and late retrograde gas accretion phase, we estimate the same amounts in the time interval TUniverse = [9–10] Gyr. The mass of cold gas decreases from ∼4.02 × 10⁹ to 0 M⊙ while the mass of new stars that formed with ϵ* > 0 during the same interval is ∼3.03 × 10⁹ M⊙. These estimations suggest that the cold gas has been almost fully converted into stars during the first accretion phase while the percentage drops to 75.4% during the second phase.
Also, to facilitate the comparison with observational analysis, we show in Fig. 5 the edge-on projected stellar and gas velocity fields within 10 kpc, at epoch &#Xtextcircled;b, &#Xtextcircled;c and &#Xtextcircled;d. G11 is particularly interesting, as during its lifetime, it displays three different gas-star misalignment configurations. Indeed, the stellar component is counter-rotating with the outer gas disk in &#Xtextcircled;b, while it is counter-rotating with the inner gas disk in &#Xtextcircled;d. Between these two epochs, it reaches a gas-versus-stars counter-rotating disks configuration, if we limit our analysis to r ≤ 10 kpc. We note that the use of term counter-rotating gas disks might not be totally suitable here. Indeed, the two disks are not necessarily rigorously coplanar. For instance, from Fig. 5 it can be seen that the two gas components have a clear misalignment angle of Δ PA ∼ 198° at epochs &#Xtextcircled;d.
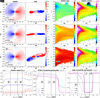 |
Fig. 5. Projected edge-on mass-weighted velocity fields (first and second columns) and associated mass-weighted stellar circularity parameter (ϵ*)-radial distance-stellar age diagram (third column) and ϵ*-radial distance-stellar metallicity diagram (fourth column) for galaxy G11 at epochs &#Xtextcircled;b, &#Xtextcircled;c, and &#Xtextcircled;d. Again, the values of rotation velocities are indicated by the color bar: The red parts are moving away from the viewer, while the blue ones are approaching. The dotted circles and dotted lines indicate values of the effective radius. The dashed lines represent ϵ* = 0. Each diagram is sampled using a regular grid of 80 × 80 pixels. Only pixels with at least five stellar particles are taken into account. This galaxy displays three different gas-stars misalignment configurations in its lifetime: At epoch &#Xtextcircled;b, the outer parts of the gas disk are counter-rotating with the stellar component, whereas at epoch &#Xtextcircled;d, it is the inner part of the gas disk that is in counter-rotation. Meanwhile at epoch &#Xtextcircled;c, a clear gas-versus-stars counter-rotating disks is obtained (within 10 kpc, i.e., ∼8 Re). We also note that in &#Xtextcircled;d, the two disks of stars are not entirely co-planar but have a misaligned angle of a ΔPA ∼ 198°. To facilitate the comparison with the trends presented in the previous figure, we plot in the last row the time evolution of the total stellar mass for stars satisfying either ϵ* > 0 or ϵ* < 0 (left panel) along with the evolution of the mean circularity parameters for stars (middle) and gas (right). All quantities are estimated within one (solid line), two (dashed line), or five (dotted line) effective radii. |
On the contrary, the edge-on projected stellar velocity fields look very similar at every epoch, and are dominated by the co-rotating component. Indeed, as shown in the left panel of the last row of the figure, the total mass of stars owing positive circularity parameters are significantly higher than the total mass of stars with negative ϵ* values (and irrespectively to the choice of the radius within which the calculation is done). We note that the two noticeable increases of the stellar mass before TUniverse ∼ 4.7 Gyr (blue lines) and before TUniverse ∼ 9.8 Gyr (red lines) are the consequence of the enhanced star formation during the compaction and removal of the inner gas component. In the middle panel, the time evolutions of the mean stellar circularity parameter, estimated within one, two and five Re, are shown. They follow the same trends as the evolution of V∗/σ seen in Fig. 4. An interesting aspect is that the first phase of retrograde gas accretion lasts over several Gyr. Consequently, the evolution of ⟨ϵ*⟩ first increases and then slowly decreases. However, the second phase of retrograde accretion that leads to the removal of the inner gas (here with ϵg < 0) at TUniverse ∼ 9.8 Gyr, is much more rapid leading to a sudden decrease of ⟨ϵ*⟩. Although this case is quite atypical, the results are in good agreement with the two phases of the kinematic misalignment described in Cenci et al. (2024): (1) a first phase of gas compaction with an increase of both the star formation rate and ⟨ϵ*⟩; (2) a second phase in which both ⟨ϵ*⟩ and ⟨ϵg⟩ decrease (TUniverse ∼ > 5 Gyr). We observed that these trends are also found for the other galaxies (e.g., G70 and G31). Finally, we note that the evolution of the mean circularity parameters for the gas is strongly correlated with the evolution of Ψ.
Moreover, for each epoch displayed in Fig. 5, we also show at the respective redshift, the distribution of the circularity parameter of stars (ϵ*) with respect to the radial distance, and color coded according to the stellar age (third column) or the global metallicity (fourth column). In the following, we refer to these two plots as ϵ∗-r-age and ϵ∗-r-metal diagrams respectively.
At epoch &#Xtextcircled;b, the inner and pre-existing gas is progressively replaced by the accreted one. The fact that the inner disk of gas is compacted during this process should normally induce some star formation activity owing to positive circularity parameters. In the present case, some clear star formation does happen before TUniverse ∼ 5 Gyr and therefore prior to epochs &#Xtextcircled;a and &#Xtextcircled;b, while the star formation activity is quite low afterward, probably due to AGN activity. Some discussions about the effect of BH activity and AGN feedback in this system are presented in Sect. 4.4. The low star formation at these epochs could also be attributed to the low content of the cold gas as suggested by rows 5 and 6 in Fig. 4. The young stars are mainly located at small radii with positive circularity parameters. On the contrary, at epoch &#Xtextcircled;d, the central disk of gas is counter-rotating with respect to the stellar component. In this case, the new stars form with negative circular parameters with a high contribution at radii 2 kpc < r< 4 kpc i.e. close to the interface of the two disks (see Fig. 5).
We note that the three respective ϵ∗-r-metal diagrams look quite similar. At epoch &#Xtextcircled;b the diagram is typical for a disk galaxy with a strong rotational support. Indeed, the younger stars form with a high circularity parameter (ϵ* > 0.5) and a rather high metallicity, log(Z/Z⊙) > 0. Moreover, the stars that belong to the spheroidal component of the galaxy, characterized by ϵ* close to 0, tend to be older with a much lower metalicity. At epoch &#Xtextcircled;d, the new stars form with a negative circularity parameter (ϵ* < 0.5) and are characterized by a lower metallicity log(Z/Z⊙) ∼ –0.7.
To understand the differences in the distribution of the stellar metallicity, especially for the younger stars in epochs &#Xtextcircled;b and &#Xtextcircled;d, we plot in Fig. 6 the ϵg-r-metal diagrams relative to the (cold) gas component, at epochs &#Xtextcircled;b, &#Xtextcircled;c, &#Xtextcircled;d, &#Xtextcircled;e. First, at epoch &#Xtextcircled;b, the pre-existing disk of gas is located at small distance r < 3 kpc and is characterized by a positive circularity parameter (ϵg > 0) and a high metallicity. On the contrary, the cosmic accreted gas is characterized by a lower metallicity (i.e., log(Z/Z⊙) ∼ –0.7) and ϵg < 0. We can also notice that at r ∼ 1–2 kpc, there is some gas mixing at the interface of the two disks. At epoch &#Xtextcircled;c, the accreted gas has almost completely replaced the pre-existing one. Due to low star formation activity and therefore to subsequent low supernovae activity, the new disk of gas tends to keep its original metallicity. At epoch &#Xtextcircled;d, the same phenomenon is repeating. At this time, the cosmic accreted gas is also characterized by a rather low metallicity (log(Z/Z⊙) < –1). We also observe here some gas mixing between the two gas components. Then at &#Xtextcircled;e, the new gas disk has totally replaced the older one, but since the star formation is slightly more pronounced in the interval 9 Gyr < TUniverse < 10 Gyr, the new gas disk has a metallicity which tends to increase from smaller to larger radii.
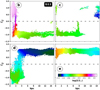 |
Fig. 6. Gas circularity parameter-radial distance-stellar metallicity diagrams at four different times. At epoch &#Xtextcircled;b, the pre-existing disk (ϵ* > 0) has a high metallicity (log(Z/Z⊙) > 0) compared to the accreted gas (log(Z/Z⊙) ∼ –0.7). We note that at r ∼ 1 kpc, there is some gas mixing at the interface of the two disks. At epoch &#Xtextcircled;c, the accreted gas has totally replaced the pre-existing one. Due to the lack of star formation and therefore to a subsequent low supernovae activity, the new disk tend to keep its original metallicity. In epoch &#Xtextcircled;d, the same phenomenon repeats: coexistence of two disks. The accreted gas is characterized here by a very low metalliciy (log(Z/Z⊙) < − 1). Then in epoch &#Xtextcircled;e, the new disk has totally replaced the older one, but due to a star formation activity slightly more pronounced during the gas accretion, the new gas disk has a metallicity that gradually increases from smaller to larger radii. |
Additional information can also be extracted from Fig. 7 where we plot for z = 0.64 (epoch &#Xtextcircled;d), the 3D radial distributions of the mass, age and metallicity of stars with circularity parameters satisfying either ϵ* > 0.5 (blue lines) or ϵ* < −0.5 (red lines) to identify co- and counter-rotating disks. In this galaxy, co and counter-rotating stars tend to have similar ages with respect to the radial distance. The “V-shape” seen in the distribution of the stellar age of counter-rotating stars within 5 kpc is due to recent star formation induced at the interface of the two disks. The counter-rotating stars are also less metal rich compared to co-rotating stars within 10 kpc. This is most probably a consequence of the low star formation activity prior epoch &#Xtextcircled;c. Also, counter-rotating stars tend to be slightly older but slightly more metal rich in the inner parts than in the outer parts. Since the star formation rate is very low after the replacement of the pre-existing gas, the mass of co-rotating stars (ϵ* > 0.5) is 16 times larger than counter-rotating stars (ϵ* < −0.5) within 5 Re.
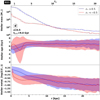 |
Fig. 7. Three-dimensional radial distributions of the mass (upper panel), age (middle panel), and metallicity (lower panel) of stars with circularity parameters satisfying ϵ* > 0.5 (blue lines) ϵ* < −0.5 (red lines) for G11 at z = 0.5 (epoch &#Xtextcircled;d). We also plot at the top the corresponding scale with respect to the effective radius. Shaded areas indicate the dispersion. Epoch &#Xtextcircled;d happens 1.2 Gyr after the total removal of the pre-existing disk at &#Xtextcircled;c. During this time, the star formation is very low, and the new stars mainly formed at the interface of the inner disk and the new accreted one. This explains the “V-shape” seen in the distribution of the stellar age of counter-rotating stars within 5 kpc. |
Finally, it is interesting to make the link with observations and analysis of the presence of two disks of gas in two galaxies presented in Cao et al. (2022) from the MaNGA survey. Such observations support the scenario of multiple gas acquisition events which is also the case for G11. However, it is even more remarkable in their case as each disk of gas presents a misalignment angle of ∼40° with respect to the stellar component compared to a single one in G11 (e.g., at epoch &#Xtextcircled;d).
3.2. G70: A potential typical gas versus star counter-rotating galaxy formed from a minor merger event
We present now the formation of G70 which has undergone a minor merger with a mass ratio of 1:70 at late time. Similarly to G11, we show the cosmic evolution of some relevant properties in Fig. A.1. However, in the fourth row we have added the evolution of the separation distance between the main galaxy, G70, and its satellite. This plot is quite typical in theoretical interacting galaxies studies as it shows clearly the different passages at pericentric distances as well as the accurate time of the final plunge, estimated in the present case at TUniverse ∼ 10.6 Gyr (z ∼ 0.27).
The evolutions seen in Fig. A.1 are quite similar to those obtained from G11. In particular, in the second row, the accreted gas from tidal stripping is clearly seen, starting from the outer parts (TUniverse ∼ 7.5 Gyr) and progressively reaching the inner parts. Thus, the presence of two misaligned gas components can be identified in the time interval 7.5 < TUniverse < 9.2 Gyr. We note that, in the present case, the accretion of gas is done preferentially through an angle of ∼110°.
The gas-versus-stars counter-rotating disks configuration occurs at TUniverse ∼ 9.1 Gyr. One interesting point is that the replacement of the pre-existing disk by the new one is complete while the satellite is still orbiting around the main galaxy.
Also, as seen for G11, the cold gas mass with a positive circularity parameter is progressively decreasing prior to the final gas-star counter-rotating disks configuration. The gas fraction follows the same trend while the replacement of the pre-existing gas is accompanied with an induced star formation (blue histograms). Here also, we can estimate the ratio between the mass of cold gas (with positive ϵg) that disappeared between 7.7 and 9.4 Gyr and the mass of new stars (with positive ϵ*) formed in the same interval, both quantities estimated within five effective radii. We find that 61.4% of the cold gas has been converted into stars. Moreover, the evolution of the V∗/σ ratio starts to decrease when the accreted gas reaches the effective radius (at TUniverse ∼ 9 Gyr). This is quite expected since the quantity V∗/σ is estimated within one effective radius, and the notable formation of counter-rotating stars starting at this time can compensate for the AM of co-rotating stars, also reducing V∗/σ. At z = 0.18, V∗/σ ∼ 0.2, which means that the galaxy has lost some AM during the process and is more likely to turn to an S0 galaxy. A visual inspection of the u-g-r bands images (not shown in this paper) suggests indeed a spheroidal galaxy without any clear spiral arms.
In Fig. A.2 we show the 2D projected stellar and gas velocity fields at three specific times: during the gas stripping phase (z = 0.52, &#Xtextcircled;f), close to the final plunge (z = 0.33, &#Xtextcircled;g) and at z = 0.18 or 2.3 Gyr after the gas-versus-stars counter-rotating disks formation (&#Xtextcircled;h). At epoch &#Xtextcircled;f, the inner part of the gas disk is perturbed by the cosmic accretion of gas whereas the stellar velocity still displays a typical distribution. Unlike G11, the coexistence of two clear gas disks is less obvious. Also, as expected, the total mass of stars with ϵ* > 0 is increasing before TUniverse ∼ 9.2 Gyr due to compression of the pre-existing gas with subsequent star formation enhancement. The trends again agree well with two phases of kinematic misalignment proposed by Cenci et al. (2024). We indeed first observe an increase of the star formation rate accompanied by an increase of ⟨ϵ*⟩ (while ⟨ϵg⟩ decreases). The second phase is then characterized by a decrease of both ⟨ϵ*⟩ and ⟨ϵg⟩.
Here also, the ϵ∗-r-age diagram is typical of a galaxy with a strong rotational support (V*/σ = 0.65): the young stars have been produced at small radial distances with a high metallicity while stars that belong to the spheroidal component (e.g., ϵ* close to 0 with high radial distances) tend to be older with a lower metallicity.
At epoch &#Xtextcircled;g, the satellite galaxy can be identified at a radial distance around 22 kpc from the center of G70 in the ϵ∗-r-age diagram. Since the orbit of the satellite is indirect in the reference frame of G70, its stars have negative circularity parameters. The satellite is also characterized by a young population of stars with globally a lower metallicity, log(Z/Z⊙) ∼ –0.8, than its host. This is consistent with Dubois et al. (2021) who found that massive galaxies tends to be more metal rich than lower mass galaxies in NEWHORIZON (see their Figs. 13 and 14). This is also in agreement with observational trends (Gallazzi et al. 2014). Since the kinetic misaligned star-gas configuration is already in place at this time, the gas is by definition counter-rotating with respect to the stellar component. Therefore, the new stars inherit the dynamical properties of their parent gas, and, in particular, they form with negative circularity parameters ϵ*. This is what we observed precisely in the ϵ∗-r-age diagram at small radii (i.e., r < 4 kpc). Based on the ϵ∗-r-metal diagram, these young stars formed with a high metallicity (purple color or log(Z/Z⊙) > –0.1). This result might be a bit non-intuitive since the gas in the satellite has a lower metallicity (green color or log(Z/Z⊙) ∼ –0.85) and this gas is accreted by the main galaxy to form these new stars. One would naively expect that the new stars forming at r < 4 kpc should have a metallicity close to log(Z/Z⊙) ∼ –0.85. To understand this, we have plotted in the next figure, Fig. 8, the same diagram but for the gas component i.e. the distribution of the gas circularity parameter ϵg with respect to the radial distance r and using a color coding according to the global gas metallicity, at z = 0.33 (&#Xtextcircled;g). First, we indeed find that the gas in the satellite has a metallicity of log(Z/Z⊙ ∼ –0.85) (green) which is consistent with the metallicity of young stars displayed in Fig. A.2 at the same location in the diagram (second line, fourth column). Then, some of the gas of the satellite is accreted by G70 (tidal stripping) and is progressively enriched in metal as the radial distance decreases. This can be explained by the supernovae activity which tends to be more pronounced at small radii (where most of the younger stars form). Consequently, the accreted gas reaches the galactic plane with a much higher metallicity and then form stars that inherit the same high metallicity, consistent with the trend found in Fig. A.2 at the same epoch.
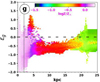 |
Fig. 8. Variations of the gas circularity parameter ϵg with respect to the radial distance r and color coded according to the global gas metallicity at z = 0.33 (&#Xtextcircled;g). The gas in the satellite has a metallicy of log(Z/Z⊙) ∼ –0.85 (green) which is consistent with the metalicity of young stars displayed in Fig. A.2 (second line – fourth column). Then some of the gas of the satellite is accreted by G70 and is progressively enriched in metal as the radial distance decreases due to supernovae activity dominated by young stars in the central part. Consequently, the accreted gas reaches the galactic plane with a much higher metallicy and then forms stars that inherit the same high metallicity, consistent with trends found in Fig. A.2 at the same epoch. |
Then back to Fig. A.2, the epoch &#Xtextcircled;h displays different interesting trends well after the formation of the gas-versus-stellar counter-rotating galaxy. First, such a configuration can remain stable for several Gyrs. In this case, the in situ star formation induced by the counter-rotating gas disk is still clearly visible and extends almost up to r ∼ 7.5 kpc. The metallicity of these young stars is again generally quite high (purple color or log(Z/Z⊙) > –0.1). Stars located at larger radii (r > 7.5 kpc) with ϵ* < 0, are also young. But they did not form in situ: they have been formed in the satellite and are displayed in the outer parts due to the conservation of the orbital AM. One efficient way to disentangle between these two populations of stars is to look at their metallicity. Indeed, stars with ϵ* < 0 in the outer parts are characterized by a lower metalicity (green color) that clearly reveals their origin.
Finally, in Fig. A.3, we plot for z = 0.18 (or epoch &#Xtextcircled;h), the 3D radial distributions of the mass, age and metallicity of stars with circularity parameters satisfying either ϵ* > 0.5 or ϵ* < –0.5. The trends are different from G11. Since there is a pronounced star formation activity which takes place after the replacement of the pre-existing gas (TUniverse > 9.2 Gyr), the mass of co-rotating stars (ϵ* > 0.5) is here “only” 2 times larger than counter-rotating stars (ϵ* < −0.5) within 5 Re. In this case, counter-rotating stars tend to be younger and slightly more metal rich than co-rotating stars in the inner parts. They also tend to be younger and more metal rich in the inner parts than in the outer parts.
Very similar results and trends are obtained for galaxies G23 and G45 (see Appendix B). The only difference is that, in the case of G23 and G45, the final plunge of their respective satellite does not happen before the end of the simulation.
3.3. G31: A potential typical gas versus stars counter-rotating galaxy formed from a major merger event
In our sample, at least two galaxies, G31 and G83, have experienced a major merger in their formation history (we define the limit of the mass ratio as 1:4) leading to the formation of a gas-star decoupled component. In this section we only focus on G31 since the two galaxies present clear similarities in their formation. But all the results and trends obtained for G83 can be found in the appendix. It is worth mentioning that G31 has also been partially studied in Peirani et al. (2024) in which the formation and evolution of its central black hole, BH549, has been studied in detail (see their Figs. 9 and A.1).
G31 is merging with another galaxy of similar mass. Before the final plunge, estimated at TUniverse ∼ 7.2 Gyr, the mass ratio of the system is 1:1.2 at TUniverse = 4.5 Gyr. In Fig. A.4, we plot the evolution of relevant physical properties relative to G31, similarly to Fig. A.1. Again, some similarities with the previously studied galaxies can be seen. In particular, the accretion of gas by tidal stripping is here again accompanied with a decrease of both the mass of the cold gas (with positive circularity parameters) and the fraction of the gas. In parallel, the star formation activity is enhanced during this phase which ends at the final plunge. However, some differences with trends obtained from galaxies that have undergone minor mergers can be also noticed. First, the tidal stripping of the gas starts to be efficient only when the satellite galaxy is passing close to the pericentric distance (∼30 kpc) at TUniverse ∼ 5.9 Gyr. Consequently, the formation of a counter-rotating gas disk seems to happen more closely to the final plunge (this is more visible in the case of G83). Second, after the final plunge, from the first row of Fig. A.4, the outer parts of the galaxy (r ≿ 5 kpc) are dominated by stars that are counter-rotating. This is due to the conservation of orbital AM during the merger: a large amount of stars from the satellite is expelled and diffused in the outer parts after the merger process. From this time, the top panel of Fig. A.4 indicates the existence of three distinct stellar disks/components which dominate the AM budget at three different regions:
(i) at very small radii (r < 0.5 kpc): a population of young stars that have formed in situ from the accreted gas and counter-rotate with respect to the main stellar component;
(ii) 0.5 < r < 5 kpc: a population of stars originated from the host galaxy, G31, that co-rotate with respect to the main stellar component;
(iii) r > 5 kpc: a population of stars that previously belonged to the satellite galaxy and are now located at larger radii after the merger episode, and counter-rotate with respect to the main stellar component.
The existence of these three populations of stars can be potentially distinguished from the projected edge-on velocity fields presented in Fig. A.5. Another consequence of these lies in the ϵ∗-r-metal diagram. Indeed, at epoch &#Xtextcircled;i before the final plunge, the satellite consists of young stars with a metallicity of log(Z/Z⊙) ∼ –0.25 (red/purple). Then, after each passage at the pericentric distance, the tidal disruption process produces the formation of stellar streams that are clearly visible in the diagrams at epochs &#Xtextcircled;j and &#Xtextcircled;k (see also the trend for G83 in the appendix). Since a larger amount of stars is more likely to be expelled in major merger scenario, these stellar streams with specific age and metallicity might be more easily seen and detected in observational studies.
In fact, at all radii, two populations of stars most of the time coexist with opposite rotation. This is illustrated in the upper panel of Fig. A.6, where the 3D radial distributions of the mass of stars with circularity parameters satisfying either ϵ* > 0.5 or ϵ* < –0.5 are shown at z = 0.34 (or epoch &#Xtextcircled;k). For instance, counter-rotating stars have a higher mass fraction in the very inner parts (r < 1 kpc) and for r > 4.8 kpc with respect to co-rotating stars. Also, interestingly, as the merger process displays a large fraction of stars of the satellite in the outer parts of the remain object, we find that the stellar age and metallicity tend to have constant mean values (for r ≿ 5 kpc), 6 Gyr and log(Z/Z⊙) ∼ –0.25 respectively for G11. Similar trends are obtained for G83.
To finish, we can also take a look at the possible fate of the cold gas that was present in G31 before the merger. If we consider the interval [3.6–6.2] Gyr, we estimate that 86.6% of the mass of cold gas with positive ϵg within 5 Re has been converted into news stars. A similar investigation for G83 leads to a fraction of 45.9%. Also, the time evolution of V∗/σ indicate that after the final plunge, the system evolves toward a spheroidal dominate galaxy, consistent in major merger scenario.
3.4. G2835: An example of angular momentum orientation reversal
The last galaxy studied in detail is G2835. This galaxy has already been introduced in Park et al. (2019, see, for instance, their Figs. 10 and 11). Before the formation of the gas-versus-stars counter-rotating galaxies, G2835 has experienced several minor mergers and one major merger (1:4 at z = 1.56).
Its formation pathway presents similar aspects to the previous cases studied in the last section. According to the evolution of Ψ in the third row presented in Fig. A.7, the gas-versus-stars counter-rotating disks formation happens at TUniverse ∼ 5 Gyr (z ∼ 1.28), which is again preceded by decrease of the mass of cold gas (with ϵg > 0) along with the gas fraction. The star formation rate is also more pronounced during this period.
Afterward, this galaxy presents an interesting feature in its evolution just before TUniverse ∼ 8 Gyr (z ∼ 0.6). Indeed, the orientation of the AM of the stellar component estimated within one effective radius flips. As noted by Park et al. (2019), this is caused by to two main factors. First, the AM of the system is small, suggested by the low values of V∗/σ. Second, during the period of 5 Gyr < TUniverse < 8 Gyr (1.27 > z > 0.6), a large amount of stars form in situ with negative circularity parameters, inherited from the cosmic gas accretion from several satellite galaxies. Since they form in a disk, this population of young stars progressively induces an AM whose contribution to the total stellar AM (within Re) becomes at some point (TUniverse ∼ 8 Gyr) high enough to produce the AM flipping. The transition is seen, for instance, in the two first rows of Fig. A.7 where the blue color regions suddenly replaced the red ones. As we present in the next figure, the new stars form in the whole disk up to r ∼ 15 kpc. The latter tends to dominate first the AM budget at large radii (high ϕ(r) values i.e. red colors in the first row of Fig. A.7) and then progressively dominates the lower layers.
One consequence of this can be observed in the edge-on projected velocity fields presented in Fig. A.8. At epoch &#Xtextcircled;m, the gas-versus-stars counter-rotating galaxies is clearly present within 5 kpc (i.e., two effective radii). At epoch &#Xtextcircled;n, however, the newly formed stars, tend to have a higher contribution at larger radii (r > 2.5 kpc) which leads to the presence of two stellar component rotating in opposite direction. As mentioned above, the new stars are located up to 15 kpc with a high metallicity. We note that the ϵ∗-r-age diagram at epoch &#Xtextcircled;n is quite similar to the ones generated and studied in Khoperskov et al. (2021).
Now we explore the 3D radial distributions of the mass, age and metallicity of stars with circularity parameters satisfying either ϵ* > 0.5 or ϵ* < –0.5, in Fig. A.9, at z = 0.78 (epoch &#Xtextcircled;n). Here the counter-rotating stars tend to be much younger and slightly more metal rich than co-rotating stars, due to the recent and high star formation activity. The counter-rotating stars also dominate the mass budget at large radius. Contrary to G31, this is not due to a merger process but due to the long star formation activity.
Finally, it is worth mentioning that after the flip of the AM, the V∗/σ is progressively increasing, suggesting an evolution toward a more disk dominated galaxy. Moreover, G2835 is also experiencing a new episode of gas-versus-stars counter-rotating galaxies formation at late time (TUniverse > 9 Gyr).
4. Discussion
4.1. Stellar populations
The formation process of gas-versus-stars counter-rotating galaxies has significant impacts on stellar populations. First, during the compression of the pre-existing disk, stars usually form with positive ϵ* in the main disk. Then, once it has been totally replaced by the accreted gas, some new stars may also form but, this time, with negative ϵ*. According to this scenario, one should expect the presence of two co-spatial populations of young stars in the disk with opposite rotation. counter-rotating stars are expected to be on average younger than co-rotating stars. This is what we generally observe for our galaxy sample. However, the opposite trend can also be obtained, for instance in G11 and G2. In these two objects, the main disk tends to have a slightly younger stellar population (measured here within 5 kpc) than the counter-rotating one. In both cases, the star formation is very low after the removal of the pre-existing gas disk. This lack of star formation coincides with recent high BH activities induced by the compression of the pre-existing disk causing it to fall in the center of the galaxy (see Sect. 4.4). The low star formation in these two objects could also be attributed to the low content of the cold gas along with a low gas fraction.
The young and co-rotating stars generally have a high metallicity. Regarding the young and counter-rotating stars, they form from the accreted gas and inherit its metallicity. Although the parent gas can have a low metallicity before being accreted to the main galaxy, it can be progressively enriched by supernovae activity when getting closer to the center. In this case, it might be difficult to distinguish co- and counter-rotating stars from the analysis of their metallicity alone. This is what we get for most of the galaxies in our sample, except again for G11 and G2. Here, one fundamental parameter is the cold gas fraction fgas. In these two latter galaxies, fgas is quite low, with values lower than 0.2 while the other galaxies of the sample present values higher than 0.4 before the removal of the pre-existing gas disk. Low values of fgas may suggest that the reservoir of gas for the formation of new stars is low, which will affect the supernovae activity afterward. We cannot totally exclude the role of mixing between pre-existing gas and the newly accreted one. Indeed, for galaxies with a high mass content of cold gas, metal-poor accreted gas would interact with the metal-rich pre-existing gas and the dilution of metallicity leads to the higher metallicity in accreted gas without significantly reducing the metallicity of pre-existing gas due to its higher mass. On the contrary, for gas-poor galaxies (possibly lacking star formation), the mixing would not come into play, simply because galaxies do not possess much gas.
Our results are in good agreement with observational analysis from MaNGA galaxies that found younger stellar populations, enhanced star formation rates and higher metallicity in central region of misaligned galaxies compared to their outer parts (Jin et al. 2016; Chen et al. 2016).
Also, during a minor or major merger, the stars of the satellite can be expelled in the outer parts of the final object. This can produce some stellar streams with clear age-metallicity signatures. This is more pronounced in major merger scenario where each satellites’s pericentric passage induces successive stellar streams.
From a dynamical point of view, the presence of two stellar components with opposite rotation may lead to the so-called double-peaked feature seen in the observational stellar velocity dispersion maps (e.g., Krajnović et al. 2011; Rubino et al. 2021; Bevacqua et al. 2022; Bao et al. 2024; Katkov et al. 2024). We show examples of such maps derived for G11, G70, G31 and G45 in Fig. 9, confirming the presence of a double peak at epochs of clear stars-gas counter-rotating configurations. This feature is therefore a simple and efficient diagnostic to detect the presence of the counter-rotating stellar components, which are, on the contrary, not seen in the respective projected stellar velocity fields of, for example, G11, G70, and G45.
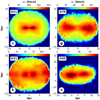 |
Fig. 9. Projected edge-on mass-weighted stellar velocity dispersion fields (σ*) for G11, G70, G31, and G45. Each map has been derived at a specific epoch in which the galaxy is displaying a clear stars-gas counter-rotating configuration. For G11, G70, and G45, the presence of the counter-rotating stellar component cannot be seen in their projected stellar velocity fields but may be suggested by the presence of the double-peak feature exhibited in these maps. |
4.2. Disappearance of the pre-existing disks: Star formation or gas removal
The fate of the pre-existing gas has been studied in past theoretical works. Khoperskov et al. (2021), using toy models, suggest that the gas is mainly removed while Cenci et al. (2024) identified central starburst-driven depletion as the main reason for the removal of the pre-existing co-rotating gas component, with no need for feedback from, for example, a central active black hole. Our study does not allow us to answer to this question precisely. The gas in the RAMSES code relies on an Eularian approach which makes it difficult to follow the motion of the gas accurately, contrary to a Lagrangian approach such as a smoothed-particle hydrodynamics model (SPH). However, we have made a rough estimation of the conversion of the cold gas into stars, by estimating the amount of cold gas with positive circularity parameter that disappears during the process, compared to the newly formed stars with positive ϵ* during the same period. This quantity has been estimated within five effective radii. Figure 10 shows the estimation of the percentage of cold gas converted into stars during the retrograde accretion phase of all galaxies. We note that for G11, we estimate this quantity during the first (G111) and second (G112) retrograde accretions, while G30 undergoes two episodes of counter-rotating formation, noted here as G301 and G302. The plot suggests that during the process, a higher fraction of gas is generally converted into stars rather than being expelled. We also took an interest in any potential dependencies of the estimated fraction of gas being converted into stars with, for example, the stellar mass, the gas fraction, the galaxy morphology, or Re. In Fig. 10, for instance, we additionally show the variations with respect to the mass of the main galaxies (upper panel), the gas fraction fgas (middle panel) and the quantity V∗/σ. These latter quantities have been estimated just before the retrograde gas accretion phase where the mass of the cold gas (with ϵg > 0) reaches a maximum value. fgas and V∗/σ have been estimated within one effective radius but the same trends are obtained when estimated within five Re. Only one clear correlation appears between the percentage of cold gas converted into stars and V∗/σ. This suggests that the initial morphology of galaxies, especially disk-dominated galaxies with a strong rotational support favor the conversion of gas into stars during the retrograde gas accretion phase, rather than more spheroid dominated galaxies.
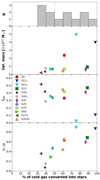 |
Fig. 10. Estimation of the percentage of cold gas with ϵg > 0 converted into stars during the replacement of the inner gas disk, which preceded the formation of the gas-versus-stars counter-rotating disks, for all the studied galaxies. We also show the variations with respect to the stellar mass of the main galaxies (upper panel), the gas fraction fgas (middle panel) and V∗/σ, all quantities estimated just before the retrograde gas accretion phase. fgas and V∗/σ have been estimated both within one effective radius but the same trends are obtained when estimated within 5 Re. These plots first suggest that, during the removal of the pre-existing gas, on average, a higher fraction of cold gas is converted into stars rather than being expelled. Secondly, there is a clear correlation between the percentage of gas converted into stars and V∗/σ. The original morphology of galaxies therefore seems to impact the efficiency of the star formation during the compaction of the central gas component. |
4.3. Galaxy morphology evolution
The mechanism responsible for the formation of gas-versus-stars counter-rotating galaxies implies the loss of AM of the pre-existing gas which reverberates on the AM of the stellar component. This can be clearly seen in the time evolution of V∗/σ for each galaxy. V∗/σ tends indeed to decrease during the formation of counter-rotating gas component and leads to the formation of spheroid-dominated galaxies. Once the gas-versus-stars counter-rotating galaxies has formed, as suggested by a visual inspection of the projected u-g-r band images of the stellar component of these galaxies, they are more likely S0 galaxy. In a companion paper, Han et al. (2024) have also analysed NEWHORIZON galaxies to study two potential formation pathways of lenticular galaxies (S0s) in field environments. Among them, counter-rotating gas inflow is a promising channel as it causes gas AM cancellation through hydrodynamic collisions. This is in agreement with Zhou et al. (2024) who have studied MaNGA galaxies and found misaligned gas accretion to be an important formation pathway for S0s. Beom et al. (2024) also found from MaNGA galaxies that the majority of counter-rotators are early-types. Finally, Katkov et al. (2014) studied a sample of completely 12 isolated S0 galaxies by means of long-slit spectroscopy at the Russian 6-m telescope. They found that 5 galaxies show a visible counter-rotation of the ionized-gas component with respect to the stellar component.
4.4. Black hole activity
During the first phase of the formation of a gaseous counter-rotating component, the pre-existing gas is compressed by the accreted gas. This may have some consequences on the BH feeding and activity. Among the ten galaxies studied in our sample, three of them, G2, G11, and G31, have a massive black hole well centered, while in the other ones, the BHs are off-centered (as a result of intense stellar feedback creating shallow potential wells; e.g., Dubois et al. 2015; Bellovary et al. 2019; Pfister et al. 2019), and are not relevant for the present analysis.
First, BH1049 is associated with G11 and its properties are summarized in Fig. 8 in Peirani et al. (2024). In particular, between TUniverse ∼ 4.5 Gyr and TUniverse ∼ 7.8 Gyr, namely during the first retrograde gas accretion phase undergone by G11, the radiative efficiency of the gas accretion disk, ϵr, is very high, which means that the BH accretes gas efficiently. The spin parameter is also close to its maximum value (0.998) and the Eddington ratio χ indicates that the black hole is most of the time in the quasar mode. During the second retrograde gas accretion phase, between TUniverse ∼ 7.8 Gyr and TUniverse ∼ 10 Gyr, the story is different. Here ϵr is low down to TUniverse ∼ 9.4 Gyr. The reason is that after the first phase of retrograde gas accretion, the orientation of the BH spin has flipped following the orientation of the accreted gas (Peirani et al. 2024). Consequently, between TUniverse ∼ 7.8 Gyr and TUniverse ∼ 9.4 Gyr, the BH spin and the accreted gas are misaligned (see the evolution of Ψgas,BH) which decreases ϵr. But once the BH spin orientation flips again to follow the orientation of the accreted gas, we can observe the same behavior as in the first accretion phase: ϵr and the BH spin parameter become high which suggests that the gas accretion onto the BH is now very efficient. Here again the BH is mostly in the quasar mode.
As far as G31 is concerned, its central black hole, BH549 is studied in Fig. A.1 in Peirani et al. (2024). According to the second row of Fig. A.4, the replacement of the pre-existing gas takes place between TUniverse ∼ 5.8 Gyr and TUniverse ∼ 7.2 Gyr. As shown in Fig. A.1 in Peirani et al. (2024), this period corresponds precisely to a sudden increase of the radiative efficiency (ϵr) values along with a high spin parameter.
Regarding BH796, the massive central BH associated with G2, the evolution of its properties is shown in Appendix C. From Fig. C.1, we found similar trends to those of BH1049 and BH549. More specifically, ϵr and the spin parameter are very high from TUniverse ∼ 4.4 Gyr to TUniverse ∼ 5.2 Gyr which corresponds to the replacement of the pre-existing gas component.
Overall, our results suggest an enhancement of the BH activity during the removal of the pre-existing gas disk. Such trends are consistent with recent theoretical and observational analysis suggesting a correlation between BH/AGN activity and the formation of counter-rotating structures (Duckworth et al. 2019; Raimundo et al. 2023).
Furthermore, once the gas-versus-stars counter-rotating galaxies has formed, the orientation of the BH spin is more likely to become anti-aligned with respect to AM of the stellar component (Peirani et al. 2024).
4.5. Fate of counter-rotating galaxies
Once a gas-versus-stars counter-rotating galaxy has formed, one interesting question concerns its possible fate. Although we have considered only ten galaxies, we found different possible evolutions.
First, without any strong perturbation from the nearby environment such as galaxy interaction and mergers, the counter-rotating gas-stellar disks can have a stable configuration which can last for several giga years. For instance, after experienced a major merger, the counter-rotating disks in G31 is stable at least for more than 4 Gyrs. Also, G70 keeps this configuration for more than 2 Gyrs (i.e., until the end of the simulation).
Second, if a galaxy undergoes another retrograde gas accretion, which is the case for G11, the final object becomes a galaxy with co-rotating stars and gas. If the galaxy undergoes a major merger, these potential mechanisms may destroy the counter-rotating disks configuration.
Third, there is a more subtle evolution. In the case of G2635 (or G30 and G173), the new stars that form in the disk with ϵ* < 0 can progressively dominate the AM budget of the galaxy estimated at the effective radius (but same behavior is find when considering two and five effective radii). In this case, the stellar AM orientation will flip and Ψ will be close to 0°. According to our definition, the galaxy is not classified as a gas-versus-star counter-rotating galaxy anymore.
We also note that a galaxy can experience more than one episode of gas-versus-stars counter-rotating galaxies formation, for instance, in G2635, G30, but also in G11 with two successive retrograde cosmic gas accretions.
4.6. The frequency of counter-rotating galaxies
At z = 0.18, we found that ∼4.5% of galaxies with a mass greater than 109 M⊙ present distinct stars-gas counter-rotating components. Although the volume covered by NEWHORIZON is relatively small, it is still instructive to compare this trend with those obtained from other numerical works or from observational analyses.
First, our derived fraction is similar to the one obtained by Cenci et al. (2024) with about 4% of FIREbox galaxies with stellar masses larger than 5 × 10⁹ M⊙ at z = 0 exhibiting gas–star kinematic misalignment. Similarly, Baker et al. (2024) analyzed the EAGLE simulation (Schaye et al. 2015) and found that gas counter-rotation can be present in 5.7% of the galaxy sample with mass greater than 109.5 M⊙ at z ≈ 0.1 (see also Casanueva et al. 2022). A lower value is however obtained by Starkenburg et al. (2019) from the Illustris simulation (Vogelsberger et al. 2014). They indeed studied the origin of such counter-rotation in low mass galaxies (2 × 10⁹–5 × 10¹⁰ M⊙) and found that only ∼1% of the sample shows a counter-rotating gaseous disk at z = 0. Moreover, although the corresponding fraction value is not explicitly reported, Khoperskov et al. (2021) selected only 25 galaxies from illustrisTNG100 with a mass greater than 109 M⊙ at z = 0. This number may appear quite low given the fact that the simulation has a box side of 75 Mpc/h and then a volume much bigger than NEWHORIZON (∼300 times). Nevertheless, the discrepancies between these numerical works may be attributed to existing differences in the galaxies selection strategy, the spatial/mass resolutions and treatment of feedback processes (in particular the efficiency of AGN feedback in depleting the gas content in massive galaxies and groups) as well as the different studied environments. For instance, NEWHORIZON has been dedicated to study the formation of galaxies in the field environments. It does not consider cluster environments in which interaction of galaxies is more frequent and may favor the appearance of episodes of counter-rotating components while reducing their lifetime.
As far as observations are concerned, stars-gas counter-rotating galaxies are generally selected when the PA offset between the stars and gas components ranges from 150° to 180°. For example, Beom et al. (2024) found a fraction of ∼3.0% by identifying 303 gaseous counter-rotators out of 9992 galaxies in MaNGA (> 109 M⊙). This is consistent with Li et al. (2021) who have also considered the MaNGA sample and focused on star forming and quiescent galaxies samples to get a fraction of counter-rotators of ∼3.3%. We note that a lower value of ∼1.9% was previously obtained by identifying 10 stars-gas counter-rotating components among 523 edge-on disk galaxies in MaNGA (MPL-11; Beom et al. 2022). These trends are consistent with Bryant et al. (2019) using the SAMI data with a fraction of about 3.5% (including late-type and early-type galaxies).
5. Summary and conclusions
Using the NEWHORIZON simulation, we studied the formation of gas-versus-stars counter-rotating galaxies with a stellar mass of ≿1010 M⊙. The identification of these galaxies is based on the 3D angle Ψ subtended between the stellar and gas AM vectors (estimated within one effective radius). Our final sample consisted of ten galaxies satisfying Ψ > 120° that present similarities and differences in their evolution. Our main conclusions can be summarized as follows:
1. The physical mechanism responsible for the formation of gas-versus-stars counter-rotating disks is common for all galaxies of our sample. It follows two successive phases. A first phase starts with the retrograde cosmic gas accretion from gas stripping in galaxy interaction or from the circumgalactic medium. Then, a second phase is characterized with the coexistence of two gas components rotating in opposite directions, with the pre-existing one being progressively replaced by the accreted one.
2. During the second phase, the pre-exiting gas is compressed by the accreted gas, and a large fraction of the gas is consumed and converted into stars. The remaining fraction is more likely to be expelled or diluted in the accreted disk. In very good agreement with Cenci et al. (2024), this phase can be decomposed into two stages: (1) First, a gas compaction is observed and is associated with an enhancement of the star formation rate that results in an increase and a decrease of the mean circularity parameter of star and gas, respectively; (2) The newly accreted gas gradually forms a counter-rotating disk with respect to the main stellar component and leads the average circularity of the stellar and gas components to decrease. Also, during this phase, if a central BH is present in the center of the galaxy, the gas accretion onto the BH is very efficient, and its is activity enhanced.
3. The formation of a counter-rotating gas component is always accompanied by the formation of counter-rotating stellar components. The latter can have different properties depending on the star formation histories and merger process. However, our results suggest that, in most cases, once the accreted gas has totally replaced the pre-existing disk, some in situ star formation takes place and produces counter-rotating stars in the central part of the galaxy. This may induce a positive age gradient. Moreover, it should be possible to accurately date the formation of the counter-rotating disk by identifying such stars in observational analyses.
4. Depending on the star formation and supernovae activity, which is generally more pronounced in the inner parts of the galaxies, the accreted gas might be gradually enriched in metal as its sinks toward the galaxy center. Consequently, counter-rotating stars that form in situ could be metal rich even though the accreted gas originally had a lower metallicity.
5. Counter-rotating stars are generally slightly younger and more metal rich than co-rotating ones. This trend is more pronounced at larger radii. Also, counter-rotating stars located in the inner parts of galaxies tend to be younger and more metal rich than those in the outer parts.
6. In the major merger scenario, a larger fraction of stars are more likely to be expelled and diffuse in the outer part of the remnant object. In this case, different populations of stars rotating in opposite directions are more likely to be observed or detected. Also, major mergers redistribute the stars along all directions, which is expected to smooth any significant age or metal gradient.
Cosmological filaments and gas-rich satellites are considered the main candidate sources of external cold gas. However, it is particularly difficult to separate them in observational analyses. Our analysis of a sample of ten galaxies is limited since all the galaxies develop counter-rotating components due to galaxy satellite interaction. However, there are clear signatures inherent to galaxy interaction and merger. On the one hand, the merger scenario is expected to display a fraction of stars in the outer parts of a galaxy. These stars may have different age and metal properties from the in situ formed stars in the center of the galaxy. In the case of gas accretion from cosmological filaments, we do not expect to observe such trends. Moreover, as specified in Point 6, any age or metal gradient is expected to be smoothed during a merger event. This is what we found with G31 and G83, where the mean age and mean metallicity tend to be constant at larger radii. This is also the case with G173, which underwent two successive minor mergers.
Although our analysis gives detailed insights on the formation of gas-versus-stars counter-rotating galaxies, several limitations remain. For instance, the NEWHORIZON simulation has been dedicated to studying the formation of galaxies in the field environments. Therefore, we have not studied the formation process in the cluster environment in which the interaction of galaxies is more frequent. Consequently, episodes of counter-rotating components might also be more frequent and their lifetime might be reduced. Moreover, our sample only consists of ten low-mass galaxies. It would therefore be interesting to consider a lower mass galaxy range in order to investigate whether the same mechanisms operate. Other high resolution simulations are therefore needed to lead more robust statistical analyses and help interpret the forthcoming high spectral and spatial resolution data from, for example, the Multi Unit Spectroscopic Explorer (Bacon et al. 2010) or the James Webb Space Telescope (Gardner et al. 2006).
The possibility to use accurate tracer particles of baryon dynamics in RAMSES simulation (Cadiou et al. 2019) has not been considered in the completion of NEWHORIZON.
Acknowledgments
We warmly thank the referee for an insightful review that considerably improved the quality of the original manuscript. It is a pleasure to thank Stéphane Colombi for interesting discussions. S.P. acknowledges the support from the JSPS (Japan Society for the Promotion of Science) long-term invitation program, and is grateful for the hospitality at Department of Physics, the University of Tokyo. This research is partly supported by the JSPS KAKENHI grant Nos. 23K25908 (Y.S.). This work was granted access to the HPC resources of CINES under the allocations c2016047637, A0020407637 and A0070402192 by Genci, KSC-2017-G2-0003, KSC-2020-CRE-0055 and KSC-2020-CRE-0280 by KISTI, and as a “Grand Challenge” project granted by GENCI on the AMD Rome extension of the Joliot Curie supercomputer at TGCC. The large data transfer was supported by KREONET, which is managed and operated by KISTI. S.K.Y. acknowledges support from the Korean National Research Foundation (2020R1A2C3003769,RS-2022-NR070872). This work was carried within the framework of the Horizon project (http://www.projet-horizon.fr). Most of the numerical modeling presented here was done on the Horizon cluster at Institut d’Astrophysique de Paris (IAP).
References
- Abadi, M. G., Navarro, J. F., Steinmetz, M., & Eke, V. R. 2003, ApJ, 597, 21 [NASA ADS] [CrossRef] [Google Scholar]
- Algorry, D. G., Navarro, J. F., Abadi, M. G., et al. 2014, MNRAS, 437, 3596 [Google Scholar]
- Aubert, D., Pichon, C., & Colombi, S. 2004, MNRAS, 352, 376 [Google Scholar]
- Bacon, R., Copin, Y., Monnet, G., et al. 2001, MNRAS, 326, 23 [Google Scholar]
- Bacon, R., Accardo, M., Adjali, L., et al. 2010, in Ground-based and Airborne Instrumentation for Astronomy III, eds. I. S. McLean, S. K. Ramsay, & H. Takami, Society of Photo-Optical Instrumentation Engineers (SPIE) Conference Series, 7735, 773508 [Google Scholar]
- Baker, M. K., Davis, T. A., van de Voort, F., & Ruffa, I. 2024, arXiv e-prints [arXiv:2412.03707] [Google Scholar]
- Bao, M., Chen, Y., Zhu, P., et al. 2022, ApJ, 926, L13 [CrossRef] [Google Scholar]
- Bao, M., Chen, Y., Yang, M., et al. 2024, MNRAS, 528, 2643 [Google Scholar]
- Bellovary, J. M., Cleary, C. E., Munshi, F., et al. 2019, MNRAS, 482, 2913 [NASA ADS] [Google Scholar]
- Beom, M., Bizyaev, D., Walterbos, R. A. M., & Chen, Y. 2022, MNRAS, 516, 3175 [CrossRef] [Google Scholar]
- Beom, M., Walterbos, R. A. M., & Bizyaev, D. 2024, AJ, 168, 197 [Google Scholar]
- Bevacqua, D., Cappellari, M., & Pellegrini, S. 2022, MNRAS, 511, 139 [NASA ADS] [CrossRef] [Google Scholar]
- Bryant, J. J., Croom, S. M., van de Sande, J., et al. 2019, MNRAS, 483, 458 [NASA ADS] [CrossRef] [Google Scholar]
- Bundy, K., Bershady, M. A., Law, D. R., et al. 2015, ApJ, 798, 7 [Google Scholar]
- Cadiou, C., Dubois, Y., & Pichon, C. 2019, A&A, 621, A96 [NASA ADS] [CrossRef] [EDP Sciences] [Google Scholar]
- Cao, X., Chen, Y.-M., Shi, Y., et al. 2022, Nat. Astron., 6, 1464 [CrossRef] [Google Scholar]
- Cappellari, M., Emsellem, E., Krajnović, D., et al. 2011, MNRAS, 413, 813 [Google Scholar]
- Casanueva, C. I., Lagos, C. d. P., Padilla, N. D., & Davison, T. A. 2022, MNRAS, 514, 2031 [NASA ADS] [Google Scholar]
- Cenci, E., Feldmann, R., Gensior, J., et al. 2024, ApJ, 961, L40 [Google Scholar]
- Chen, Y.-M., Shi, Y., Tremonti, C. A., et al. 2016, Nat. Commun., 7, 13269 [NASA ADS] [CrossRef] [Google Scholar]
- Coccato, L., Morelli, L., Corsini, E. M., et al. 2011, MNRAS, 412, L113 [NASA ADS] [CrossRef] [Google Scholar]
- Cole, S., Lacey, C. G., Baugh, C. M., & Frenk, C. S. 2000, MNRAS, 319, 168 [Google Scholar]
- Croom, S. M., Lawrence, J. S., Bland-Hawthorn, J., et al. 2012, MNRAS, 421, 872 [NASA ADS] [Google Scholar]
- Davis, T. A., Alatalo, K., Sarzi, M., et al. 2011, MNRAS, 417, 882 [Google Scholar]
- Dekel, A., & Birnboim, Y. 2006, MNRAS, 368, 2 [NASA ADS] [CrossRef] [Google Scholar]
- Dubois, Y., Pichon, C., Welker, C., et al. 2014, MNRAS, 444, 1453 [Google Scholar]
- Dubois, Y., Volonteri, M., Silk, J., et al. 2015, MNRAS, 452, 1502 [Google Scholar]
- Dubois, Y., Beckmann, R., Bournaud, F., et al. 2021, A&A, 651, A109 [NASA ADS] [CrossRef] [EDP Sciences] [Google Scholar]
- Duckworth, C., Tojeiro, R., Kraljic, K., et al. 2019, MNRAS, 483, 172 [Google Scholar]
- Duckworth, C., Tojeiro, R., & Kraljic, K. 2020, MNRAS, 492, 1869 [NASA ADS] [CrossRef] [Google Scholar]
- Eisenstein, D. J., & Hut, P. 1998, ApJ, 498, 137 [NASA ADS] [CrossRef] [Google Scholar]
- Evans, N. W., & Collett, J. L. 1994, ApJ, 420, L67 [Google Scholar]
- Fall, S. M., & Efstathiou, G. 1980, MNRAS, 193, 189 [NASA ADS] [CrossRef] [Google Scholar]
- Feldmann, R., Quataert, E., Faucher-Giguère, C.-A., et al. 2023, MNRAS, 522, 3831 [NASA ADS] [CrossRef] [Google Scholar]
- Gallazzi, A., Bell, E. F., Zibetti, S., Brinchmann, J., & Kelson, D. D. 2014, ApJ, 788, 72 [Google Scholar]
- García-Lorenzo, B., Márquez, I., Barrera-Ballesteros, J. K., et al. 2015, A&A, 573, A59 [NASA ADS] [CrossRef] [EDP Sciences] [Google Scholar]
- Gardner, J. P., Mather, J. C., Clampin, M., et al. 2006, Space Sci. Rev., 123, 485 [Google Scholar]
- Han, S., Jang, J. K., Contini, E., et al. 2024, ApJ, 977, 116 [Google Scholar]
- Hopkins, P. F., Kereš, D., Oñorbe, J., et al. 2014, MNRAS, 445, 581 [NASA ADS] [CrossRef] [Google Scholar]
- Jin, Y., Chen, Y., Shi, Y., et al. 2016, MNRAS, 463, 913 [Google Scholar]
- Johnston, E. J., Merrifield, M. R., Aragón-Salamanca, A., & Cappellari, M. 2013, MNRAS, 428, 1296 [Google Scholar]
- Kannappan, S. J., & Fabricant, D. G. 2001, AJ, 121, 140 [Google Scholar]
- Katkov, I. Y., Sil’chenko, O. K., & Afanasiev, V. L. 2013, ApJ, 769, 105 [NASA ADS] [CrossRef] [Google Scholar]
- Katkov, I. Y., Sil’chenko, O. K., & Afanasiev, V. L. 2014, MNRAS, 438, 2798 [Google Scholar]
- Katkov, I. Y., Sil’chenko, O. K., Chilingarian, I. V., Uklein, R. I., & Egorov, O. V. 2016, MNRAS, 461, 2068 [Google Scholar]
- Katkov, I. Y., Gasymov, D., Kniazev, A. Y., et al. 2024, ApJ, 962, 27 [NASA ADS] [CrossRef] [Google Scholar]
- Kaviraj, S., Peirani, S., Khochfar, S., Silk, J., & Kay, S. 2009, MNRAS, 394, 1713 [NASA ADS] [CrossRef] [Google Scholar]
- Kereš, D., Katz, N., Weinberg, D. H., & Davé, R. 2005, MNRAS, 363, 2 [Google Scholar]
- Khim, D. J., Yi, S. K., Dubois, Y., et al. 2020, ApJ, 894, 106 [Google Scholar]
- Khim, D. J., Yi, S. K., Pichon, C., et al. 2021, ApJS, 254, 27 [Google Scholar]
- Khoperskov, S., Zinchenko, I., Avramov, B., et al. 2021, MNRAS, 500, 3870 [Google Scholar]
- Kimm, T., Katz, H., Haehnelt, M., et al. 2017, MNRAS, 466, 4826 [NASA ADS] [Google Scholar]
- Komatsu, E., Smith, K. M., Dunkley, J., et al. 2011, ApJS, 192, 18 [Google Scholar]
- Krajnović, D., Emsellem, E., Cappellari, M., et al. 2011, MNRAS, 414, 2923 [Google Scholar]
- Li, S.-L., Shi, Y., Bizyaev, D., et al. 2021, MNRAS, 501, 14 [Google Scholar]
- Lu, S., Xu, D., Wang, Y., et al. 2021, MNRAS, 503, 726 [Google Scholar]
- Mo, H. J., Mao, S., & White, S. D. M. 1998, MNRAS, 295, 319 [Google Scholar]
- Monaghan, J. J. 1992, ARA&A, 30, 543 [NASA ADS] [CrossRef] [Google Scholar]
- Nanni, L., Thomas, D., Trayford, J., et al. 2022, MNRAS, 515, 320 [CrossRef] [Google Scholar]
- Ocvirk, P., Pichon, C., & Teyssier, R. 2008, MNRAS, 390, 1326 [Google Scholar]
- Omori, K. C., & Takeuchi, T. T. 2021, A&A, 647, A181 [NASA ADS] [CrossRef] [EDP Sciences] [Google Scholar]
- Park, M.-J., Yi, S. K., Dubois, Y., et al. 2019, ApJ, 883, 25 [Google Scholar]
- Park, M. J., Yi, S. K., Peirani, S., et al. 2021, ApJS, 254, 2 [Google Scholar]
- Peirani, S., Suto, Y., Beckmann, R. S., et al. 2024, A&A, 686, A233 [NASA ADS] [CrossRef] [EDP Sciences] [Google Scholar]
- Pfister, H., Volonteri, M., Dubois, Y., Dotti, M., & Colpi, M. 2019, MNRAS, 486, 101 [Google Scholar]
- Pillepich, A., Springel, V., Nelson, D., et al. 2018, MNRAS, 473, 4077 [Google Scholar]
- Pizzella, A., Corsini, E. M., Vega Beltrán, J. C., & Bertola, F. 2004, A&A, 424, 447 [NASA ADS] [CrossRef] [EDP Sciences] [Google Scholar]
- Prunet, S., Pichon, C., Aubert, D., et al. 2008, ApJS, 178, 179 [NASA ADS] [CrossRef] [Google Scholar]
- Raimundo, S. I. 2021, A&A, 650, A34 [NASA ADS] [CrossRef] [EDP Sciences] [Google Scholar]
- Raimundo, S. I., Malkan, M., & Vestergaard, M. 2023, Nat. Astron., 7, 463 [NASA ADS] [CrossRef] [Google Scholar]
- Roškar, R., Debattista, V. P., Brooks, A. M., et al. 2010, MNRAS, 408, 783 [CrossRef] [Google Scholar]
- Rubino, M., Pizzella, A., Morelli, L., et al. 2021, A&A, 654, A30 [NASA ADS] [CrossRef] [EDP Sciences] [Google Scholar]
- Sánchez, S. F., Kennicutt, R. C., Gil de Paz, A., et al. 2012, A&A, 538, A8 [Google Scholar]
- Sarmiento, R., Huertas-Company, M., Knapen, J. H., et al. 2023, A&A, 673, A23 [NASA ADS] [CrossRef] [EDP Sciences] [Google Scholar]
- Sarzi, M., Falcón-Barroso, J., Davies, R. L., et al. 2006, MNRAS, 366, 1151 [Google Scholar]
- Schaye, J., Crain, R. A., Bower, R. G., et al. 2015, MNRAS, 446, 521 [Google Scholar]
- Starkenburg, T. K., Sales, L. V., Genel, S., et al. 2019, ApJ, 878, 143 [Google Scholar]
- Taylor, P., Federrath, C., & Kobayashi, C. 2018, MNRAS, 479, 141 [Google Scholar]
- Teyssier, R. 2002, A&A, 385, 337 [CrossRef] [EDP Sciences] [Google Scholar]
- Thakar, A. R., & Ryden, B. S. 1996, ApJ, 461, 55 [NASA ADS] [CrossRef] [Google Scholar]
- Toro, E. 1999, Riemann Solvers and Numerical Methods for Fluid Dynamics (Springer-Verlag) [Google Scholar]
- Torrey, P., Vogelsberger, M., Sijacki, D., Springel, V., & Hernquist, L. 2012, MNRAS, 427, 2224 [NASA ADS] [CrossRef] [Google Scholar]
- Tweed, D., Devriendt, J., Blaizot, J., Colombi, S., & Slyz, A. 2009, A&A, 506, 647 [NASA ADS] [CrossRef] [EDP Sciences] [Google Scholar]
- van de Voort, F., Davis, T. A., Kereš, D., et al. 2015, MNRAS, 451, 3269 [Google Scholar]
- Vogelsberger, M., Genel, S., Springel, V., et al. 2014, MNRAS, 444, 1518 [Google Scholar]
- Xu, H., Chen, Y., Shi, Y., et al. 2022, MNRAS, 511, 4685 [NASA ADS] [CrossRef] [Google Scholar]
- Yi, S. K., Jang, J. K., Devriendt, J., et al. 2024, ApJS, 271, 1 [NASA ADS] [CrossRef] [Google Scholar]
- Zhou, Y., Chen, Y., Shi, Y., et al. 2022, MNRAS, 515, 5081 [Google Scholar]
- Zhou, Y., Chen, Y., Shi, Y., et al. 2024, ApJ, 977, 62 [Google Scholar]
- Zinchenko, I. A. 2023, A&A, 674, L7 [NASA ADS] [CrossRef] [EDP Sciences] [Google Scholar]
Appendix A: Additional figures
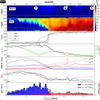 |
Fig. A.1. Same as Fig. 4 but we have added here in the fourth row the time evolution of the distance (dHS)between the host (G70) and the satellite galaxy. This shows clearly the different passages at the pericentric distance and the time of the final plunge (TUniverse∼10.6 Gyr). Here again, we choose the z-axis of the cylindrical coordinate as the total AM vector direction of the stellar component estimated within one effective radius. |
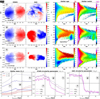 |
Fig. A.2. Same as Fig. 5 but for the galaxy G70. This latter undergoes a minor merger at z∼0.27. We thus take an interest in three different epochs: in the cosmic gas accretion phase prior the merger (&#Xtextcircled;f), close to the final plunge (&#Xtextcircled;g) and at z = 0.18 or 2.3 Gyr after the removal of the pre-existing disk (&#Xtextcircled;g). At epoch &#Xtextcircled;g, the satellite can be identified in both the ϵ∗-r-age and ϵ∗-r-metal diagrams. It is composed of a population of young stars with a global metallicty of log(Z/Z⊙)∼-0.85 (green color). We note that some of the stars formed in the satellite are accreted by the main galaxy by tidal stripping at &#Xtextcircled;f. Then after the final plunge at epoch &#Xtextcircled;h, the counter-rotating stellar component (ϵ* < 0) is composed of two main components: the in situ formed stars at r< 7.5 kpc, characterized by a high metalicity, and the stars formed in the satellite displayed at larger radii owing a lower metalicty. |
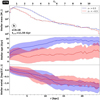 |
Fig. A.3. Same as Fig. 7 but for G31. The trends are different than those from G11 since the star formation activity after the total replacement of the pre-existing gas is here more pronounced. And in this specific object, counter-rotating stars tend to be younger and very slightly more metal rich than co-rotating stars in the inner parts. Otherwise, counter-rotating stars tend to be younger and more metal rich in the inner parts than in the outer parts. |
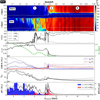 |
Fig. A.4. Same as Fig. 4 but we have interposed here at the fourth row the time evolution of the distance separation between the galaxy satellite from the main galaxy, G31. We note that the evolution of Ψ estimated within five effective radii shows a completely opposite trend than the two other ones (i.e., < Re and < 2Re) after the merger as encompassing distant counter-rotating stars flip the average stellar AM. |
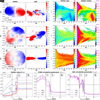 |
Fig. A.5. Same as Fig. 5 but for G31. Before the final plunge (TUniverse∼7.1 Gyr), the gas velocity field is perturbed by the accretion of gas from tidal stripping. Right after the final plunge, epoch &#Xtextcircled;j, two stellar components can be identified: in the inner part, the original stars from the host galaxy G31 and in the outer part, the star originated from the satellite galaxy, which are displayed due to the orbital AM. When the satellite is passing by the pericentric distance, the tidal disruption of the process lead to the formation of stellar streams clearly visible in the ϵ∗-r-age and ϵ∗-r-metal diagrams. We note that the misalignment between the two stellar components at epoch &#Xtextcircled;j is due to the orbital configuration of the major merger. Interestingly, this misalignment seems to weaken in the time, as seen in epoch &#Xtextcircled;k. It is also remarkable that at this epoch, three distinct populations of stars can be identified: the main stellar component in the middle and two counter-rotating stellar components, in the very inner parts (stars formed in situ) and in the outer parts (accreted stars). |
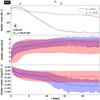 |
Fig. A.6. Same as Fig. 7 but for G31. Since G31 experienced a major merger, a large fraction of CR stellar disk (i.e., ϵ*< -0.5) is displayed in the outer parts. A clear signature of this is the higher fraction in mass of counter-rotating stars in the outer parts with respect to co-rotating stars (upper panel, red line). Other potential signatures lie in the mean age and mean mellaticity of counter-rotating stars with constant values at larger radius (here r> 4 kpc). We note that the mean metallicity of log(Z/Z⊙)∼-0.25 is proved to match with the mean metallicity of the satellite prior the merger event. |
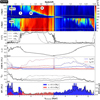 |
Fig. A.7. Same as Fig. 4 but for G2835. Here the interesting feature happens at TUniverse∼8 Gyr where the orientation of the AM of the stellar component (estimated at the effective radius) flips. This is mainly due to the contribution of the newly form stars in the disk. |
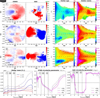 |
Fig. A.8. Same as Fig.5 but for G2835. At &#Xtextcircled;l, both edge-on stellar and gas projected velocity fields are quite disturbed due to the interaction of several galaxies. At this epoch, at least two galaxy satellites are present within 25 kpc. They can be identified in the ϵ*-r-age and ϵ*-r-metal diagram at r∼11 kpc and r∼17 kpc, where their stars are generally young (age< 2 Gyrs) with a global metalicity of ∼-1.2 (green) and ∼-0.35 (red) respectively. A clear counter-rotating stellar-gas disks are obtained at &#Xtextcircled;m within 5 kpc. Some new stars are forming with ϵ*∼-1 and r< 10 kpc with a high metalicity. at epoch &#Xtextcircled;n, the new stars have now a high contribution within 15 kpc (ϵ*∼-1) and tend to dominate at r> 5.5 kpc in the stellar projected velocity field. |
Appendix B: Other individual evolutions
We present the results for the other galaxies of the sample. Although our sample is limited to ten galaxies, the latter have diverse properties at different stages of their evolution. This could be relevant and useful for the interpretation of observational data.
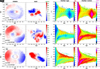 |
Fig. B.3. Same as Fig. 5 but for G83. However, here we do not show the time evolution of the stellar mass and the mean circularity parameters for stars and gas. |
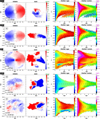 |
Fig. B.4. Same as Fig. 5 but for G23, G45, G2 and G30. Here, however, we do not show the time evolution of the stellar mass and the mean circularity parameters for stars and gas. |
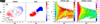 |
Fig. B.5. Same as Fig. 5 but for G173. Here, however, we do not show here the time evolution of the stellar mass and the mean circularity parameters for stars and gas. |
Appendix C: Evolution of BH796
Similarly to Peirani et al. (2024), we present here the cosmic evolution of the relevant properties of the central balck hole BH796, hosted by G2.
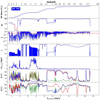 |
Fig. C.1. Evolution of relevant properties of the central black hole BH796. From top to bottom:1) BH mass evolution. The red and green dashed lines indicate epochs of major and minor mergers episodes respectively; 2) BH spin evolution |a|. Red colors indicates when the gas accretion disk is in counter-rotation (i.e., a< 0); 3 The Eddington ratio evolution (χ). The red line delimits the quasar dominant mode (χ> 0.01) and the radio dominant mode (χ< 0.01); 4) The evolution of the radiative efficiency of the gas accretion disk (ϵr); 5) The variation of the distance separation between the location of the BH and the center of its host galaxy (dstar,BH); 6) the evolution of the angle Ψstar,BH between the BH spin and the AM of the stellar component (blue) estimated within one effective radius. We also plot the angle between the BH spin and the AM of the gas accretion disk (green) as well as the angle between the stellar and the accreted gas component (red); 7) The evolution of the polar angle θ describing the orientation of the BH spin (blue), the stellar (red) and gas accretion disk (green) angular momenta relative to a fixed reference frame of the simulation. |
All Tables
Identity and mass of each galaxy identified at z = 0.18 from the NEWHORIZON simulation and studied in this work.
All Figures
|
Fig. 1. Three-dimensional angles Ψ subtended between the stellar and gas AM vectors, both estimated within one effective radius Re, at z = 0.66 (upper panel) and z = 0.18 (lower panel). Our final sample of gas-versus-stars counter-rotating galaxies consists of galaxies with non-disturbed morphology (or in an ongoing merging phase) with a mass greater than 109 M⊙ and Ψ > 120°. We also used a color coding according to the quantity V*/σ (also estimated within one effective radius). Gas-star kinetic misaligned galaxies are more likely to form in spheroidal-dominated galaxies (associated with low V*/σ values). |
| In the text | |
|
Fig. 2. Projected gas density (ρ) around two galaxies from our sample, G23 (upper panel) and G11 (lower panel). These two panels illustrate each of the two successive phases leading to the formation of gas-versus-stars counter-rotating disks. In the upper panel, the central galaxy (G23) has a counterclockwise rotation, as specified by the dashed circular arrow, and is accreting some gas from a companion galaxy through tidal stripping. In this specific case, the orbit of the satellite galaxy is indirect (or retrograde) as illustrated by the orientation of the two arrows. Then, the retrograde accretion of gas may lead afterward to the coexistence of two disks of gas that rotate in opposite sense, as shown in the lower panel by the spectacular case of G11. The accreted gas lies in the outer parts of the galaxy while the pre-existing one is concentrated in the inner parts. The process ends when the latter is totally replaced by the former. |
| In the text | |
|
Fig. 3. For galaxy G11, projected u-g-r band images of the stellar component (first row), projected gas density (ρ, second row), and the associated projected velocity fields (third and fourth rows) at five different epochs (symbolized by items &#Xtextcircled;a–&#Xtextcircled;e). The values of rotation velocities are indicated by the color bar, the red parts are moving away from us while the blue ones are approaching us. The galaxy undergoes two successive episodes of retrograde gas accretion. At epoch &#Xtextcircled;a, the stars and central gas component are co-rotating. Then the first gas accretion lead to the coexistence of two disks of gas which rotate in opposite direction: the accreted material in the outer parts and the pre-existing one on the inner region (&#Xtextcircled;b). At epoch &#Xtextcircled;c, the new disk of gas has totally replaced the pre-existing one leading to the stellar-gas counter-rotating configuration. However, a new episode of retrograde gas accretion with respect to the inner disk (hence this new gas component is co-rotating with the stars) is already starting. Then epochs &#Xtextcircled;d and &#Xtextcircled;e repeat the same steps namely coexistence of two counter-rotating gas disks ending with a complete replacement. |
| In the text | |
|
Fig. 4. Cosmic evolution of relevant properties relative to G11. From top to bottom: (1) Mass-weighted angle Φ(r) between the AM vector of the stellar component (computed by taking all stars within one effective radius) and the AM vector of all stars located within two concentric spheres of radius r − dr and r + dr. Φ(r) estimated within 0 < r < 10 kpc using 50 bins. The dotted line indicates the time evolution of Re; (2) Φ(r) computed this time with all “cold” gas cells located within two concentric spheres of radius r and r + dr. (3) Evolution of the 3D angle Ψ subtended between the stellar and gas AM vectors estimated within one (solid line), two (dashed line) or five (dotted line) effective radii. (4) Ratio of the stellar rotational velocity to the stellar velocity dispersion V*/σ estimated within one effective radius. (5) Masses of cold gas that co- or counter-rotate with the stellar component, estimated by selecting all (cold) gas cells with positive (blue lines) or negative (red lines) circularity parameters. We also estimate these two quantities within one, two, or five effective radii. (6) Evolution of the (cold) gas fraction, fgas = Mgas/(Mgas + Mstars) also estimated within one, two, or five effective radii. (7) Mass of new stars formed in situ within five effective radii in successive intervals and color coded according to positive (blue lines) and negative (red lines) circularity parameters. We also plot in the same panel, the cosmic star formation rate estimated by identifying all stars born in situ within the last 100 Myr within one, two, or five effective radii. We note that the z-axis of the cylindrical coordinate at any time corresponds to the total AM vector direction of the stellar component estimated within one effective radius. |
| In the text | |
|
Fig. 5. Projected edge-on mass-weighted velocity fields (first and second columns) and associated mass-weighted stellar circularity parameter (ϵ*)-radial distance-stellar age diagram (third column) and ϵ*-radial distance-stellar metallicity diagram (fourth column) for galaxy G11 at epochs &#Xtextcircled;b, &#Xtextcircled;c, and &#Xtextcircled;d. Again, the values of rotation velocities are indicated by the color bar: The red parts are moving away from the viewer, while the blue ones are approaching. The dotted circles and dotted lines indicate values of the effective radius. The dashed lines represent ϵ* = 0. Each diagram is sampled using a regular grid of 80 × 80 pixels. Only pixels with at least five stellar particles are taken into account. This galaxy displays three different gas-stars misalignment configurations in its lifetime: At epoch &#Xtextcircled;b, the outer parts of the gas disk are counter-rotating with the stellar component, whereas at epoch &#Xtextcircled;d, it is the inner part of the gas disk that is in counter-rotation. Meanwhile at epoch &#Xtextcircled;c, a clear gas-versus-stars counter-rotating disks is obtained (within 10 kpc, i.e., ∼8 Re). We also note that in &#Xtextcircled;d, the two disks of stars are not entirely co-planar but have a misaligned angle of a ΔPA ∼ 198°. To facilitate the comparison with the trends presented in the previous figure, we plot in the last row the time evolution of the total stellar mass for stars satisfying either ϵ* > 0 or ϵ* < 0 (left panel) along with the evolution of the mean circularity parameters for stars (middle) and gas (right). All quantities are estimated within one (solid line), two (dashed line), or five (dotted line) effective radii. |
| In the text | |
|
Fig. 6. Gas circularity parameter-radial distance-stellar metallicity diagrams at four different times. At epoch &#Xtextcircled;b, the pre-existing disk (ϵ* > 0) has a high metallicity (log(Z/Z⊙) > 0) compared to the accreted gas (log(Z/Z⊙) ∼ –0.7). We note that at r ∼ 1 kpc, there is some gas mixing at the interface of the two disks. At epoch &#Xtextcircled;c, the accreted gas has totally replaced the pre-existing one. Due to the lack of star formation and therefore to a subsequent low supernovae activity, the new disk tend to keep its original metallicity. In epoch &#Xtextcircled;d, the same phenomenon repeats: coexistence of two disks. The accreted gas is characterized here by a very low metalliciy (log(Z/Z⊙) < − 1). Then in epoch &#Xtextcircled;e, the new disk has totally replaced the older one, but due to a star formation activity slightly more pronounced during the gas accretion, the new gas disk has a metallicity that gradually increases from smaller to larger radii. |
| In the text | |
|
Fig. 7. Three-dimensional radial distributions of the mass (upper panel), age (middle panel), and metallicity (lower panel) of stars with circularity parameters satisfying ϵ* > 0.5 (blue lines) ϵ* < −0.5 (red lines) for G11 at z = 0.5 (epoch &#Xtextcircled;d). We also plot at the top the corresponding scale with respect to the effective radius. Shaded areas indicate the dispersion. Epoch &#Xtextcircled;d happens 1.2 Gyr after the total removal of the pre-existing disk at &#Xtextcircled;c. During this time, the star formation is very low, and the new stars mainly formed at the interface of the inner disk and the new accreted one. This explains the “V-shape” seen in the distribution of the stellar age of counter-rotating stars within 5 kpc. |
| In the text | |
|
Fig. 8. Variations of the gas circularity parameter ϵg with respect to the radial distance r and color coded according to the global gas metallicity at z = 0.33 (&#Xtextcircled;g). The gas in the satellite has a metallicy of log(Z/Z⊙) ∼ –0.85 (green) which is consistent with the metalicity of young stars displayed in Fig. A.2 (second line – fourth column). Then some of the gas of the satellite is accreted by G70 and is progressively enriched in metal as the radial distance decreases due to supernovae activity dominated by young stars in the central part. Consequently, the accreted gas reaches the galactic plane with a much higher metallicy and then forms stars that inherit the same high metallicity, consistent with trends found in Fig. A.2 at the same epoch. |
| In the text | |
|
Fig. 9. Projected edge-on mass-weighted stellar velocity dispersion fields (σ*) for G11, G70, G31, and G45. Each map has been derived at a specific epoch in which the galaxy is displaying a clear stars-gas counter-rotating configuration. For G11, G70, and G45, the presence of the counter-rotating stellar component cannot be seen in their projected stellar velocity fields but may be suggested by the presence of the double-peak feature exhibited in these maps. |
| In the text | |
|
Fig. 10. Estimation of the percentage of cold gas with ϵg > 0 converted into stars during the replacement of the inner gas disk, which preceded the formation of the gas-versus-stars counter-rotating disks, for all the studied galaxies. We also show the variations with respect to the stellar mass of the main galaxies (upper panel), the gas fraction fgas (middle panel) and V∗/σ, all quantities estimated just before the retrograde gas accretion phase. fgas and V∗/σ have been estimated both within one effective radius but the same trends are obtained when estimated within 5 Re. These plots first suggest that, during the removal of the pre-existing gas, on average, a higher fraction of cold gas is converted into stars rather than being expelled. Secondly, there is a clear correlation between the percentage of gas converted into stars and V∗/σ. The original morphology of galaxies therefore seems to impact the efficiency of the star formation during the compaction of the central gas component. |
| In the text | |
|
Fig. A.1. Same as Fig. 4 but we have added here in the fourth row the time evolution of the distance (dHS)between the host (G70) and the satellite galaxy. This shows clearly the different passages at the pericentric distance and the time of the final plunge (TUniverse∼10.6 Gyr). Here again, we choose the z-axis of the cylindrical coordinate as the total AM vector direction of the stellar component estimated within one effective radius. |
| In the text | |
|
Fig. A.2. Same as Fig. 5 but for the galaxy G70. This latter undergoes a minor merger at z∼0.27. We thus take an interest in three different epochs: in the cosmic gas accretion phase prior the merger (&#Xtextcircled;f), close to the final plunge (&#Xtextcircled;g) and at z = 0.18 or 2.3 Gyr after the removal of the pre-existing disk (&#Xtextcircled;g). At epoch &#Xtextcircled;g, the satellite can be identified in both the ϵ∗-r-age and ϵ∗-r-metal diagrams. It is composed of a population of young stars with a global metallicty of log(Z/Z⊙)∼-0.85 (green color). We note that some of the stars formed in the satellite are accreted by the main galaxy by tidal stripping at &#Xtextcircled;f. Then after the final plunge at epoch &#Xtextcircled;h, the counter-rotating stellar component (ϵ* < 0) is composed of two main components: the in situ formed stars at r< 7.5 kpc, characterized by a high metalicity, and the stars formed in the satellite displayed at larger radii owing a lower metalicty. |
| In the text | |
|
Fig. A.3. Same as Fig. 7 but for G31. The trends are different than those from G11 since the star formation activity after the total replacement of the pre-existing gas is here more pronounced. And in this specific object, counter-rotating stars tend to be younger and very slightly more metal rich than co-rotating stars in the inner parts. Otherwise, counter-rotating stars tend to be younger and more metal rich in the inner parts than in the outer parts. |
| In the text | |
|
Fig. A.4. Same as Fig. 4 but we have interposed here at the fourth row the time evolution of the distance separation between the galaxy satellite from the main galaxy, G31. We note that the evolution of Ψ estimated within five effective radii shows a completely opposite trend than the two other ones (i.e., < Re and < 2Re) after the merger as encompassing distant counter-rotating stars flip the average stellar AM. |
| In the text | |
|
Fig. A.5. Same as Fig. 5 but for G31. Before the final plunge (TUniverse∼7.1 Gyr), the gas velocity field is perturbed by the accretion of gas from tidal stripping. Right after the final plunge, epoch &#Xtextcircled;j, two stellar components can be identified: in the inner part, the original stars from the host galaxy G31 and in the outer part, the star originated from the satellite galaxy, which are displayed due to the orbital AM. When the satellite is passing by the pericentric distance, the tidal disruption of the process lead to the formation of stellar streams clearly visible in the ϵ∗-r-age and ϵ∗-r-metal diagrams. We note that the misalignment between the two stellar components at epoch &#Xtextcircled;j is due to the orbital configuration of the major merger. Interestingly, this misalignment seems to weaken in the time, as seen in epoch &#Xtextcircled;k. It is also remarkable that at this epoch, three distinct populations of stars can be identified: the main stellar component in the middle and two counter-rotating stellar components, in the very inner parts (stars formed in situ) and in the outer parts (accreted stars). |
| In the text | |
|
Fig. A.6. Same as Fig. 7 but for G31. Since G31 experienced a major merger, a large fraction of CR stellar disk (i.e., ϵ*< -0.5) is displayed in the outer parts. A clear signature of this is the higher fraction in mass of counter-rotating stars in the outer parts with respect to co-rotating stars (upper panel, red line). Other potential signatures lie in the mean age and mean mellaticity of counter-rotating stars with constant values at larger radius (here r> 4 kpc). We note that the mean metallicity of log(Z/Z⊙)∼-0.25 is proved to match with the mean metallicity of the satellite prior the merger event. |
| In the text | |
|
Fig. A.7. Same as Fig. 4 but for G2835. Here the interesting feature happens at TUniverse∼8 Gyr where the orientation of the AM of the stellar component (estimated at the effective radius) flips. This is mainly due to the contribution of the newly form stars in the disk. |
| In the text | |
|
Fig. A.8. Same as Fig.5 but for G2835. At &#Xtextcircled;l, both edge-on stellar and gas projected velocity fields are quite disturbed due to the interaction of several galaxies. At this epoch, at least two galaxy satellites are present within 25 kpc. They can be identified in the ϵ*-r-age and ϵ*-r-metal diagram at r∼11 kpc and r∼17 kpc, where their stars are generally young (age< 2 Gyrs) with a global metalicity of ∼-1.2 (green) and ∼-0.35 (red) respectively. A clear counter-rotating stellar-gas disks are obtained at &#Xtextcircled;m within 5 kpc. Some new stars are forming with ϵ*∼-1 and r< 10 kpc with a high metalicity. at epoch &#Xtextcircled;n, the new stars have now a high contribution within 15 kpc (ϵ*∼-1) and tend to dominate at r> 5.5 kpc in the stellar projected velocity field. |
| In the text | |
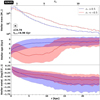 |
Fig. A.9. Same as Fig. 7 but for G2635. |
| In the text | |
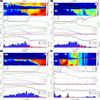 |
Fig. B.1. Same as Fig. 4 but for G83, G23, G45 and G2. |
| In the text | |
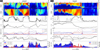 |
Fig. B.2. Same as Fig. 4 but for G30, G173. |
| In the text | |
|
Fig. B.3. Same as Fig. 5 but for G83. However, here we do not show the time evolution of the stellar mass and the mean circularity parameters for stars and gas. |
| In the text | |
|
Fig. B.4. Same as Fig. 5 but for G23, G45, G2 and G30. Here, however, we do not show the time evolution of the stellar mass and the mean circularity parameters for stars and gas. |
| In the text | |
|
Fig. B.5. Same as Fig. 5 but for G173. Here, however, we do not show here the time evolution of the stellar mass and the mean circularity parameters for stars and gas. |
| In the text | |
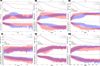 |
Fig. B.6. Same as Fig. 7 but for G23, G45, G83, G2, G30 and G173. |
| In the text | |
|
Fig. C.1. Evolution of relevant properties of the central black hole BH796. From top to bottom:1) BH mass evolution. The red and green dashed lines indicate epochs of major and minor mergers episodes respectively; 2) BH spin evolution |a|. Red colors indicates when the gas accretion disk is in counter-rotation (i.e., a< 0); 3 The Eddington ratio evolution (χ). The red line delimits the quasar dominant mode (χ> 0.01) and the radio dominant mode (χ< 0.01); 4) The evolution of the radiative efficiency of the gas accretion disk (ϵr); 5) The variation of the distance separation between the location of the BH and the center of its host galaxy (dstar,BH); 6) the evolution of the angle Ψstar,BH between the BH spin and the AM of the stellar component (blue) estimated within one effective radius. We also plot the angle between the BH spin and the AM of the gas accretion disk (green) as well as the angle between the stellar and the accreted gas component (red); 7) The evolution of the polar angle θ describing the orientation of the BH spin (blue), the stellar (red) and gas accretion disk (green) angular momenta relative to a fixed reference frame of the simulation. |
| In the text | |
Current usage metrics show cumulative count of Article Views (full-text article views including HTML views, PDF and ePub downloads, according to the available data) and Abstracts Views on Vision4Press platform.
Data correspond to usage on the plateform after 2015. The current usage metrics is available 48-96 hours after online publication and is updated daily on week days.
Initial download of the metrics may take a while.