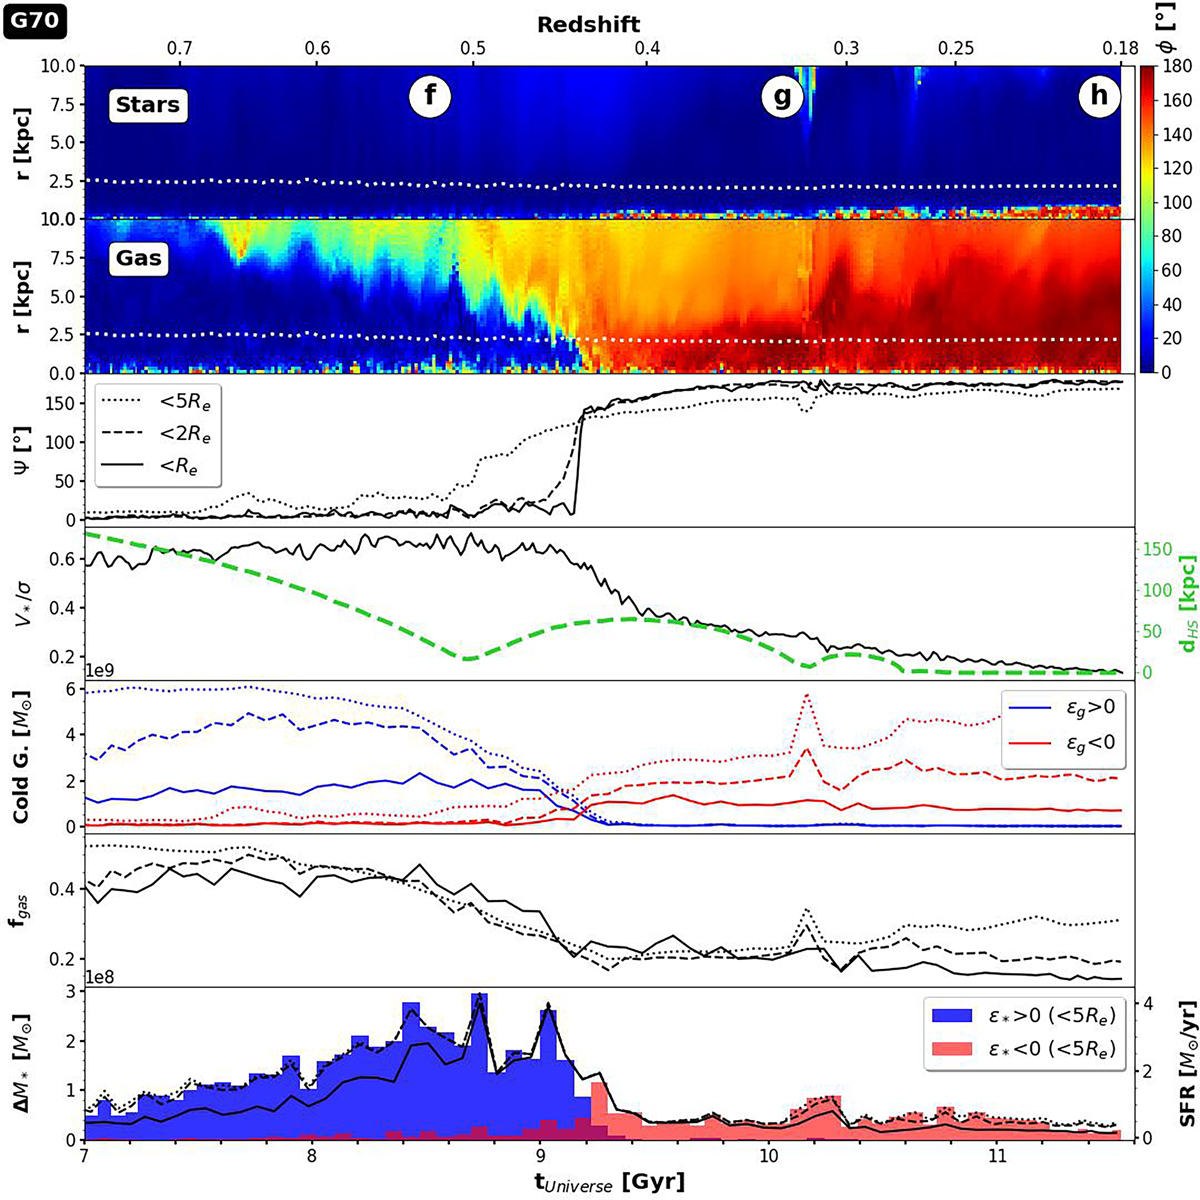
Fig. A.1.
Download original image
Same as Fig. 4 but we have added here in the fourth row the time evolution of the distance (dHS)between the host (G70) and the satellite galaxy. This shows clearly the different passages at the pericentric distance and the time of the final plunge (TUniverse∼10.6 Gyr). Here again, we choose the z-axis of the cylindrical coordinate as the total AM vector direction of the stellar component estimated within one effective radius.
Current usage metrics show cumulative count of Article Views (full-text article views including HTML views, PDF and ePub downloads, according to the available data) and Abstracts Views on Vision4Press platform.
Data correspond to usage on the plateform after 2015. The current usage metrics is available 48-96 hours after online publication and is updated daily on week days.
Initial download of the metrics may take a while.