| Issue |
A&A
Volume 695, March 2025
|
|
|---|---|---|
| Article Number | A218 | |
| Number of page(s) | 11 | |
| Section | Extragalactic astronomy | |
| DOI | https://doi.org/10.1051/0004-6361/202452209 | |
| Published online | 20 March 2025 | |
The assembly of the most rotationally supported disc galaxies in the TNG100 simulations
1
Instituto de Astronomía Teórica y Experimental, UNC-CONICET, Córdoba X5000BGR, Argentina
2
Department of Physics and Astronomy, University of California, Riverside, CA 92521, USA
3
Observatorio Astronómico de Córdoba, Universidad Nacional de Córdoba, X5000BGR, Argentina
⋆ Corresponding author; This email address is being protected from spambots. You need JavaScript enabled to view it.
Received:
11
September
2024
Accepted:
30
January
2025
Abstract
Context. Disc-dominated galaxies can be difficult to accommodate in a hierarchical formation scenario such as Λ cold dark matter (ΛCDM), where mergers are an important growth mechanism. However, observational evidence indicates that these galaxies are common in the Universe.
Aims. We seek to characterise the conditions that lead to the formation of disc-dominated galaxies within ΛCDM.
Methods. We used dynamical decomposition of the stellar particles in all galaxies with stellar mass M∗ = [1010 − 1011] M⊙ within the cosmological hydrodynamical simulation Illustris TNG100. We selected a sample of 43 mostly-disc galaxies that have less than ∼10% of their mass in a bulge component. For comparison, we also studied two additional stellar-mass matched samples: 43 intermediate galaxies having ∼30% of their stellar mass in the bulge and 43 with a purely spheroidal-like morphology.
Results. We find that the selection purely based on stellar dynamics is able to reproduce the expected stellar population trends of different morphological types, with higher star-formation rates and younger stars in disc-dominated galaxies. Halo spin seems to play no role in the morphology of the galaxies, in agreement with previous works. At a fixed M*, our mostly-disc and intermediate samples form in dark matter haloes that are two to ten times less massive than the spheroidal sample, highlighting a higher efficiency in disc galaxies to retain and condensate their baryons. On average, mergers are less prevalent in the buildup of discs than in spheroidal galaxies, but there is a large scatter, including the existence of mostly-disc galaxies, with 15%–30% of their stars coming from accreted origin. Discs start to form early on, settling their low vertical velocity dispersion as early as 9–10 Gyr ago, although the dominance of the disc over the spheroid was established more recently (3–4 Gyr lookback time). The most rotationally supported discs form in haloes with the lowest virial mass in the sample and the best aligned distribution of angular momentum in the gas.
Key words: galaxies: evolution / galaxies: interactions / galaxies: star formation
© The Authors 2025
 Open Access article, published by EDP Sciences, under the terms of the Creative Commons Attribution License (https://creativecommons.org/licenses/by/4.0), which permits unrestricted use, distribution, and reproduction in any medium, provided the original work is properly cited.
This article is published in open access under the Subscribe to Open model. This email address is being protected from spambots. You need JavaScript enabled to view it. to support open access publication.
1. Introduction
In a hierarchical formation scenario such as the Λ cold dark matter (ΛCDM) cosmological model, where structures form from the bottom up and grow mainly via mergers (White & Rees 1978; Peebles 1982; Blumenthal et al. 1984; Davis et al. 1985; Kauffmann et al. 1993; Cole et al. 2008; Fakhouri & Ma 2008; Neistein & Dekel 2008), a high prevalence of pure-disc galaxies is unexpected. However, in the Local Volume, a third to half of the giant galaxies are reported to have no bulges, at least in their classical definition (Kautsch et al. 2006; Kormendy & Fisher 2008; Kormendy et al. 2010), and they seem to mostly be supported by stars on circular orbits (Peebles 2020). More representative galaxy samples covering larger volumes also show axis ratios consistent with the presence of razor-thin discs in sky-wide surveys such as GAMA, SDSS, and SAMI (Haslbauer et al. 2022). How galactic discs can retain their orderly rotation amidst the intrinsically chaotic assembly of mass in ΛCDM remains an interesting question.
The existence of velocity-dispersion supported systems, such as galaxy bulges, are comparatively much easier to accommodate within the cosmological assembly of galaxies. For example, mergers have been identified as one of the main formation and growth mechanisms of bulges (Toomre 1977; Walker et al. 1996; Hopkins et al. 2012; Martig et al. 2012). Additionally, gravitational instabilities (Noguchi 1999; Elmegreen et al. 2004) or the accretion of gas onto misaligned orbits (Scannapieco et al. 2009; Sales et al. 2012) may also lead to the growth of spheroidal components. Although a high gas fraction (Noguchi 1999; Elmegreen et al. 2004; Hopkins et al. 2009) or well-defined co-planar orbits may help preserve or even grow the disc in galaxies (Abadi et al. 2003; Di Cintio et al. 2019), the factors naïvely expected to pull the orbits of stars away from circular motion seem by far too abundant in ΛCDM to easily accommodate the large number of disc-dominated galaxies observed. In fact, several authors have pointed out that theoretical expectations for the fraction of stellar mass in discs of simulated galaxies is too low compared to the observed galaxy population (e.g. Stewart et al. 2008; Kormendy et al. 2010; Peebles 2020; Haslbauer et al. 2022).
The task of comparing observational results to the morphology predicted in galaxy formation models within ΛCDM should not be taken lightly, as the effects of numerical resolution and simplified assumptions in the treatment of baryons on the final structure of simulated galaxies are not yet fully understood. For example, Benítez-Llambay et al. (2018) argues that the disc thickness depends on both the sound speed and ability to resolve gravity well (among other factors), which might change with resolution, mass of the galaxy, and (most importantly) the baryonic treatment chosen for the simulation. Uncertainties in the modelling of stellar feedback have also been shown to directly affect the morphology of stellar and gas discs (Sales et al. 2010; Scannapieco et al. 2012; Agertz & Kravtsov 2016). In addition, modelling of dust is crude to non-existent in the currently available simulations, but it can strongly impact measures of morphology by changing the light distribution in the inner regions.
In view of these challenges, we steer away from the question of whether current simulations form enough discs – which has been addressed in some of the papers mentioned above – and instead choose to focus on the mechanisms that give rise to the formation of the most rotationally supported discs within a large cosmological simulation. We refer to them as our mostly-disc galaxies, with less than ∼10% of their mass within a bulge-like component. To provide context, we selected two control samples with the same number and stellar mass distribution as our mostly-discs galaxies: an intermediate morphology sample with a larger contribution of a bulge (∼30%) and a spheroidal galaxy sample (no discs). We note that the mostly-disc and intermediate samples are both dominated in mass by the disc component, and we might refer to them collectively with ‘disc-dominated’ when necessary. Our paper is organised as follows. In Sect. 2, we introduce our simulated sample. In Sects. 3 and 4, we explore the formation and assembly histories of those galaxies. In Sect. 5, we study the formation and time evolution of the discs. We summarise our main findings in Sect. 6.
2. Galaxy selection
We use data from the Illustris TNG100 hydrodynamical simulation (Marinacci et al. 2018; Springel et al. 2018; Pillepich et al. 2018; Naiman et al. 2018; Nelson et al. 2018, 2019). This simulation has a comoving box size of 75 000 kpc h−1, with 18203 dark matter particles. The average mass of the gas particles is 1.4 × 10⁶ M⊙, while the mass of the dark matter particle is 7.5 × 10⁶ M⊙. The simulation uses cosmological parameters consistent with Planck 2015 cosmology (Planck Collaboration XIII 2016), including Ωm = 0.3089 and ΩΛ = 0.6911. The baryonic treatment takes into account the main processes that are involved in the formation of galaxies, including a prescription for heating and cooling of the gas, formation of stars and their evolution, metal enrichment, and feedback from stars and black holes.
From this simulation, we selected central galaxies (the central galaxy has a larger number of bound particles and cells in the halo, which usually makes it the most massive galaxy) identified by SUBFIND (Springel et al. 2001; Dolag et al. 2009) with stellar masses M⋆ ≥ 1010 M⊙ in the snapshot that corresponds to redshift z = 0. We measured the stellar and gas mass (Mgas) within three times the stellar half-mass radius (calculated by SUBFIND) at every snapshot. All of our galaxies are resolved with 7000+ stellar particles, allowing for a robust quantification of their structure. Virial quantities such as virial mass, M200, and virial radius, r200, are defined at the radius that encloses 200 times the critical density of the universe.
We used dynamical decomposition to quantify the morphology of the galaxies in the simulated sample. The dynamical decomposition method is based on the technique introduced in Abadi et al. (2003) and has been expanded to better take care of the assignment of particles to bulge or disc components in the central regions (Cristiani et al. 2024). The method uses the distribution of circularities of the stars, ϵ, defined as the angular momentum perpendicular to the discs divided by the angular momentum of a circular orbit with the same energy. A value ϵ = 1 indicates a star particle orbiting with a circular orbit perfectly aligned with the disc, a value ϵ = −1 indicates a star particle orbiting in a circular counter-rotating orbit, and ϵ = 0 corresponds to a purely radial orbit.
Using the circularity distribution, the bulge or spheroid can be identified by mirroring the distribution of negative circularities, assumed by default to belong to the bulge, onto the positive ϵ axis to disentangle the bulge from disc particles1 (for details see Abadi et al. 2003). The mass associated with such an ϵ distribution is then considered to be the mass in the spheroid for each galaxy, Msph. We note that, by default, this technique identifies non-rotating bulges, as it forces the distribution of circularities to be symmetric around ϵ = 0. As such, the bulge definition is more aligned to the classical view of bulges as non-rotating and might not be well suited for rotating central components such as pseudobulges. Given the spatial resolution of the simulations, with a gravitational softening 740 pc, and the typical sizes of bulges ∼1–2 kpc, the inner structure of this component remains mostly unresolved in the simulated galaxies in any case, making a simplified criteria such as the symmetric distribution of ϵ a good choice to differentiate a spheroidal component from the more rotationally supported discs.
Figure 1 shows the spheroid-to-total stellar mass ratio (fsph) as a function of stellar mass for all central galaxies considered in the simulation (grey dots). We selected those with the least spheroidal component, fsph < 0.12, resulting in 43 mostly-disc galaxies (see blue symbols). This specific threshold is an arbitrary choice since the fsph distribution is continuous. We set the value such that the selected sample is sizeable in number, and this was done after visual confirmation that the criteria identify well-defined massive disc galaxies. We carefully selected two additional comparison samples that follow the same distribution of M⋆ (according to a Kolmogorov-Smirnov test) but show different morphologies.
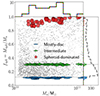 |
Fig. 1. Ratio between the mass of the spheroidal component and the total stellar mass (Msph/M⋆, which we refer as fsph hereafter) as a function of the stellar mass (M⋆). Grey dots show all the central galaxies with masses over 1010 M⊙ in TNG100. The blue ellipses highlight our population of mostly-disc galaxies, selected to have a negligible spheroidal component; the green ellipses with a circle in the middle indicate our intermediate sample with fsph value near the median of all the galaxies; and the red circles indicate the spheroid-dominated galaxies selected to have a negligible disc component at a given M⋆. The dotted black line indicates the cut used to select the disc-dominated sample. The distribution of M⋆ and fsph for the selected samples are also shown at the top and left of the panel, respectively (blue solid lines for the mostly-disc dominated sample, green dot-dashed lines for the intermediate sample, and dotted red lines for the spheroid-dominated sample). The distribution of fsph for all the central galaxies is also shown alongside the selected samples with a grey dashed line. The black dotted line in the fsph distribution indicates the median of fsph for all the galaxies. We use the same symbol, colour, and line-style convention as used in this figure to distinguish the different samples throughout all similar figures in the paper. |
First, we select 43 galaxies as the intermediate sample (green symbols), defined as objects with fsph ∼ 0.3. These intermediate galaxies still represent a population of disc-dominated objects, but they have a more substantial contribution of the spheroid to the total mass. For the second comparison sample, we chose a population of 43 spheroid-dominated galaxies, which were selected as those with the maximum fsph at a given M⋆. The limiting ranges of fsph in each of our samples are as follows: 0.09–0.12 (mostly-disc), 0.29–0.32 (intermediate), and 0.87–1.00 (spheroid-dominated). Our total sample contains 129 galaxies (43 in each subsample) in the mass range: log(M⋆/M⊙) = [10.17 − 11.11]. We explicitly checked that the incidence of low surface brightness galaxies (as defined by a surface brightness lower than 22 mag/arcsec2; Pérez-Montaño et al. 2022) in all of our subsamples is negligible, including our mostly-disc subset. We therefore consider our objects representative of normal disc- or spheroid-dominated galaxy types.
Figure 2 shows five examples of the galaxies included in our analysis. The top and middle rows correspond to the face-on and edge-on stellar projections (made using Py-SPHViewer, Benitez-Llambay 2015) and serve to illustrate the typical morphologies in our sample. Well-defined and regular discs are common in our mostly-disc subsample (three leftmost columns), while the disc becomes weaker (second from right column) to not present (right column) for our intermediate and spheroid-dominated samples, respectively. Visual inspection of these images also suggests the presence of oblate structures reminiscent of bars in some of our galaxies. Rigorous identification of bars in simulated galaxies is complex, and we refer the reader to several works exploring this using TNG galaxies (e.g. Rosas-Guevara et al. 2020; Zhao et al. 2020; Izquierdo-Villalba et al. 2022). Nonetheless, by eye we find a larger incidence of bars in the intermediate sample than in the mostly-disc one. We defer a more rigorous analysis of bars and their dynamical imprint to future work.
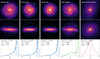 |
Fig. 2. Stellar mass density maps for galaxies with different morphologies in our samples (quoted in top panels). The top and middle rows correspond to face-on and edge-on views, with a green circle showing the galaxy radius, defined here as three times the half mass radius of the stars. The size of each box is 50 kpc across. The bottom panels show, for each galaxy, the distribution of orbital circularities (ϵ) of the stars along with stellar mass in units of log(M⊙), the stellar half-mass radius (r1/2) in units of kiloparsecs, and the fsph value. The vertical lines with the corresponding colours indicate the median ϵ value for each galaxy. Galaxies in our mostly-disc sample have well-defined discs, with a narrow distribution of ϵ close to one, and a negligible contribution, with ϵ ∼ 0 being typical of spheroid-like components. |
The different morphologies of these example galaxies can also be clearly seen in the circularity distributions shown in the bottom row of Fig. 2. The spheroid-dominated galaxy has a circularity distribution peaking around ϵ = 0 and shows no evidence of stars with large circularities, ϵ > 0.7, which are typically associated with a disc component. For the intermediate and mostly-disc examples, most of the mass (or area under the curve) is on orbits with a high circularity, with the difference between these two types being the prominence of the ‘bump’ around ϵ = 0, which is associated with a bulge or spheroidal component. Encouragingly, some of our best examples in the mostly-disc subsample (see two leftmost panels in Fig. 2) show narrowly peaked distributions around ϵ ≥ 0.9 and only a negligible fraction of particles with low ϵ, which could be interpreted as an indication that almost pure-disc galaxies can form in a ΛCDM scenario.
To further characterise the morphology of our sample, we show in Fig. 3 the distribution of the median circularity  of the stellar orbits in each simulated galaxy for our subsamples: mostly-discs (blue), intermediate (green), and spheroid-dominated (red). All spheroid-dominated objects have
  , which is consistent with being dispersion-dominated galaxies. The intermediate population typically has
  , and this is consistent with a double-peaked distribution of mass into a low-ϵ component and a disc, as can be seen in the intermediate example in Fig 2. Galaxies labelled as mostly-discs have
  , which highlights the very large dominance of the disc as a morphological feature. Peebles (2020) correctly points out that ϵ ≥ 0.7, often used to define the disc component, may actually be too generous to describe observed pure-disc galaxies. However, for our specific sample, the baryonic treatment in TNG100 inherently pressurises the interstellar medium of gas at densities eligible for star formation, as it is responsible for considerable ‘thickening’ of the vertical structure of the discs. From that perspective, the relatively high
  found in our mostly-disc galaxy sample is reassuring and suggests that these objects may be used to shed light on the mechanisms able to build pure-disc galaxies within the cosmological scenario.
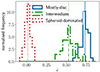 |
Fig. 3. Distribution of the median value of the circularity parameter ( |


3. Assembly of stars, gas, and dark matter in galaxies with different morphologies
We examine in Fig. 4 the r-band luminosity profile (left) and specific star formation rate (sSFR) as a function of M⋆ (right) for galaxies selected in our sample. Both diagnostics serve to differentiate galaxies with different morphologies: Discs have exponential light profiles and actively form stars, while spheroidal galaxies (or components) have cuspier light distributions consistent with de Vaucouleurs profiles and form little to no stars. In our sample, we find that the median light profile is indeed different for the subsamples and consistent with the expectations mentioned above. Objects in the mostly-disc sample showed a flatter light distribution and a decreased inner concentration compared to the intermediate or spheroid-dominated galaxies. As mentioned above, a lack of spatial resolution in the simulation prevents us from making meaningful analysis of the profile slopes in the inner regions and thus determining whether they are more consistent with a classical bulge or a pseudobulge. But we note that the central profile in our mostly-disc sample is substantially less concentrated and hints at a different slope than the spheroid-dominated median, suggesting that the processes shaping the inner light distribution in the mostly-disc sample and the spheroid-dominated sample are not the same.
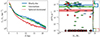 |
Fig. 4. Luminosity profile as a function of projected radius (left) and sSFR as a function of stellar mass (right) for the galaxies in our samples. The thick lines indicate the median of each sample, and shaded regions are the error on the median calculated from 500 bootstrap resampling of the data. We use the same method to calculate errors through the entire paper. Our kinematics-based selection criteria reproduce the expected traits from the different morphologies, such as quiescence and steep luminosity profiles in spheroid-dominated objects versus active star formation and shallower luminosity profiles in disc-dominated samples. |
The right panel in Fig. 4 shows that, consistent with expectations, mostly-disc and intermediate galaxies are star forming, while the majority of spheroids are quiescent at z = 0 (assuming galaxies with sSFR < 10−11 M⊙ yr−1 are quenched, Wetzel et al. 2013). The median sSFR of the combined subsamples (horizontal lines) also follow expectations: Mostly-disc galaxies have a higher sSFR than intermediate galaxies, and spheroids show the lowest values. While this average differentiation between a star-forming state and quiescence might have been expected based on our morphology selection, it is not a trivial exercise. Galaxies were selected based only on a dynamical criteria for the orbital structure of stellar particles, yet they are able to reproduce star-formation observables linked to gas properties, such as the star formation main sequence. This highlights a clear success of this simulation and, more generally, of several current galaxy formation models that are able to reproduce a wide range of morphologies (e.g. Vogelsberger et al. 2014; Schaye et al. 2015; Dubois et al. 2016).
Finally, we also note that there is an interesting overlap in the right panel of Fig. 4 between a few individual objects of different subsamples given by the large scatter in sSFR for a given galaxy type. For example, some low-mass spheroid-dominated galaxies are forming stars at rates comparable to the mostly-disc objects. Similarly, there are several mostly-disc and intermediate galaxies that are below the quenching threshold.
Undoubtedly, the angular momentum of the gas and stars play a key role in determining the morphology of galaxies (Fall 1983; Romanowsky & Fall 2012). Typically, galaxies supported by rotation show a factor of around three to four more angular momentum in their stellar component than their counterparts supported by dispersion. This difference arises in part as disc galaxies seem able to retain most of the angular momentum from their host dark matter halo, while spheroid-dominated systems are able to capture only ∼30% of their host halo angular momentum on average (Genel et al. 2015). In the case of our samples, the specific angular momentum of the stars in the spheroid-dominated sample is ten to 500 times lower than the disc-dominated samples at a given stellar mass.
It is therefore interesting to explore the direct link between the stellar morphology with properties of their dark matter halo. Next, we compared the halo spin parameter λ of galaxies with different morphologies. Figure 5 shows that the distributions of halo spin for our mostly-disc (blue), intermediate (green), and spheroid-dominated (red) galaxies are indistinguishable from each other, reinforcing the idea that the halo spin is a poor predictor of morphology in the scale of Milky Way-like galaxies (Sales et al. 2012; Garrison-Kimmel et al. 2018; Rodriguez-Gomez et al. 2017). We confirmed this statistically with a Kolmogorov-Smirnov test showing that the probability that the λ values come from the same underlying distribution is very high, with a lower p-value (for all the possible combinations) of 0.63. We note that this is not the case for lower mass dwarfs, where discy morphologies are linked to the higher halo spins (Rodriguez-Gomez et al. 2017; Benavides et al. 2023). A possible interpretation for this behaviour is that, at the scale of Milky Way-like galaxies, morphology correlates with the spin in the inner regions of haloes and not with that of the total halo as quantified by the λ parameter (e.g. Zavala et al. 2016; Rodriguez-Gomez et al. 2022).
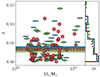 |
Fig. 5. Halo spin, λ, as a function of stellar mass. The galaxies in all subsamples overlap in median (horizontal lines) and dispersion (symbols show individual objects in each sample), confirming that halo spin is not correlated with the morphology of the central galaxy in this mass range. |
We did, however, find a difference in the halo masses of galaxies with different morphologies. The left panel in Fig. 6 shows the stellar mass–halo mass relation for objects in our sample along with the empirical fit from Moster et al. (2018), shown as a dashed line for guidance. We used the same parametrisation as in Moster et al. (2018, Eq. (5)) to calculate an analytic relation for each of our samples. This equation (modified to calculate M⋆ as a function of M200, instead of baryons fraction as a function of M200, as it appear in Moster et al. 2018) is given by
![Mathematical equation: $$ \begin{aligned} M_{\star } = 2 M_{200} f_b \epsilon _N \left[ \left( \frac{M_{200}}{M_1} \right)^{-\beta }+\left(\frac{M_{200}}{M_1}\right)^{\gamma }\right]^{-1}, \end{aligned} $$](/articles/aa/full_html/2025/03/aa52209-24/aa52209-24-eq9.gif) (1)
(1)
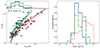 |
Fig. 6. Left: Stellar mass–halo mass relation for the galaxies in our samples. For comparison, we show the empirical fit by Moster et al. (2018) with a dashed black line along with individual fits of such a relation to each of our samples (solid blue, dot-dashed green, and dotted red for mostly-discs, intermediate, and spheroidals, respectively). There is a clear morphological trend in the relation, with disc-dominated objects populating haloes with two to ten times lower mass than spheroid-dominated objects at the same M⋆. Similarly, at fixed M200, disc-dominated galaxies form more stars than spheroids. Right: Distribution of the median stellar age of the galaxies in each subsample. We found a systematic trend with morphology where the disc-dominated samples are on average younger than the spheroid-dominated galaxies. |
where fb = 0.156 and the other variables are fit parameters. Table 1 shows the fit values for this parameter for each sample. There is a clear trend in the distribution of galaxies, with mostly-discs systematically having lower mass haloes compared to spheroid-dominated objects with the same M⋆. Intermediate galaxies fall in between. The trend is smaller for our lower M⋆ objects, but they can reach halo masses five to ten times larger in the case of spheroid-dominated galaxies than mostly-discs for the brighter galaxies in our sample. Galaxies selected to have the same luminosity or stellar mass distribution (as in our case) may therefore greatly differ in the type of haloes they are sampling. This theoretical prediction is supported by several observational results suggesting more massive haloes around red, quiescent or spheroid-dominated galaxies at a given M* including the number of satellites (e.g. Wang & White 2012), gravitational lensing studies (Mandelbaum et al. 2016), and dynamical studies of HI or the globular cluster system (Posti et al. 2019; Posti & Fall 2021). In simulations, Wang & Peng (2024) found a similar relation, but they separated galaxies according to star formation rate rather than using a dynamical method.
Alternatively, the results in the left panel of Fig. 6 can be interpreted as showing the haloes of discy galaxies being more efficient at accumulating stars than the haloes of spheroidal systems at a given halo mass. This view is partially supported by the previous discussion on the right panel of Fig. 4: The mostly-disc galaxies continue to form stars actively until today, whereas the majority of spheroid-dominated objects are quiescent. This is better shown by the median stellar ages of the galaxies in our samples, which is shown in the right-hand plot of Fig. 6. The median stellar ages are ⟨age⟩ = 6.6 ± 0.2 Gyrs, 7.3 ± 0.5 Gyrs, and 9.5 ± 0.4 Gyrs for the mostly-disc, intermediate, and spheroid-dominated galaxies, respectively, showing that spheroids tend to stop their buildup of new stars early on.
We explore this in more detail in Fig. 7, where we show the median assembly history of the halo mass (left), stars (second left), and gas (second right) for each of our subsamples alongside the sSFR evolution (right). Curves pertaining to mass have been normalised to their final value at z = 0 for each galaxy type in the case of halo mass and stars and to the stellar mass at z = 0 for the case of the gas (in which case, the values shown are indicative of gas fraction compared to stellar mass content today more than net gas mass at each time). The right panel shows the evolution of sSFR not normalised. The left panel indicates that the total virial mass grows, on median, similarly for all galaxies regardless of their morphology, in particular for the late evolution.
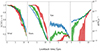 |
Fig. 7. Assembly history for the virial mass (left), stellar mass (second left), and gas (third left) components along with the median sSFR evolution (rightmost panel). Virial and stellar masses are normalised to their values at z = 0, while the gas component is normalised to the stellar mass at z = 0 for each subsample. The values of sSFR are not normalised (right margin). It is important to notice that the scale is different among the panels, with the three leftmost using the linear scale at the left and the rightmost using the logarithmic scale at the right. Haloes grow at a similar pace between the samples, but stars and gas show clear differences. Spheroid-dominated galaxies assemble their stars and consume their gas at earlier times than disc-dominated objects. Our mostly-disc sample shows steady star formation over time, maintaining a richer gas supply and a more sustained star formation rate over time than the intermediate and spheroid-dominated sample. |
The stellar mass behaves differently, with mostly-disc galaxies forming their stars substantially later than spheroids, and galaxies with intermediate morphology falling in between. Spheroid-dominated objects have formed or assembled stars in negligible numbers in the past ∼5 Gyrs, which together with the similar evolution of the halo mass shown in the left panel helps explain their relative low stellar content compared to the halo mass shown in Fig. 6. The gas evolution helps confirm this picture. Mostly-disc objects have sustained a healthy amount of gas over time – about half that of their present-day stellar content – in the past ∼8 Gyr, while those destined to be spheroidals have only decreased their relative gas content since that time. Our intermediate morphology sample shows a behaviour somewhere in between, with some speed-up in relative gas loss in the past 4 Gyrs compared to the mostly-disc sample. Mostly-discs galaxies require a healthy gas reservoir such as that to sustain an effective buildup of stars that can place objects above the average stellar mass–halo mass relation.
We investigate where the star formation occurs for the different samples in Fig. 8, where we show the (median) time evolution of the sSFR divided across the inner and outer regions of our galaxies. We use r1/2 as the limit to divide between the inner (r < r1/2) and outer (1 < r/r1/2 < 3) parts. In the case of the intermediate and spheroid-dominated sample, we found no significant difference in the star formation of inner and outer regions. On the other hand, our mostly-disc galaxies seem to form stars at slightly higher rates in the outer disc than in the inner central regions in a way that is reminiscent of what has been found for low-surface brightness galaxies (Di Cintio et al. 2019; Pérez-Montaño et al. 2022).
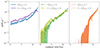 |
Fig. 8. Median values of the evolution of the inner and outer sSFR defined as taking place within or outside r1/2, respectively. The left panel is for the mostly-disc sample, the middle panel is for the intermediate sample, and the right panel is for the spheroid-dominated sample. We note that for the mostly-disc sample, the sSFR tends to be higher in the outer parts compared to the central regions of the galaxy. |
4. The role of mergers
The relation between mergers and the resulting morphology is complex, often depending on the mass ratio of the merger, the orientation, and gas content, as discussed in Sect. 1. Here, we use the history of the main progenitors of our sample in addition to the stellar assembly catalogues (Rodriguez-Gomez et al. 2015, 2016, 2017) provided in the Illustris-TNG database to quantify the contribution of mergers to the stellar mass buildup of galaxies with different morphologies.
Figure 9 shows that at a fixed stellar mass for the galaxy, the fraction of the stellar mass at z = 0 that is of accreted origin is typically larger for spheroid-dominated galaxies than for our mostly-disc sample and intermediate galaxies. This follows traditional expectations of mergers building up dispersion-dominated components (Toomre 1977; Walker et al. 1996; Hopkins et al. 2012; Martig et al. 2012). The difference is substantial, with spheroids having, on median, ∼30% of their stellar mass brought in by mergers, whereas it is ∼12% for the intermediate morphology and only ∼5% of accreted stellar mass for our most rotationally supported discs.
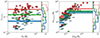 |
Fig. 9. Fraction of the stellar mass from accreted origin as a function of stellar mass (left) and amount of stellar mass accreted as a function of virial halo mass (right) for our samples. We show the medians calculated in three different M200 ranges, (< 8 × 10¹¹), (8 × 10¹¹ − 1.5 × 10¹²), and (> 1.5 × 10¹² M⊙), chosen to include a fair number of galaxies in each bin. In general, spheroid-dominated objects have a larger contribution from accreted stars, but the overlap between the samples is substantial. We highlight the presence of mostly-disc and intermediate galaxies with a large accreted mass MMergers > 1010 M⊙ as well as the presence of three spheroid-dominated galaxies with less than 3% of their mass from accretion. |
Two factors contribute to differentiating the accreted stellar mass fractions of spheroids and discs. First, the availability of gas to fuel in situ star formation for longer times in the disc-dominated samples helps decrease the fraction of accreted stars by continuously building the in situ component, a process that is suppressed at later times in the spheroid-dominated sample. Second, the bias towards larger virial halo masses in the spheroid-dominated galaxies means that encounters with more massive satellites that are able to contribute larger amounts of stellar mass are more likely than in the disc-dominated samples. This is more clearly shown in the right panel of Fig. 9, where we show the total stellar mass of accreted origin as a function of M200 instead of stellar mass. Once normalised to virial mass, the spheroid-dominated galaxies contain, on median, only a factor of about two more accreted mass than both disc-dominated samples, and there is appreciable overlap of the samples.
In general, while the median trend indicates more prevalence of mergers in spheroid-dominated galaxies, which is consistent with the fact that these galaxies tend to reside in more dense environments (Mo et al. 1992; Zehavi et al. 2011), there is a large scatter making the fraction of accreted mass or the total stellar mass accreted a poor predictor of morphology. For instance, there are three spheroid-dominated objects with M⋆ ∼ 2 × 10¹⁰ M⊙ in our sample with only ∼2.5% of their stellar mass of accreted origin, meaning that mergers had a negligible contribution to their dispersion-dominated structure (see also Sales et al. 2012). There is also a large degree of overlap between our mostly-disc and intermediate samples, suggesting that the processes leading to the formation of a sub-dominant bulge in mass are more complex than what can be captured by the two simple merger statistics shown in Fig. 9.
Interestingly, several of our mostly-disc objects (blue) trace the upper end of the accreted mass at a given M200, thereby coexisting with the spheroid-dominated objects. In particular, three out of the five mostly-disc galaxies with M200 ≥ 1.5 × 10¹² M⊙ have accreted M⋆ ≥ 1010 M⊙ and still retain their extreme discy kinematics. A closer inspection of some of the mostly-disc galaxies with a large fraction of accreted masses revealed that the accreted stars show a wide distribution of circularities today. As expected, these sometimes contribute to the ‘bump’ at ϵ ∼ 0. In other cases, however, the accreted stars show intermediate circularities that are more reminiscent of a thick disc with ϵ ∼ 0.5 (Abadi et al. 2003). In the literature, simulated low surface brightness galaxies have been found to retain their extended discs after significant accretion of ex situ formed stars (Kulier et al. 2020). In our sample, we find that for our mostly-disc galaxies showing substantial stellar accretion, what allows them to retain their mostly-disc morphology is a strong in situ component where most of the stars are in nearly circular orbits. This also emphasises the relevance of the additional efficiency in transforming gas into stars given their halo mass, as discussed in Fig. 6.
We also explored the timings of the mergers, and we found interesting differences between the samples. Figure 10 quantifies the number of mergers at a given time and with a given stellar mass ratio, μ, for each of our subsamples. To calculate this value, we used the main progenitor evolution after z = 4 and measured the relative mass of each merger event, μ, as the stellar mass ratio of the galaxies involved in the merger. For the main progenitor of our galaxies, we used their instantaneous stellar mass at the time of the merger. For the companion or merging galaxy, we followed the convention in Rodriguez-Gomez et al. (2015) and used their maximum mass prior to the merger to account for numerical and tidal stripping effects in μ.
 |
Fig. 10. Distribution of the time (x-axis) and stellar mass ratio (μ, y-axis) of the mergers for galaxies in each subsample: mostly-disc (left), intermediate (middle), and spheroid-dominated (right). Merger patterns are different across the galaxy types. The mostly-disc objects avoid mergers in the past ∼4 Gyrs. Merging also seems common for spheroid-dominated galaxies at very early times (≥9 Gyr ago). |
The colour code in Fig. 10 shows that mostly-disc galaxies have a peak in merger activity 5–10 Gyr ago, and the typical stellar mass ratio is 1:100 (μ ∼ 10−2). For intermediate morphology galaxies, the mergers seem more recent, t < 5 Gyr ago, and the mass ratio is typically larger than in our mostly-disc sample, with values in the range μ = [10−2 − 10−1]. On the other hand, spheroid-dominated objects result from a more evenly distributed set of mergers in time, although early (t > 10 Gyr) and recent (t ∼ 1 Gyr) events seem common. The mass ratios involved in the spheroid-dominated sample are typically smaller than in the case of the disc-dominated subsamples, with μ ≤ 10−2 being the most typical. This highlights a clear prevalence of minor mergers over major mergers in the buildup of our dispersion-dominated sample of spheroidal galaxies in our sample.
5. The settling and formation of the disc
In this section, we turn our attention to the time evolution of the structure in our samples. Figure 11 shows the (left) stellar half-mass radius r1/2 and (right) the stellar velocity dispersion in the z-direction at that radius σz(r1/2) as a function of time. As expected, the discs are more extended today and have less vertical velocity dispersion than the spheroids. The typical stellar half-mass radius in our mostly-disc galaxies is ∼6.5 kpc, which is substantially more extended than the Milky Way and similar galaxies, and the typical vertical velocity dispersion at that radius is σz ∼ 50 km/s. In comparison, the intermediate morphology and spheroidal samples show a more compact (r1/2 ∼ 4.5 and ∼3.5 kpc, respectively) and dynamically hotter, σz(r1/2)∼75 and ∼100 km/s, stellar distribution today.
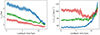 |
Fig. 11. Structural evolution of the galaxies in our sample. We show the median stellar half-mass radius, r1/2, as a function of time on the left and the vertical stellar velocity dispersion measured at r1/2 as a function of time on the right. The disc-dominated objects are more extended at all times compared to the spheroid sample. The velocity dispersions of the subsamples show similar values before 10 Gyr ago, but they appear to have settled relatively quickly into their final present-day values around 8 − 9 Gyr ago, showing little evolution afterwards. |
In terms of sizes, Fig. 11 suggests that the samples have mostly evolved parallel to each other, with the mostly-disc sample being larger than other galaxy types at all times, except perhaps for the very early evolution more than 10 Gyr ago, when the mostly-disc and intermediate samples seem to be indistinguishable from each other (see also Martin et al. 2019; Pérez-Montaño et al. 2022; Ma et al. 2024). Spheroid-dominated objects are always more compact than the galaxies destined to be disc dominated. All galaxy types grow by factors of 1.3 − 2 in size in the past 10 Gyr. The mostly-disc galaxies show a steep size increase at intermediate times, 6–10 Gyr ago, after which the size increase proceeds at a slower pace that is more similar to the other subsamples. The right panel of Fig. 11 reveals an interesting behaviour: All galaxy types show similar σz at early times, but they started to differentiate 10 Gyr ago, when the vertical velocity dispersion of the mostly-disc and the intermediate samples started to decrease as a result of disc formation. Remarkably, the average σz of the mostly-disc objects reaches its present-day value of σz = 52 km/s very early on, thus staying relatively constant over the past ∼9 Gyr.
To better identify the formation time of individual discs, we looked into the orbital structure of the stars of today in our simulated galaxies and determined the stellar age at which stars began to form as consistently aligned and in circular orbits. The left panel of Fig. 12 shows an illustration of the procedure. We started with the circularity ϵ as a function of stellar age in the main panel for all the stars in one of our mostly-disc galaxies. For the older stars, there is a wide range of ϵ that becomes increasingly more concentrated towards ϵ ∼ 1, corresponding to circular orbits, for younger stars. The black curve shows the median as a function of stellar age, smoothed using the moving average method with dt = 4.2 Gyr (Fig. 5 in Chandra et al. 2024, shows a similar analysis but using [Fe/H] instead of the stellar age). Next, we calculated the time derivative of this median (bottom-left panel), and we calculated the mean and dispersion at those times using all the values of dϵ/dt that correspond to a given age or younger. Lastly, we measured the first time that the value of dϵ/dt is smaller than the aforementioned mean minus n times the dispersion. We call this time Tc, and it refers to the time of consistent alignment in the stars. After visual inspection of several examples, we found that a value of n = 2 is suitable for our objectives. In other words, Tc is the smallest value that complies with
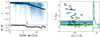 |
Fig. 12. Formation (lookback) time of the discs in our sample. The left panel shows an example of our definition based on the circularity parameter as a function of the stellar age of all stellar particles in a given galaxy (blue dots). We calculated the running median (black symbols) and their derivative (bottom panel) to find the time when the dominant and consistent formation of stars in circular orbits occurs, Tc. We note that by definition, Tc is in lookback time units where Tc = 0 means today. In the right panel we show Tc for all disc-dominated galaxies as a function of their virial mass at the time of Tc (individual symbols). The median value shows that mostly-disc objects settle into circular orbits slightly earlier than for the intermediate objects, but the scatter is large. Galaxies typically reach Tc late and when their host halo mass is larger than M200 ∼ 3 × 10¹¹ M⊙ (with one exception). Some of the oldest discs have been consistently forming stars since ∼10 Gyr ago. |
 (2)
(2)
where M(dϵ/dt, Tc) is the average value up to Tc and S(dϵ/dt, Tc) is the dispersion up to Tc.
To gain a general sense of what Tc measures, we can also consider the median circularity of the stellar orbits measured at Tc. For the specific case shown in the left panel of Fig. 12, we find ϵ(Tc) = 0.87. More generally, we find the median of ϵ(Tc) is 0.81 ± 0.02 and 0.83 ± 0.02, for our mostly-disc and intermediate sample, highlighting the power of Tc to identify the formation time of discs dominated by circular orbits. We note that alternative measurements to the formation time of discs have been introduced in the literature before, including the ‘spin-up’ time, which is designed to capture the moment at which the thin-disc starts to form (Belokurov & Kravtsov 2022; Yu et al. 2023; Chandra et al. 2024). While our Tc is related to a certain degree to the spin-up time of discs, we favour Tc instead for our study as a more general property to characterise the buildup of rotationally supported discs in a wide range of masses and because it is not only focussed on Milky Way-like galaxies.
The right panel in Fig. 12 shows the distribution of Tc for both of our disc-dominated subsamples as a function of the virial mass of the haloes at that time2. On median, the stars in mostly-disc galaxies became consistently aligned 3.9 ± 0.7 Gyrs ago, with the intermediate sample showing slightly more recent values (2.9 ± 0.3 Gyr). However, there is a large dispersion in the samples, and several of the mostly-disc galaxies have Tc > 7 Gyr. Considering the many factors threatening disc survival in ΛCDM, it is remarkable that these objects manage to continuously build a disc for 7–10 Gyr. In general, stellar orbits seem to begin settling when the halo mass reaches M200 ≥ 3 × 10¹¹ M⊙, in agreement with several recent studies on disc formation (Yu et al. 2023; Chandra et al. 2024). Such a scale might be associated with the inception of a hot circumgalactic medium (e.g. Jahn et al. 2022) that facilitates the accretion of gas into the disc coherently aligned. The important role of hot accretion and coherence distribution of angular momentum for the buildup of discs was highlighted in Sales et al. (2012) and has been confirmed in other simulations and models (e.g. Übler et al. 2014; Di Cintio et al. 2019; Hafen et al. 2022; Yu et al. 2023; Stern et al. 2024; Semenov et al. 2024). We note that alignment with the angular momentum of the halo at larger scales has also been highlighted as promoting disc formation (e.g. Bullock et al. 2001; Pérez-Montaño et al. 2024).
We measured the alignment of gas at Tc for the different subsamples in Fig. 13. For each galaxy, we selected the data of the main progenitor from the snapshot closer to Tc (or at z = 0 for the spheroid-dominated sample and for the galaxies where we were unable to calculate Tc), and we calculated the angular momentum of the gas that is part of the host halo up to r200. We measured θa as the angle between the angular momentum of this gas and the angular momentum of the stars in the galaxy. Figure 13 shows the values of cos(θa) as a function of the ratio between the mass of the spheroidal component and the total galaxy mass fsph ( this is to avoid overlap in the samples). Disc-dominated galaxies in general show a better alignment than the spheroid-dominated objects, highlighting the importance of gas alignment in the buildup of discs. Even within the disc-dominated galaxies, those with a mostly-disc morphology at z = 0 show an even tighter alignment than the intermediate galaxies, agreeing with expectations that misaligned gas accretion may correlate with the formation and growth of spheroidal components (Scannapieco et al. 2009; Sales et al. 2012).
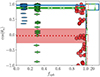 |
Fig. 13. Angle between the angular momentum of the gas in the halo and the stars in the galaxy, θa, as a function of the mass in the spheroidal component, fsph, for galaxies in our sample. We show this at Tc for both disc-dominated samples and use z = 0 for the spheroid-dominated galaxies. Mostly-disc galaxies show a remarkable coherently aligned gas angular momentum with respect to that of the stars already formed at Tc, with a median cos(θa)∼0.95 and a few less well-aligned objects. The intermediate sample shows a preference for strong co-rotation of the components (cos(θa) > 0.5), but the angle between the angular momentum of gas and stars can be larger, even including counter rotation for a few objects. The spheroid-dominated galaxies are here for comparison only and show a wide range of misalignment. |
6. Summary and conclusion
We have taken advantage of the large volume simulated within the Illustris TNG100 simulations to study the formation and evolution of the most rotationally supported galaxies within ΛCDM. Using dynamical decomposition to identify spheroid and disc components, we found a population of galaxies with a negligible (≤12%) mass of stars on spheroid-like orbits. Numerical limitations prevent us from assessing whether the small bulge component is consistent with a classical versus pseudobulge morphology. Nevertheless, the formation of such mostly-disc galaxies can cast some light on the processes necessary to form pure-disc spirals in the Universe and how they can exist within the cosmological scenario.
Mostly-disc morphologies arise as a combination of very efficient star formation given a halo mass, probably as a consequence of a stable and abundant supply of gas maintained during the past ∼10 Gyr, in addition to an earlier settling of the stellar orbits into circular or quasi-circular motions supported by a well-aligned distribution of angular momentum between the existing stars and the infalling gas. They also typically avoid mergers in the past ∼5 Gyr. At a given halo mass, disc-dominated galaxies are about two times more massive in stars than spheroidal-dominated objects with the same halo mass, placing discy morphologies preferentially above the expected abundance matching relation. On average, mergers play a more important role in the buildup of spheroid-dominated galaxies, but it is possible to find mostly-disc and intermediate morphology galaxies with equal or larger amounts of accreted stellar mass than spheroidals. Similarly, a few of our spheroid-dominated galaxies are formed with a negligible contribution from mergers.
Overall, we do not identify any ‘special’ mechanism that distinguishes the formation of our mostly-disc galaxies from the (still disc-dominated) intermediate morphologies. Instead, we find that the mostly-disc sample is always part of a continuous distribution with slightly more efficient star formation, more and better aligned gas supply, and earlier settling of the disc than objects with more massive bulge components. If an extrapolation of these results can be used to interpret the formation of bulgeless galaxies, one interesting question to be addressed is why such conditions would be met so easily in the Local Volume, where more than half of the large spirals show a negligible bulge component (Kormendy et al. 2010; Peebles 2020). Alternatively, a more dramatic interpretation is that our current understanding of ΛCDM in combination with galaxy formation models is still unable to properly predict the morphology of galaxies, and in particular, we lack the physical processes that enhance the rotational support of the stars, specifically in the central regions of galaxies.
An implementation of this and other dynamical decomposition methods is available at https://github.com/vcristiani/galaxy-chop
There are 11 galaxies for which the Tc condition is never met: one from the mostly-disc sample and ten with intermediate morphology. They are not included in Fig. 12.
Acknowledgments
SR, VC and MA acknowledge financial support from FONCYT through PICT 2019-1600 grant. LVS acknowledge financial support from NSF-CAREER-1945310 and NSF-AST-2107993 grants. The authors also would like to thank the anonymous referee for the detailed comments that helped improve this work.
References
- Abadi, M. G., Navarro, J. F., Steinmetz, M., & Eke, V. R. 2003, ApJ, 597, 21 [NASA ADS] [CrossRef] [Google Scholar]
- Agertz, O., & Kravtsov, A. V. 2016, ApJ, 824, 79 [NASA ADS] [CrossRef] [Google Scholar]
- Belokurov, V., & Kravtsov, A. 2022, MNRAS, 514, 689 [NASA ADS] [CrossRef] [Google Scholar]
- Benavides, J. A., Sales, L. V., Abadi, M. G., et al. 2023, MNRAS, 522, 1033 [NASA ADS] [CrossRef] [Google Scholar]
- Benitez-Llambay, A. 2015, https://doi.org/10.5281/zenodo.21703 [Google Scholar]
- Benítez-Llambay, A., Navarro, J. F., Frenk, C. S., & Ludlow, A. D. 2018, MNRAS, 473, 1019 [CrossRef] [Google Scholar]
- Blumenthal, G. R., Faber, S. M., Primack, J. R., & Rees, M. J. 1984, Nature, 311, 517 [Google Scholar]
- Bullock, J. S., Dekel, A., Kolatt, T. S., et al. 2001, ApJ, 555, 240 [NASA ADS] [CrossRef] [Google Scholar]
- Chandra, V., Semenov, V. A., Rix, H.-W., et al. 2024, ApJ, 972, 112 [Google Scholar]
- Cole, S., Helly, J., Frenk, C. S., & Parkinson, H. 2008, MNRAS, 383, 546 [Google Scholar]
- Cristiani, V. A., Abadi, M. G., Taverna, A., et al. 2024, A&A, 692, A63 [NASA ADS] [CrossRef] [EDP Sciences] [Google Scholar]
- Davis, M., Efstathiou, G., Frenk, C. S., & White, S. D. M. 1985, ApJ, 292, 371 [Google Scholar]
- Di Cintio, A., Brook, C. B., Macciò, A. V., Dutton, A. A., & Cardona-Barrero, S. 2019, MNRAS, 486, 2535 [NASA ADS] [CrossRef] [Google Scholar]
- Dolag, K., Borgani, S., Murante, G., & Springel, V. 2009, MNRAS, 399, 497 [Google Scholar]
- Dubois, Y., Peirani, S., Pichon, C., et al. 2016, MNRAS, 463, 3948 [Google Scholar]
- Elmegreen, D. M., Elmegreen, B. G., & Hirst, A. C. 2004, ApJ, 604, L21 [NASA ADS] [CrossRef] [Google Scholar]
- Fakhouri, O., & Ma, C.-P. 2008, MNRAS, 386, 577 [NASA ADS] [CrossRef] [Google Scholar]
- Fall, S. M. 1983, IAU Symp., 100, 391 [Google Scholar]
- Garrison-Kimmel, S., Hopkins, P. F., Wetzel, A., et al. 2018, MNRAS, 481, 4133 [NASA ADS] [CrossRef] [Google Scholar]
- Genel, S., Fall, S. M., Hernquist, L., et al. 2015, ApJ, 804, L40 [NASA ADS] [CrossRef] [Google Scholar]
- Hafen, Z., Stern, J., Bullock, J., et al. 2022, MNRAS, 514, 5056 [NASA ADS] [CrossRef] [Google Scholar]
- Haslbauer, M., Banik, I., Kroupa, P., Wittenburg, N., & Javanmardi, B. 2022, ApJ, 925, 183 [NASA ADS] [CrossRef] [Google Scholar]
- Hopkins, P. F., Cox, T. J., Younger, J. D., & Hernquist, L. 2009, ApJ, 691, 1168 [NASA ADS] [CrossRef] [Google Scholar]
- Hopkins, P. F., Kereš, D., Murray, N., Quataert, E., & Hernquist, L. 2012, MNRAS, 427, 968 [NASA ADS] [CrossRef] [Google Scholar]
- Izquierdo-Villalba, D., Bonoli, S., Rosas-Guevara, Y., et al. 2022, MNRAS, 514, 1006 [NASA ADS] [CrossRef] [Google Scholar]
- Jahn, E. D., Sales, L. V., Wetzel, A., et al. 2022, MNRAS, 513, 2673 [NASA ADS] [CrossRef] [Google Scholar]
- Kauffmann, G., White, S. D. M., & Guiderdoni, B. 1993, MNRAS, 264, 201 [Google Scholar]
- Kautsch, S. J., Grebel, E. K., Barazza, F. D., & Gallagher, J. S. I. 2006, A&A, 445, 765 [NASA ADS] [CrossRef] [EDP Sciences] [Google Scholar]
- Kormendy, J., Drory, N., Bender, R., & Cornell, M. E. 2010, ApJ, 723, 54 [Google Scholar]
- Kormendy, J., & Fisher, D. B. 2008, ASP Conf. Ser., 396, 297 [Google Scholar]
- Kulier, A., Galaz, G., Padilla, N. D., & Trayford, J. W. 2020, MNRAS, 496, 3996 [NASA ADS] [CrossRef] [Google Scholar]
- Ma, H.-C., Du, M., Ho, L. C., Sheng, M.-J., & Liao, S. 2024, A&A, 689, A293 [NASA ADS] [CrossRef] [EDP Sciences] [Google Scholar]
- Mandelbaum, R., Wang, W., Zu, Y., et al. 2016, MNRAS, 457, 3200 [Google Scholar]
- Marinacci, F., Vogelsberger, M., Pakmor, R., et al. 2018, MNRAS, 480, 5113 [NASA ADS] [Google Scholar]
- Martig, M., Bournaud, F., Croton, D. J., Dekel, A., & Teyssier, R. 2012, ApJ, 756, 26 [NASA ADS] [CrossRef] [Google Scholar]
- Martin, G., Kaviraj, S., Laigle, C., et al. 2019, MNRAS, 485, 796 [NASA ADS] [CrossRef] [Google Scholar]
- Mo, H. J., Deng, Z. G., Xia, X. Y., Schiller, P., & Boerner, G. 1992, A&A, 257, 1 [Google Scholar]
- Moster, B. P., Naab, T., & White, S. D. M. 2018, MNRAS, 477, 1822 [Google Scholar]
- Naiman, J. P., Pillepich, A., Springel, V., et al. 2018, MNRAS, 477, 1206 [Google Scholar]
- Neistein, E., & Dekel, A. 2008, MNRAS, 388, 1792 [Google Scholar]
- Nelson, D., Pillepich, A., Springel, V., et al. 2018, MNRAS, 475, 624 [Google Scholar]
- Nelson, D., Springel, V., Pillepich, A., et al. 2019, Comput. Astrophys. Cosmol., 6, 2 [Google Scholar]
- Noguchi, M. 1999, ApJ, 514, 77 [NASA ADS] [CrossRef] [Google Scholar]
- Peebles, P. J. E. 1982, ApJ, 263, L1 [Google Scholar]
- Peebles, P. J. E. 2020, MNRAS, 498, 4386 [NASA ADS] [CrossRef] [Google Scholar]
- Pérez-Montaño, L. E., Rodriguez-Gomez, V., Cervantes Sodi, B., et al. 2022, MNRAS, 514, 5840 [CrossRef] [Google Scholar]
- Pérez-Montaño, L. E., Cervantes Sodi, B., Rodriguez-Gomez, V., Zhu, Q., & Ogiya, G. 2024, MNRAS, 533, 93 [Google Scholar]
- Pillepich, A., Nelson, D., Hernquist, L., et al. 2018, MNRAS, 475, 648 [Google Scholar]
- Planck Collaboration XIII. 2016, A&A, 594, A13 [NASA ADS] [CrossRef] [EDP Sciences] [Google Scholar]
- Posti, L., & Fall, S. M. 2021, A&A, 649, A119 [NASA ADS] [CrossRef] [EDP Sciences] [Google Scholar]
- Posti, L., Fraternali, F., & Marasco, A. 2019, A&A, 626, A56 [NASA ADS] [CrossRef] [EDP Sciences] [Google Scholar]
- Rodriguez-Gomez, V., Genel, S., Vogelsberger, M., et al. 2015, MNRAS, 449, 49 [Google Scholar]
- Rodriguez-Gomez, V., Pillepich, A., Sales, L. V., et al. 2016, MNRAS, 458, 2371 [Google Scholar]
- Rodriguez-Gomez, V., Sales, L. V., Genel, S., et al. 2017, MNRAS, 467, 3083 [Google Scholar]
- Rodriguez-Gomez, V., Genel, S., Fall, S. M., et al. 2022, MNRAS, 512, 5978 [NASA ADS] [CrossRef] [Google Scholar]
- Romanowsky, A. J., & Fall, S. M. 2012, ApJS, 203, 17 [Google Scholar]
- Rosas-Guevara, Y., Bonoli, S., Dotti, M., et al. 2020, MNRAS, 491, 2547 [NASA ADS] [Google Scholar]
- Sales, L. V., Navarro, J. F., Schaye, J., et al. 2010, MNRAS, 409, 1541 [Google Scholar]
- Sales, L. V., Navarro, J. F., Theuns, T., et al. 2012, MNRAS, 423, 1544 [Google Scholar]
- Scannapieco, C., White, S. D. M., Springel, V., & Tissera, P. B. 2009, MNRAS, 396, 696 [NASA ADS] [CrossRef] [Google Scholar]
- Scannapieco, C., Wadepuhl, M., Parry, O. H., et al. 2012, MNRAS, 423, 1726 [Google Scholar]
- Schaye, J., Crain, R. A., Bower, R. G., et al. 2015, MNRAS, 446, 521 [Google Scholar]
- Semenov, V. A., Conroy, C., Chandra, V., Hernquist, L., & Nelson, D. 2024, ApJ, 972, 73 [Google Scholar]
- Springel, V., White, S. D. M., Tormen, G., & Kauffmann, G. 2001, MNRAS, 328, 726 [Google Scholar]
- Springel, V., Pakmor, R., Pillepich, A., et al. 2018, MNRAS, 475, 676 [Google Scholar]
- Stern, J., Fielding, D., Hafen, Z., et al. 2024, MNRAS, 530, 1711 [NASA ADS] [CrossRef] [Google Scholar]
- Stewart, K. R., Bullock, J. S., Wechsler, R. H., Maller, A. H., & Zentner, A. R. 2008, ApJ, 683, 597 [NASA ADS] [CrossRef] [Google Scholar]
- Toomre, A. 1977, in Evolution of Galaxies and Stellar Populations, eds. B. M. Tinsley, D. C. Larson, & R. B. Gehret, 401 [Google Scholar]
- Übler, H., Naab, T., Oser, L., et al. 2014, MNRAS, 443, 2092 [CrossRef] [Google Scholar]
- Vogelsberger, M., Genel, S., Springel, V., et al. 2014, Nature, 509, 177 [Google Scholar]
- Walker, I. R., Mihos, J. C., & Hernquist, L. 1996, ApJ, 460, 121 [NASA ADS] [CrossRef] [Google Scholar]
- Wang, K., & Peng, Y. 2024, arXiv e-prints [arXiv:2408.07743] [Google Scholar]
- Wang, W., & White, S. D. M. 2012, MNRAS, 424, 2574 [Google Scholar]
- Wetzel, A. R., Tinker, J. L., Conroy, C., & van den Bosch, F. C. 2013, MNRAS, 432, 336 [Google Scholar]
- White, S. D. M., & Rees, M. J. 1978, MNRAS, 183, 341 [Google Scholar]
- Yu, S., Bullock, J. S., Gurvich, A. B., et al. 2023, MNRAS, 523, 6220 [NASA ADS] [CrossRef] [Google Scholar]
- Zavala, J., Frenk, C. S., Bower, R., et al. 2016, MNRAS, 460, 4466 [NASA ADS] [CrossRef] [Google Scholar]
- Zehavi, I., Zheng, Z., Weinberg, D. H., et al. 2011, ApJ, 736, 59 [NASA ADS] [CrossRef] [Google Scholar]
- Zhao, D., Du, M., Ho, L. C., Debattista, V. P., & Shi, J. 2020, ApJ, 904, 170 [Google Scholar]
All Tables
All Figures
|
Fig. 1. Ratio between the mass of the spheroidal component and the total stellar mass (Msph/M⋆, which we refer as fsph hereafter) as a function of the stellar mass (M⋆). Grey dots show all the central galaxies with masses over 1010 M⊙ in TNG100. The blue ellipses highlight our population of mostly-disc galaxies, selected to have a negligible spheroidal component; the green ellipses with a circle in the middle indicate our intermediate sample with fsph value near the median of all the galaxies; and the red circles indicate the spheroid-dominated galaxies selected to have a negligible disc component at a given M⋆. The dotted black line indicates the cut used to select the disc-dominated sample. The distribution of M⋆ and fsph for the selected samples are also shown at the top and left of the panel, respectively (blue solid lines for the mostly-disc dominated sample, green dot-dashed lines for the intermediate sample, and dotted red lines for the spheroid-dominated sample). The distribution of fsph for all the central galaxies is also shown alongside the selected samples with a grey dashed line. The black dotted line in the fsph distribution indicates the median of fsph for all the galaxies. We use the same symbol, colour, and line-style convention as used in this figure to distinguish the different samples throughout all similar figures in the paper. |
| In the text | |
|
Fig. 2. Stellar mass density maps for galaxies with different morphologies in our samples (quoted in top panels). The top and middle rows correspond to face-on and edge-on views, with a green circle showing the galaxy radius, defined here as three times the half mass radius of the stars. The size of each box is 50 kpc across. The bottom panels show, for each galaxy, the distribution of orbital circularities (ϵ) of the stars along with stellar mass in units of log(M⊙), the stellar half-mass radius (r1/2) in units of kiloparsecs, and the fsph value. The vertical lines with the corresponding colours indicate the median ϵ value for each galaxy. Galaxies in our mostly-disc sample have well-defined discs, with a narrow distribution of ϵ close to one, and a negligible contribution, with ϵ ∼ 0 being typical of spheroid-like components. |
| In the text | |
|
Fig. 3. Distribution of the median value of the circularity parameter ( |
| In the text | |
|
Fig. 4. Luminosity profile as a function of projected radius (left) and sSFR as a function of stellar mass (right) for the galaxies in our samples. The thick lines indicate the median of each sample, and shaded regions are the error on the median calculated from 500 bootstrap resampling of the data. We use the same method to calculate errors through the entire paper. Our kinematics-based selection criteria reproduce the expected traits from the different morphologies, such as quiescence and steep luminosity profiles in spheroid-dominated objects versus active star formation and shallower luminosity profiles in disc-dominated samples. |
| In the text | |
|
Fig. 5. Halo spin, λ, as a function of stellar mass. The galaxies in all subsamples overlap in median (horizontal lines) and dispersion (symbols show individual objects in each sample), confirming that halo spin is not correlated with the morphology of the central galaxy in this mass range. |
| In the text | |
|
Fig. 6. Left: Stellar mass–halo mass relation for the galaxies in our samples. For comparison, we show the empirical fit by Moster et al. (2018) with a dashed black line along with individual fits of such a relation to each of our samples (solid blue, dot-dashed green, and dotted red for mostly-discs, intermediate, and spheroidals, respectively). There is a clear morphological trend in the relation, with disc-dominated objects populating haloes with two to ten times lower mass than spheroid-dominated objects at the same M⋆. Similarly, at fixed M200, disc-dominated galaxies form more stars than spheroids. Right: Distribution of the median stellar age of the galaxies in each subsample. We found a systematic trend with morphology where the disc-dominated samples are on average younger than the spheroid-dominated galaxies. |
| In the text | |
|
Fig. 7. Assembly history for the virial mass (left), stellar mass (second left), and gas (third left) components along with the median sSFR evolution (rightmost panel). Virial and stellar masses are normalised to their values at z = 0, while the gas component is normalised to the stellar mass at z = 0 for each subsample. The values of sSFR are not normalised (right margin). It is important to notice that the scale is different among the panels, with the three leftmost using the linear scale at the left and the rightmost using the logarithmic scale at the right. Haloes grow at a similar pace between the samples, but stars and gas show clear differences. Spheroid-dominated galaxies assemble their stars and consume their gas at earlier times than disc-dominated objects. Our mostly-disc sample shows steady star formation over time, maintaining a richer gas supply and a more sustained star formation rate over time than the intermediate and spheroid-dominated sample. |
| In the text | |
|
Fig. 8. Median values of the evolution of the inner and outer sSFR defined as taking place within or outside r1/2, respectively. The left panel is for the mostly-disc sample, the middle panel is for the intermediate sample, and the right panel is for the spheroid-dominated sample. We note that for the mostly-disc sample, the sSFR tends to be higher in the outer parts compared to the central regions of the galaxy. |
| In the text | |
|
Fig. 9. Fraction of the stellar mass from accreted origin as a function of stellar mass (left) and amount of stellar mass accreted as a function of virial halo mass (right) for our samples. We show the medians calculated in three different M200 ranges, (< 8 × 10¹¹), (8 × 10¹¹ − 1.5 × 10¹²), and (> 1.5 × 10¹² M⊙), chosen to include a fair number of galaxies in each bin. In general, spheroid-dominated objects have a larger contribution from accreted stars, but the overlap between the samples is substantial. We highlight the presence of mostly-disc and intermediate galaxies with a large accreted mass MMergers > 1010 M⊙ as well as the presence of three spheroid-dominated galaxies with less than 3% of their mass from accretion. |
| In the text | |
|
Fig. 10. Distribution of the time (x-axis) and stellar mass ratio (μ, y-axis) of the mergers for galaxies in each subsample: mostly-disc (left), intermediate (middle), and spheroid-dominated (right). Merger patterns are different across the galaxy types. The mostly-disc objects avoid mergers in the past ∼4 Gyrs. Merging also seems common for spheroid-dominated galaxies at very early times (≥9 Gyr ago). |
| In the text | |
|
Fig. 11. Structural evolution of the galaxies in our sample. We show the median stellar half-mass radius, r1/2, as a function of time on the left and the vertical stellar velocity dispersion measured at r1/2 as a function of time on the right. The disc-dominated objects are more extended at all times compared to the spheroid sample. The velocity dispersions of the subsamples show similar values before 10 Gyr ago, but they appear to have settled relatively quickly into their final present-day values around 8 − 9 Gyr ago, showing little evolution afterwards. |
| In the text | |
|
Fig. 12. Formation (lookback) time of the discs in our sample. The left panel shows an example of our definition based on the circularity parameter as a function of the stellar age of all stellar particles in a given galaxy (blue dots). We calculated the running median (black symbols) and their derivative (bottom panel) to find the time when the dominant and consistent formation of stars in circular orbits occurs, Tc. We note that by definition, Tc is in lookback time units where Tc = 0 means today. In the right panel we show Tc for all disc-dominated galaxies as a function of their virial mass at the time of Tc (individual symbols). The median value shows that mostly-disc objects settle into circular orbits slightly earlier than for the intermediate objects, but the scatter is large. Galaxies typically reach Tc late and when their host halo mass is larger than M200 ∼ 3 × 10¹¹ M⊙ (with one exception). Some of the oldest discs have been consistently forming stars since ∼10 Gyr ago. |
| In the text | |
|
Fig. 13. Angle between the angular momentum of the gas in the halo and the stars in the galaxy, θa, as a function of the mass in the spheroidal component, fsph, for galaxies in our sample. We show this at Tc for both disc-dominated samples and use z = 0 for the spheroid-dominated galaxies. Mostly-disc galaxies show a remarkable coherently aligned gas angular momentum with respect to that of the stars already formed at Tc, with a median cos(θa)∼0.95 and a few less well-aligned objects. The intermediate sample shows a preference for strong co-rotation of the components (cos(θa) > 0.5), but the angle between the angular momentum of gas and stars can be larger, even including counter rotation for a few objects. The spheroid-dominated galaxies are here for comparison only and show a wide range of misalignment. |
| In the text | |
Current usage metrics show cumulative count of Article Views (full-text article views including HTML views, PDF and ePub downloads, according to the available data) and Abstracts Views on Vision4Press platform.
Data correspond to usage on the plateform after 2015. The current usage metrics is available 48-96 hours after online publication and is updated daily on week days.
Initial download of the metrics may take a while.