Fig. 4.
Download original image
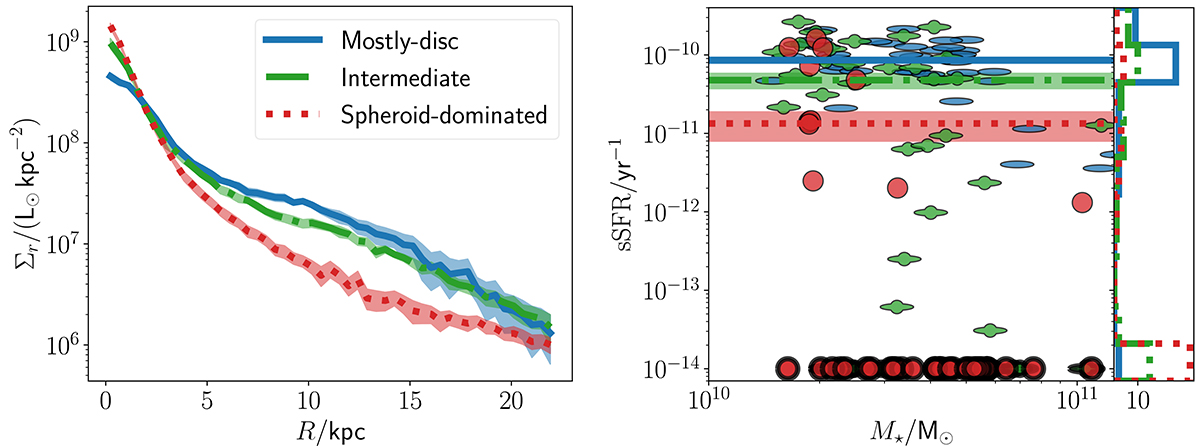
Luminosity profile as a function of projected radius (left) and sSFR as a function of stellar mass (right) for the galaxies in our samples. The thick lines indicate the median of each sample, and shaded regions are the error on the median calculated from 500 bootstrap resampling of the data. We use the same method to calculate errors through the entire paper. Our kinematics-based selection criteria reproduce the expected traits from the different morphologies, such as quiescence and steep luminosity profiles in spheroid-dominated objects versus active star formation and shallower luminosity profiles in disc-dominated samples.
Current usage metrics show cumulative count of Article Views (full-text article views including HTML views, PDF and ePub downloads, according to the available data) and Abstracts Views on Vision4Press platform.
Data correspond to usage on the plateform after 2015. The current usage metrics is available 48-96 hours after online publication and is updated daily on week days.
Initial download of the metrics may take a while.