Fig. 6.
Download original image
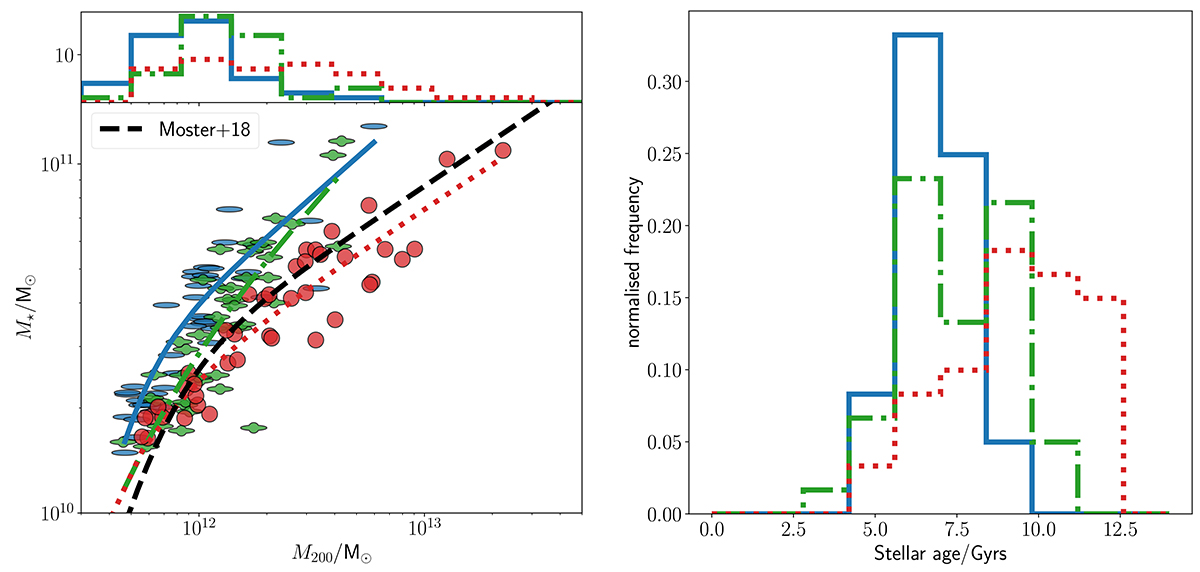
Left: Stellar mass–halo mass relation for the galaxies in our samples. For comparison, we show the empirical fit by Moster et al. (2018) with a dashed black line along with individual fits of such a relation to each of our samples (solid blue, dot-dashed green, and dotted red for mostly-discs, intermediate, and spheroidals, respectively). There is a clear morphological trend in the relation, with disc-dominated objects populating haloes with two to ten times lower mass than spheroid-dominated objects at the same M⋆. Similarly, at fixed M200, disc-dominated galaxies form more stars than spheroids. Right: Distribution of the median stellar age of the galaxies in each subsample. We found a systematic trend with morphology where the disc-dominated samples are on average younger than the spheroid-dominated galaxies.
Current usage metrics show cumulative count of Article Views (full-text article views including HTML views, PDF and ePub downloads, according to the available data) and Abstracts Views on Vision4Press platform.
Data correspond to usage on the plateform after 2015. The current usage metrics is available 48-96 hours after online publication and is updated daily on week days.
Initial download of the metrics may take a while.