Fig. 1.
Download original image
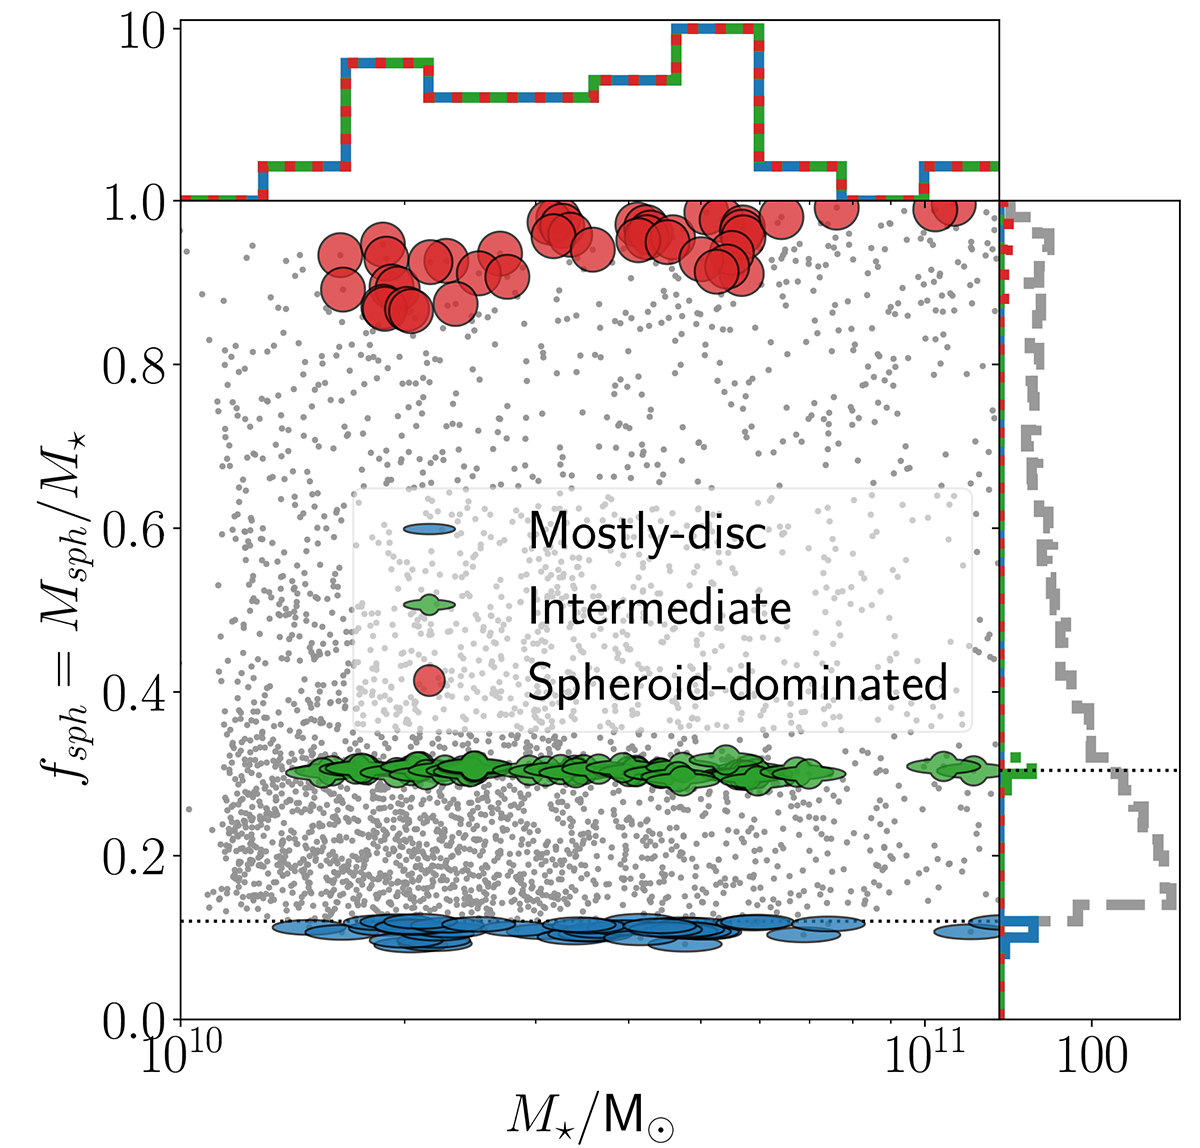
Ratio between the mass of the spheroidal component and the total stellar mass (Msph/M⋆, which we refer as fsph hereafter) as a function of the stellar mass (M⋆). Grey dots show all the central galaxies with masses over 1010 M⊙ in TNG100. The blue ellipses highlight our population of mostly-disc galaxies, selected to have a negligible spheroidal component; the green ellipses with a circle in the middle indicate our intermediate sample with fsph value near the median of all the galaxies; and the red circles indicate the spheroid-dominated galaxies selected to have a negligible disc component at a given M⋆. The dotted black line indicates the cut used to select the disc-dominated sample. The distribution of M⋆ and fsph for the selected samples are also shown at the top and left of the panel, respectively (blue solid lines for the mostly-disc dominated sample, green dot-dashed lines for the intermediate sample, and dotted red lines for the spheroid-dominated sample). The distribution of fsph for all the central galaxies is also shown alongside the selected samples with a grey dashed line. The black dotted line in the fsph distribution indicates the median of fsph for all the galaxies. We use the same symbol, colour, and line-style convention as used in this figure to distinguish the different samples throughout all similar figures in the paper.
Current usage metrics show cumulative count of Article Views (full-text article views including HTML views, PDF and ePub downloads, according to the available data) and Abstracts Views on Vision4Press platform.
Data correspond to usage on the plateform after 2015. The current usage metrics is available 48-96 hours after online publication and is updated daily on week days.
Initial download of the metrics may take a while.