Fig. 2.
Download original image
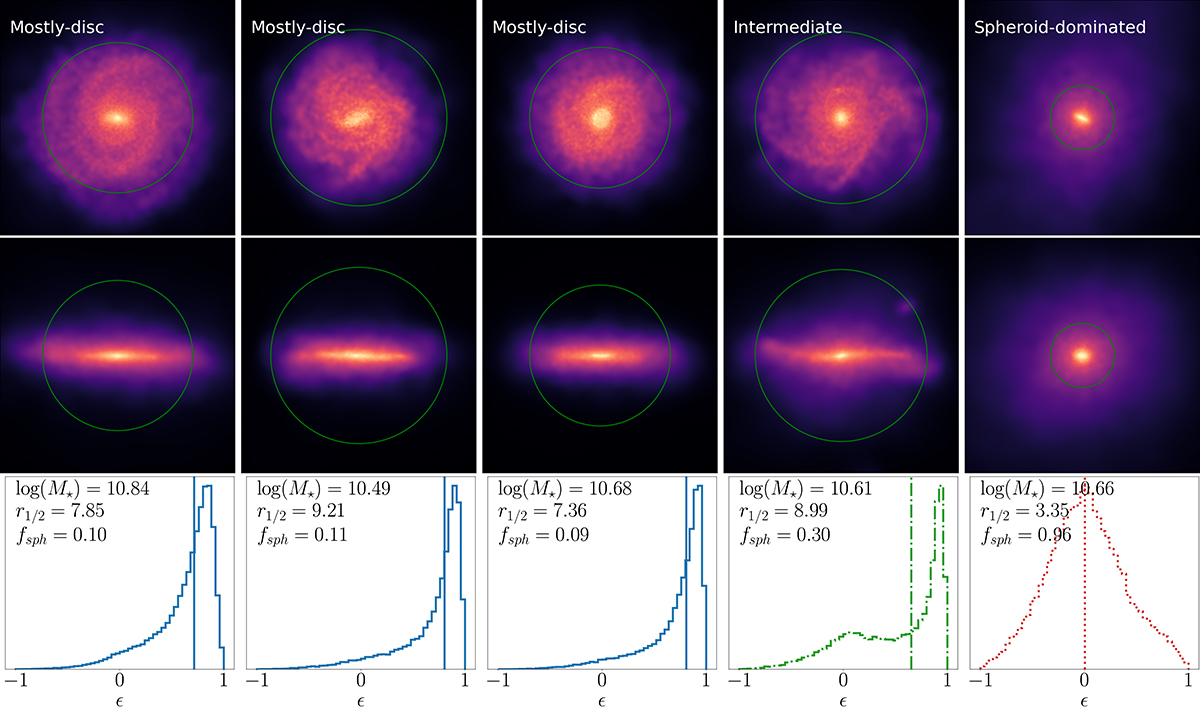
Stellar mass density maps for galaxies with different morphologies in our samples (quoted in top panels). The top and middle rows correspond to face-on and edge-on views, with a green circle showing the galaxy radius, defined here as three times the half mass radius of the stars. The size of each box is 50 kpc across. The bottom panels show, for each galaxy, the distribution of orbital circularities (ϵ) of the stars along with stellar mass in units of log(M⊙), the stellar half-mass radius (r1/2) in units of kiloparsecs, and the fsph value. The vertical lines with the corresponding colours indicate the median ϵ value for each galaxy. Galaxies in our mostly-disc sample have well-defined discs, with a narrow distribution of ϵ close to one, and a negligible contribution, with ϵ ∼ 0 being typical of spheroid-like components.
Current usage metrics show cumulative count of Article Views (full-text article views including HTML views, PDF and ePub downloads, according to the available data) and Abstracts Views on Vision4Press platform.
Data correspond to usage on the plateform after 2015. The current usage metrics is available 48-96 hours after online publication and is updated daily on week days.
Initial download of the metrics may take a while.