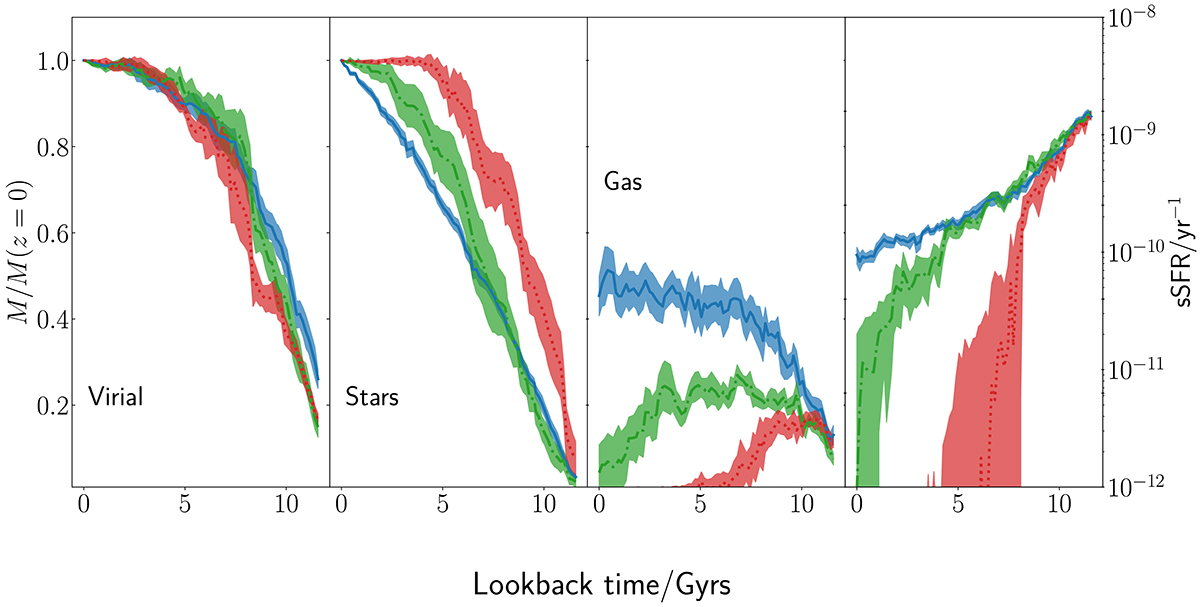
Fig. 7.
Download original image
Assembly history for the virial mass (left), stellar mass (second left), and gas (third left) components along with the median sSFR evolution (rightmost panel). Virial and stellar masses are normalised to their values at z = 0, while the gas component is normalised to the stellar mass at z = 0 for each subsample. The values of sSFR are not normalised (right margin). It is important to notice that the scale is different among the panels, with the three leftmost using the linear scale at the left and the rightmost using the logarithmic scale at the right. Haloes grow at a similar pace between the samples, but stars and gas show clear differences. Spheroid-dominated galaxies assemble their stars and consume their gas at earlier times than disc-dominated objects. Our mostly-disc sample shows steady star formation over time, maintaining a richer gas supply and a more sustained star formation rate over time than the intermediate and spheroid-dominated sample.
Current usage metrics show cumulative count of Article Views (full-text article views including HTML views, PDF and ePub downloads, according to the available data) and Abstracts Views on Vision4Press platform.
Data correspond to usage on the plateform after 2015. The current usage metrics is available 48-96 hours after online publication and is updated daily on week days.
Initial download of the metrics may take a while.