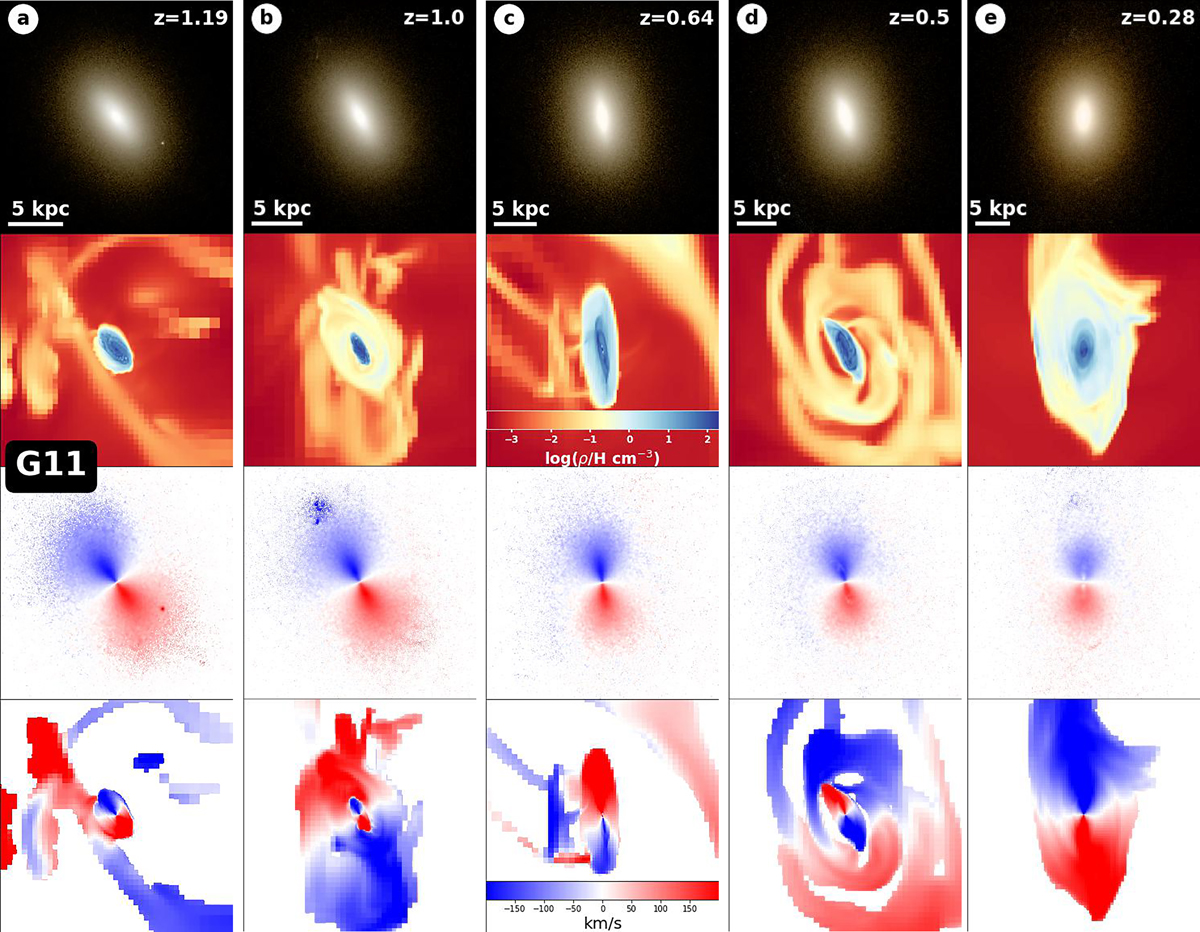
Fig. 3.
Download original image
For galaxy G11, projected u-g-r band images of the stellar component (first row), projected gas density (ρ, second row), and the associated projected velocity fields (third and fourth rows) at five different epochs (symbolized by items &#Xtextcircled;a–&#Xtextcircled;e). The values of rotation velocities are indicated by the color bar, the red parts are moving away from us while the blue ones are approaching us. The galaxy undergoes two successive episodes of retrograde gas accretion. At epoch &#Xtextcircled;a, the stars and central gas component are co-rotating. Then the first gas accretion lead to the coexistence of two disks of gas which rotate in opposite direction: the accreted material in the outer parts and the pre-existing one on the inner region (&#Xtextcircled;b). At epoch &#Xtextcircled;c, the new disk of gas has totally replaced the pre-existing one leading to the stellar-gas counter-rotating configuration. However, a new episode of retrograde gas accretion with respect to the inner disk (hence this new gas component is co-rotating with the stars) is already starting. Then epochs &#Xtextcircled;d and &#Xtextcircled;e repeat the same steps namely coexistence of two counter-rotating gas disks ending with a complete replacement.
Current usage metrics show cumulative count of Article Views (full-text article views including HTML views, PDF and ePub downloads, according to the available data) and Abstracts Views on Vision4Press platform.
Data correspond to usage on the plateform after 2015. The current usage metrics is available 48-96 hours after online publication and is updated daily on week days.
Initial download of the metrics may take a while.