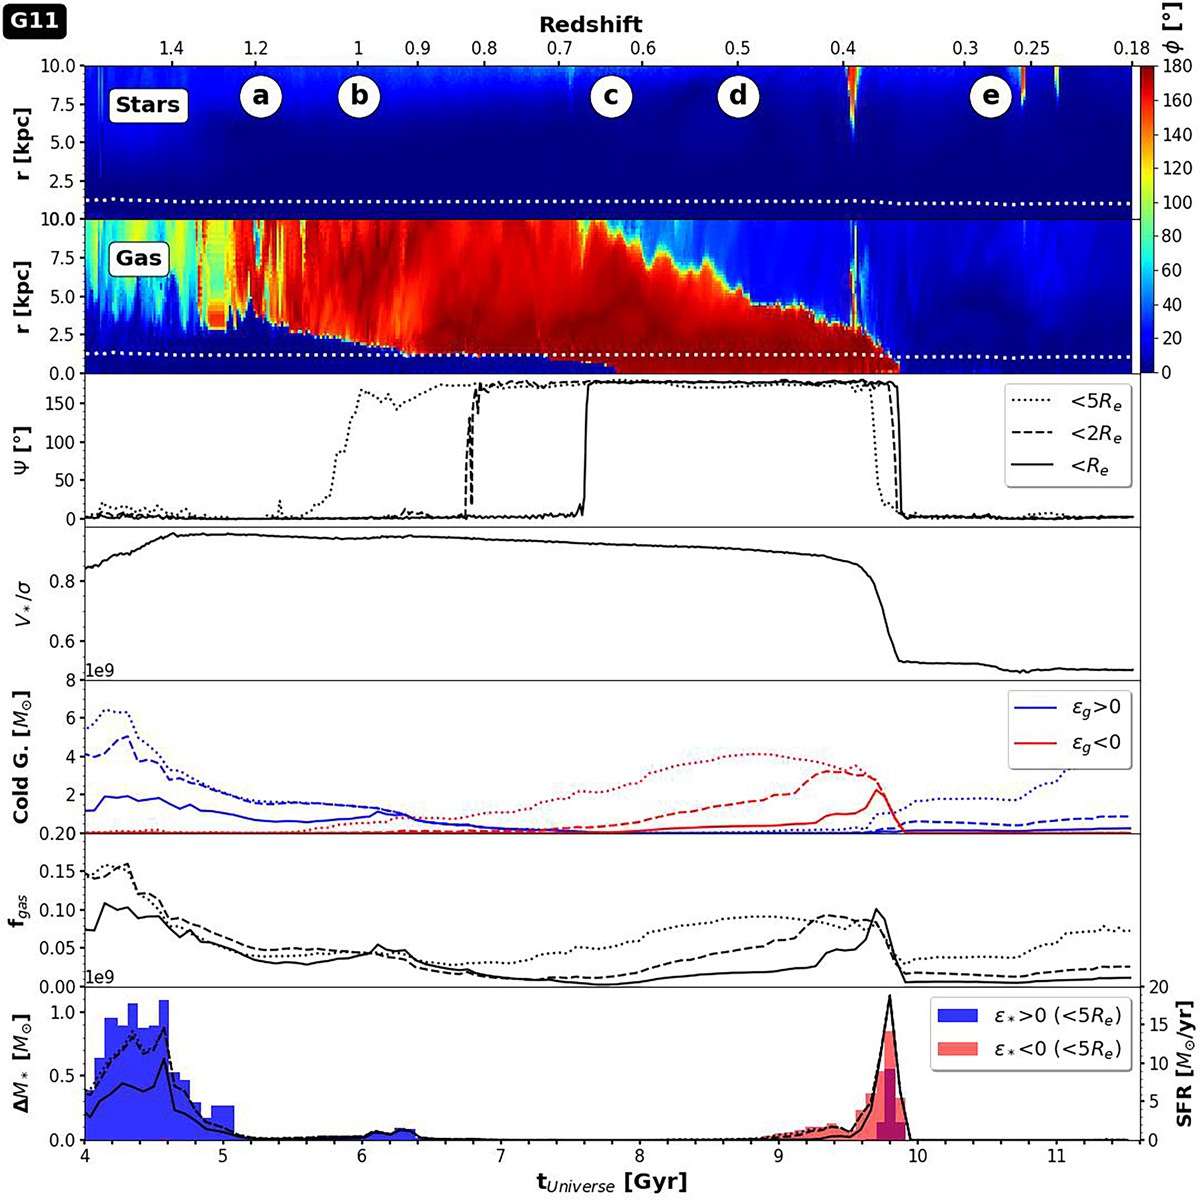
Fig. 4.
Download original image
Cosmic evolution of relevant properties relative to G11. From top to bottom: (1) Mass-weighted angle Φ(r) between the AM vector of the stellar component (computed by taking all stars within one effective radius) and the AM vector of all stars located within two concentric spheres of radius r − dr and r + dr. Φ(r) estimated within 0 < r < 10 kpc using 50 bins. The dotted line indicates the time evolution of Re; (2) Φ(r) computed this time with all “cold” gas cells located within two concentric spheres of radius r and r + dr. (3) Evolution of the 3D angle Ψ subtended between the stellar and gas AM vectors estimated within one (solid line), two (dashed line) or five (dotted line) effective radii. (4) Ratio of the stellar rotational velocity to the stellar velocity dispersion V*/σ estimated within one effective radius. (5) Masses of cold gas that co- or counter-rotate with the stellar component, estimated by selecting all (cold) gas cells with positive (blue lines) or negative (red lines) circularity parameters. We also estimate these two quantities within one, two, or five effective radii. (6) Evolution of the (cold) gas fraction, fgas = Mgas/(Mgas + Mstars) also estimated within one, two, or five effective radii. (7) Mass of new stars formed in situ within five effective radii in successive intervals and color coded according to positive (blue lines) and negative (red lines) circularity parameters. We also plot in the same panel, the cosmic star formation rate estimated by identifying all stars born in situ within the last 100 Myr within one, two, or five effective radii. We note that the z-axis of the cylindrical coordinate at any time corresponds to the total AM vector direction of the stellar component estimated within one effective radius.
Current usage metrics show cumulative count of Article Views (full-text article views including HTML views, PDF and ePub downloads, according to the available data) and Abstracts Views on Vision4Press platform.
Data correspond to usage on the plateform after 2015. The current usage metrics is available 48-96 hours after online publication and is updated daily on week days.
Initial download of the metrics may take a while.