Fig. 5.
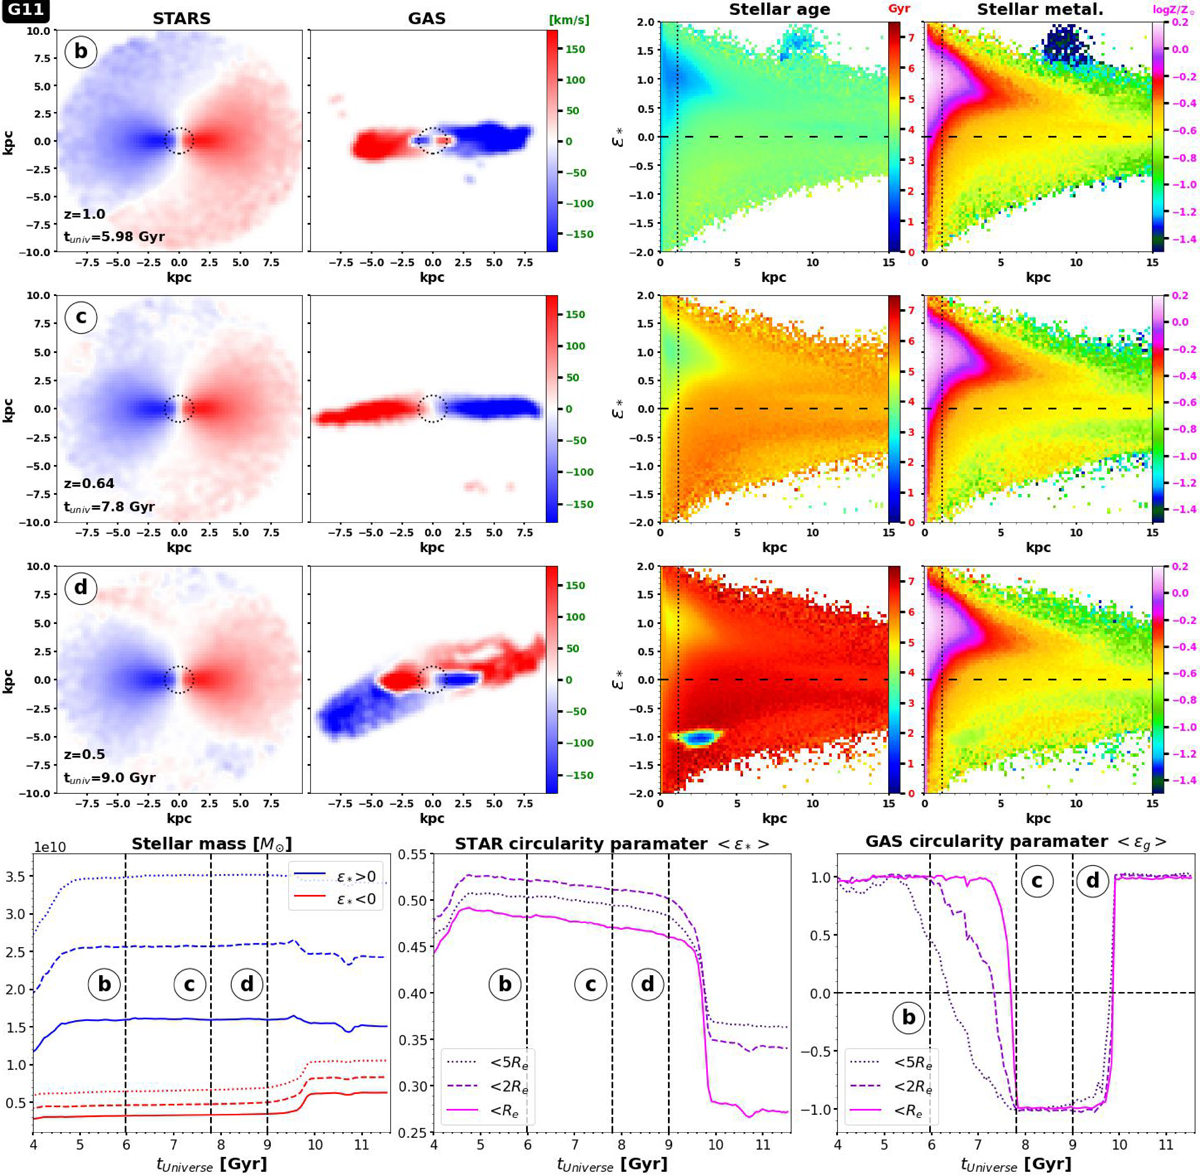
Download original image
Projected edge-on mass-weighted velocity fields (first and second columns) and associated mass-weighted stellar circularity parameter (ϵ*)-radial distance-stellar age diagram (third column) and ϵ*-radial distance-stellar metallicity diagram (fourth column) for galaxy G11 at epochs &#Xtextcircled;b, &#Xtextcircled;c, and &#Xtextcircled;d. Again, the values of rotation velocities are indicated by the color bar: The red parts are moving away from the viewer, while the blue ones are approaching. The dotted circles and dotted lines indicate values of the effective radius. The dashed lines represent ϵ* = 0. Each diagram is sampled using a regular grid of 80 × 80 pixels. Only pixels with at least five stellar particles are taken into account. This galaxy displays three different gas-stars misalignment configurations in its lifetime: At epoch &#Xtextcircled;b, the outer parts of the gas disk are counter-rotating with the stellar component, whereas at epoch &#Xtextcircled;d, it is the inner part of the gas disk that is in counter-rotation. Meanwhile at epoch &#Xtextcircled;c, a clear gas-versus-stars counter-rotating disks is obtained (within 10 kpc, i.e., ∼8 Re). We also note that in &#Xtextcircled;d, the two disks of stars are not entirely co-planar but have a misaligned angle of a ΔPA ∼ 198°. To facilitate the comparison with the trends presented in the previous figure, we plot in the last row the time evolution of the total stellar mass for stars satisfying either ϵ* > 0 or ϵ* < 0 (left panel) along with the evolution of the mean circularity parameters for stars (middle) and gas (right). All quantities are estimated within one (solid line), two (dashed line), or five (dotted line) effective radii.
Current usage metrics show cumulative count of Article Views (full-text article views including HTML views, PDF and ePub downloads, according to the available data) and Abstracts Views on Vision4Press platform.
Data correspond to usage on the plateform after 2015. The current usage metrics is available 48-96 hours after online publication and is updated daily on week days.
Initial download of the metrics may take a while.