| Issue |
A&A
Volume 696, April 2025
|
|
|---|---|---|
| Article Number | A102 | |
| Number of page(s) | 16 | |
| Section | Interstellar and circumstellar matter | |
| DOI | https://doi.org/10.1051/0004-6361/202452355 | |
| Published online | 08 April 2025 | |
A molecule-rich torus-like structure in the 21 µm source IRAS 23304+6147
1
School of Physics and Astronomy, Sun Yat-sen University,
2 Daxue Road,
Tangjia, Zhuhai
519082,
Guangdong Province,
China
2
Xinjiang Astronomical Observatory, Chinese Academy of Sciences,
150 Science 1-Street,
Urumqi
830011, China
3
CSST Science Center for the Guangdong-Hongkong-Macau Greater Bay Area, Sun Yat-Sen University,
Guangdong Province,
China
4
School of physics and astronomy, Yunnan University,
Kunming
650091, China
5
School of Mathematics and Physics, Jinggangshan University,
28 Xueyuan Road, Qingyuan District,
Ji’an
343009,
Jiangxi Province,
China
6
Xinjiang Key Laboratory of Radio Astrophysics,
150 Science 1-Street,
Urumqi, Xinjiang
830011, China
7
Key Laboratory of Radio Astronomy and Technology, Chinese Academy of Sciences,
A20 Datun Road, Chaoyang District,
Beijing
100101, China
★ Corresponding author; This email address is being protected from spambots. You need JavaScript enabled to view it.
Received:
24
September
2024
Accepted:
14
March
2025
Abstract
Context. A long-standing enigma in observational astronomy is the identification of the so-called 21 µm feature in a subset of envelopes of post-asymptotic giant branch (post-AGB) stars. Identifying this transient feature is important for understanding the chemical processes during the brief post-AGB phase and the enrichment of the interstellar medium. Understanding the structures and chemical environments of these objects is a prerequisite for this endeavor.
Aims. We investigate the structure of the circumstellar envelope and the spatial distribution of gas-phase molecules in the 21 µm source IRAS 23304+6147 with the aim to explore the potential physicochemical conditions required for the emergence of the 21 µm feature.
Methods. Molecular line observations toward IRAS 23304+6147 at the 1.3 mm band were performed using the Northern Extended Millimeter Array. A morpho-kinematic model was built to reproduce the observed 13CO images and to decipher the structures of the nebula.
Results. The imaging results reveal an elliptically elongated shell with an equatorial density enhancement (or a torus-like structure), which shows in detail how the various molecules are distributed in the envelope. The nebular morphology indicates a binary system in which the ultraviolet radiation from the companion might trigger photochemistry in the inner regions. The torus-like structure exhibits an enrichment of linear carbon-chain molecules and a depletion of silicon-bearing molecules. This nebula has a lower mass limit of 1.3 × 10⁻² M⊙ and might exhibit a low 12CO/13CO abundance ratio.
Conclusions. The chemically stratified structure of 13CN, HC3N, and C4H represents observational evidence of the internal radiation that initiates photochemistry. The carbon-rich torus-like structure probably offers a conducive environment for the formation of dust and complex molecules that are part of the rare 21 µm emission. We hypothesize that the 21 µm sources probably descend from J-type carbon stars via a binary evolutionary channel.
Key words: astrochemistry / stars: AGB and post-AGB / circumstellar matter / ISM: molecules / planetary nebulae: general / radio lines: ISM
© The Authors 2025
 Open Access article, published by EDP Sciences, under the terms of the Creative Commons Attribution License (https://creativecommons.org/licenses/by/4.0), which permits unrestricted use, distribution, and reproduction in any medium, provided the original work is properly cited.
This article is published in open access under the Subscribe to Open model. This email address is being protected from spambots. You need JavaScript enabled to view it. to support open access publication.
1 Introduction
When low- and intermediate-mass stars evolve into the asymptotic giant branch (AGB) stage, intense stellar winds emanate from the stellar surface and propel the circumstellar material into interstellar space at mass-loss rates from typically 10−8– 10−5 M⊙ yr−1 that can reach as high as 10−4 M⊙ yr−1 (e.g. Vassiliadis & Wood 1993; Bloecker 1995; Decin et al. 2019). The highly opaque AGB envelope is an enormous chemical factory (e.g., Cernicharo et al. 2000) in which over 100 gasphase molecules and 15 solid-state species have been detected (Decin 2021). After the high-mass loss ceases, the circumstellar material is gradually detached from the photosphere, and the stellar temperature increases. Before the stellar ultraviolet (UV) radiation becomes intense enough to ionize the envelope, there is a brief post-AGB phase, during which the star is surrounded by a protoplanetary nebula (PPN). The PPN stage lasts approximately 103 years. In contrast to the AGB envelope, whose morphology is predominantly spherical, the PPN shape starts to deviate from overall spherical symmetry and becomes more complex (e.g., Sahai & Trauger 1998). Recently, high angular resolution observations have revealed various structures in AGB envelopes that might be attributed to the interaction of a companion (Boffin et al. 2012; Decin et al. 2020). The binary system plays an important role in the shaping of PPNe during the transition from AGB to post-AGB (see Lagadec 2018, for a review).
In addition to the morphology transition, PPNe show a chemical complexity. It is well established that circumstellar chemistry is determined by the C/O abundance ratio as the less abundant element is mostly locked up in CO. Carbon- rich circumstellar envelopes are dominated by carbonaceous molecules such as CS, CN, HCN, and HC3N (e.g., Olofsson et al. 1993), whereas oxygen-rich envelopes predominantly contain oxygenated species such as SO, OH, SO2, and H2O (e.g., Engels 1979). A large variety of gas-phase molecules was detected in the prototype carbon-rich PPNe CRL 2688 and CRL 618 through spectral line surveys with single-dish telescopes (Pardo et al. 2007; Park et al. 2008; Zhang et al. 2013; Qiu et al. 2022). There is ample observational evidence that aromatic and aliphatic materials as well as C60 can be quickly synthesized in the PPN phase (Kwok et al. 2001; Zhang & Kwok 2011).
A quintessential example of the chemical complexity in PPNe is the discovery of the 21 µm feature. This feature was discovered for the first time by Kwok et al. (1989), and has so far been detected in only 31 objects (20 in the Galaxy, 9 in the Large Magellanic Cloud, and 2 in the Small Magellanic Cloud; see Volk et al. 2020, for a recent review). All the 21 µm sources are carbon-rich PPNe with strongly enriched s-process elements (van Winckel 2003). The rare detection indicates a transient nature. Observations show that the 21 µm feature is always accompanied by a broad feature at 30 µm, with the former accounting for about 1%–5% of the infrared emission of the PPN, and the latter accounting for about 7%–20% (Zhang et al. 2010). There is no correlation between the intensities of the two features, however (Jiang et al. 2010). The 21 µm feature remains unidentified, although a dozen different species, ranging from individual carbon- or silicon-bearing molecules to polycyclic aromatic hydrocarbon complexes, have been proposed as the potential carriers (see the references in Volk et al. 2020). Some of them can be ruled out because the cosmic abundance of the incorporated elements is insufficient or because no subfeatures arising from the same species are detected (Zhang et al. 2009). It is unclear why this feature abruptly appears and rapidly disappears and which role its carrier might play in circumstellar chemistry. Unraveling its origin is crucial to deepening our understanding of the enrichment of the interstellar medium.
The exclusive presence of the 21 µm feature in carbon-rich PPN suggests a significant link to carbon-chain chemistry. It follows that investigating carbon-bearing molecules within 21 µm sources could reveal critical insights into the identification of this mysterious feature (Zhang 2020; Qiu et al. 2024). However, the scarcity of 21 µm sources, the inherent faintness of molecular lines in these sources, and our incomplete understanding of circumstellar chemistry during the brief PPN period present significant challenges to this research. As a crucial first step of investigating the physicochemical environments necessary for the formation of the 21 µm carrier, we need to perform high-sensitivity observations and statistically study the nebular characteristics that are common for the 21 µm sources. Previous efforts were mostly based on single-dish observations, although interferometric observations of CO emission in a few 21 µm sources have been presented (Nakashima et al. 2009, 2012; Ueta et al. 2019), but they were unable to reveal the chemical complexity induced by the morphology evolution of PPNe.
In this paper, we present millimeter interferometry observations of a prototypical 21 µm source IRAS 23304+6147 with the aim to investigate the nebular structure and the spatial distributions of the gas-phase molecules. The observations and data reduction are described in Sect. 2. The spectra and images of the identified molecules are presented in Sect. 3, along with a morpho-kinematic model that we developed to explain the data. In Sect. 4 we discuss the nature and origin of the nebular structure, the 12CO/13CO abundance ratio, and the implications on circumstellar chemistry. Our conclusions follow in Sect. 5.
2 Observation and data reduction
IRAS 23304+6147 was observed using the Northern Extended Millimeter Array (NOEMA) Interferometer in configuration 12A on 2022 February 23 (1.9 h on-source), February 28 (2.9 h on- source), and March 6 (0.8 h on-source) under the project number W21BI (PI: Y. Zhang). The precipitable water vapor during the observations spread over 0.4–1.2 mm. The system temperatures ranged from 100–150 K. Twelve antennas were used, with baselines ranging from 32–920 m. The observations were performed with the lower sideband (LSB) covering 213–221 GHz and the upper sideband (USB) covering 228–236 GHz. Doppler tracking was employed and established a central velocity of −16.1 km s−1, the systematic velocity of IRAS 23304+6147, relative to the local standard of rest (LSR). The phase calibrators were 0059+581, J0011+707, and J2250+558, and the bandpass calibrators were 0059+581 and 3C84. MWC349 and 2010+723 were observed for the flux calibration. Their flux densities are 2.1 and 0.6 Jy, respectively.
The phase center was set at (α2000, δ2000) = (23h32m44s785, +62°03′49.084″). The data were calibrated using the GILDAS/CLIC package1. Imaging and deconvolution processes were conducted using GILDAS/MAPPING and GILDAS/IMAGER2. The CLEAN algorithm of Högbom (1974) was employed in the imaging process. Uniform weighting was used in order to optimize the spatial resolution, resulting in a synthesized beam of 0.52″ × 0.42″ at a position angle (PA) of 23°. Molecular maps were obtained by subtracting the maps of continuum emission extracted from line-free spectral channels. The root mean square (rms) noise of the line channel maps was 1.25–1.61 mJy beam−1. The spectral resolution was about 2 MHz (2.7 km s−1) at 1.3 mm.
3 Results
3.1 Spectral lines
Previously reported single-dish observations toward IRAS 23304+6147 detected CO (J = 1–0 and 2–1) (Woodsworth et al. 1990; Likkel et al. 1991; Hrivnak & Bieging 2005), 13CO (J = 1–0 and 2–1) (Sánchez Contreras & Sahai 2012; Qiu et al. 2024), CS (J = 3–2) (Omont et al. 1993), HCN (J = 1–0 and 3–2), H13CN (J = 3–2), and CN (N = 2–1) (Qiu et al. 2024). Our interferometric observations resulted in detections of 17 individual emission features belonging to eight different molecules and isotolopogs, among which C18O, 13CN, HC3N, C4H, SiS, and SiC2 were observed for the first time in this source. Figure A.1 shows the spectrum obtained by averaging the flux densities over a 2″ × 2″ area centered on the phase center. The line measurements are presented in Table 1, where Eu is the energy of the upper level, and Ipeak and ∫ I dv represent the peak and integrated intensities, respectively. The line profiles are shown in Fig. 1, where we converted the flux density has into Jy using a conversion factor of approximately 32.8 Jy/K.
In order to estimate the flux loss of our NOEMA observations, we compared the single-dish data of the CO and13 CO (J = 2−1) lines observed by the Heinrich Hertz Sub-millimeter Telescope (HHT) and the 10m Arizona Radio Observatory Submillimeter Telescope (SMT) (Hrivnak & Bieging 2005; Qiu et al. 2024). Figure 2 shows a comparison of the 13CO (J = 2−1) observations made by NOEMA and SMT. According to the single-dish observations, the CO and 13CO lines have peak intensities of 0.2 and 0.025 K and integrated intensities of 3 and 0.33 K km s−1, respectively. The half-power beam widths (HPBWs) of HHT and SMT are 32″ at 230 GHz and 34.3″ at 220 GHz, respectively. According to the NOEMA images, the source size is roughly 2″, which results in filling factors of 0.0039 and 0.0034 for the HHT and SMT beams, respectively. If there is no flux loss, the CO and 13CO lines should have peak intensities of 90 and 12 mK and integrated intensities of 0.93 and 0.12 K km s−1 in the HHT and SMT observations, respectively. This indicates a flux loss of 70% in our NOEMA CO and 13CO line observations. Extended fossil AGB halos were reported in other PPNe (e.g., Sahai et al. 2007). It is likely that an AGB halo has been substantially filtered out in our observations. Presumably, the flux loss is less severe for other lines that have a spatial extension significantly smaller than CO.
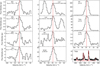 |
Fig. 1 Profiles of the lines detected in IRAS 23304+6147. The systemic velocity (−16.1 km s−1) is indicated by the vertical dashed line. The positions and relative intensities of the hyperfine components of 13CN are marked by vertical solid lines. |
Molecular lines detected in the observations.
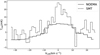 |
Fig. 2 Comparison of the 13CO J = 2−1 observations made by NOEMA and SMT. The NOEMA data were convolved to match the SMT resolution of 34.3″. The central velocity was set to 0 km s−1. |
3.2 Maps
Figure 3 shows the maps of the continuum emission at 1.39 and 1.28 mm, which have flux densities of 3.67 and 3.57 mJy, respectively, indicating an in-band spectral index3 of α = −0.3. The derived α value appears to be in close proximity to the theoretical predictions of optically thin free-free emission (−0.1). However, since the central star of this PPN lacks sufficient ionizing flux to sustain extended ionized regions, the physical origin of the spectral index remains unclear. Owing to the restricted frequency range and feeble continuum emission, we exercise caution and refrain from overinterpreting the result.
Figure 4 shows the continuum-subtracted moment-zero maps of the molecular lines. Overall, the post-AGB nebula appears as an elongated ellipsoid (EE) with an equatorial density enhancement (EDE). The EE structure is consistent with previous optical observations (Sahai et al. 2007) and is typical of nascent PPNe (Bujarrabal et al. 1992). The NOEMA maps show that different molecules have notably different spatial distributions that demonstrate a significant chemical stratification. The optically thick CO emission shows an oval structure with an inner bright ring and an outer halo. The EDE structure is more striking in the 13CO map, and it manifests itself as a torus-like structure in the maps of linear carbon-chain molecules (C4H and HC3N). The gaseous torus-like structure was also detected in other 21 µm sources, that is, in IRAS 07134+1005, IRAS 22272+5435, and IRAS 16594–4656 (Nakashima et al. 2009, 2012; Ueta et al. 2019). Despite their very modest emission, silicon-bearing molecules (SiS and SiC2) seem to be distributed in the peripheral regions of the envelope with fragmentary structures. Intrigu- ingly, the SiS and SiC2 fragments do not coincide in position. The 13CN emission is dominantly concentrated in the center, while the C18O emission is too faint to draw any conclusion about its spatial distribution.
The channel maps of CO, 13CO, and HC3N lines are shown in Figs. B.1–B.3. An inspection of these maps reveals that the intensity distributions highly depend on the velocities. In the red channels (VLSR > −3 km s−1), the EE appears as a bright spot located in the NW region, while in the blue channels (VLSR < −29 km s−1), the bright region of EE is shifted to the SE. The behavior of the EDE in the channel maps is opposite to that of the EE. The channel maps of 13CO and HC3N (Figs. B.2 and B.3) show that the crescent-shaped EDE emission is shifted from the SE to the NW from the red to the blue channels (VLSR = −8 to −27 km s−1). This clearly demonstrates that the major axis of the EE is inclined toward us in the SE, and the EE expands faster along the major axis than the EDE4.
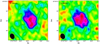 |
Fig. 3 Continuum emission at 1.39 and 1.28 mm wavelengths. The synthesized beams shown in the lower left corner are 0.52″ × 0.42″. The contour levels are at 1σ intervals starting at 1σ, where the rms is σ = 41 and 55 µJy beam−1 at 1.39 and 1.28 mm, respectively. |
3.3 Morpho-kinematic model
To investigate the structures of IRAS 23304+6147, we employed the three-dimensional morpho-kinematic modeling code SHAPE (Steffen & Koning 2012). We first input the initial parameters into SHAPE. Subsequently, through an iterative procedure, we generated synthetic images as well as positionvelocity (P–V) diagrams that closely resembled the observational data. From the free parameters refined during this iterative process, we proceeded to deduce the morpho-kinematic structure of the model. This method was previously demonstrated to be successful in reconstructing PPNe in other research works (e.g., Koning et al. 2011; Nakashima et al. 2012; Santander-García et al. 2015; Tafoya et al. 2019).
The model consists of two components corresponding to the EDE and EE, as shown in Fig. 5. We assumed that the EDE and the EE are symmetric in the azimuthal direction around the EE major axis. In a cylindrical coordinate system, we set the major axis of the EE as the z-axis. Then, we described the molecular density distributions using a formula with the variables z and r, where z represents the vertical displacement relative to the central star, and r represents the orthogonal distance to the z- axis. We assumed that the molecular gas is confined within the meshes shown in Fig. 5 and that the densities of the EDE and the EE follow the formulas
 (1)
(1)
and
 (2)
(2)
A simple Hubble flow was adopted for the velocity fields of the EDE and EE. Specifically, the maximum velocity of the EE is 2.5 times that of the EDE.
Based on the assumption that the 13CO (J = 2–1) line is optically thin, which implies that its surface brightness is proportional to the 13CO column density, we used the 13CO channel maps to impose constraints on the density distribution and velocity fields within the model5. Figures C.1 and C.2 present the modeled channel maps and the residual maps, respectively. The optimized modeling parameters in Eqs. (1) and (2) are as follows: n1 = 1.9 × 107 cm−3, r1 = 2.8 × 1016 cm, σ1 = 4.6 × 1015 cm, n2 = 5.4 × 106 cm−3, and σ2 = 2.2 × 1016 cm.
The model successfully reproduces the main observable features of the primary nebula on the channel maps, although it cannot precisely replicate the surface brightness. The existence of the EDE-EE structure is unequivocally corroborated, and the modeled velocities of the EDE and EE are expected be reliable. The model performance deteriorates at the tip of the EE. In comparison to the observations, there is an displacement that might partially be attributed to the oversimplified assumption of the density distribution and the photodissociation of 13CO (see Sect. 4.2.3). Furthermore, as illustrated in Fig. C.2, approximately 20% of the total flux arises from a diffuse component, which is not included in our current model. The diffuse emission exhibits remarkable intensity in the regions adjacent to the EDE and is detected in all of the velocity channels in which the EDE and EE are present. This extended emission can be attributed either to part of an AGB halo expanding at ~20 km s−1 or to a disk wind associated with the EDE.
Figure 6 shows a comparison between the observed P-V diagram and the modeling results. The kinetic structures of the EE and EDE are well traced by the P-V diagrams of 13CO. We do not see the signature of a rotating disk, which has been detected in a handful of PPNe (Gallardo Cava et al. 2021). The deduced inclination angles from the sky plane of the EDE and the EE are 35° and 55°, respectively. According to the modeling, the EE and EDE have maximum expansion velocities of about 35 and 14 km s−1, respectively. The primary axis of the EE has an angular dimension of 2″, whereas the inner and outer diameters of the EDE are 0.78″ and 1.75″. Adopting a distance of 4.32kpc (Kamath et al. 2022), we estimated the inner and outer diameters of the EDE to be 3300 and 7500 AU and the EE primary axis to be 8600 AU. This results in dynamic ages of 340–770 yr and 600 yr for the EDE and EE, respectively. Consequently, we infer that the EE and EDE were formed at approximately the same time.
Although the values of the parameters we used in the model were chosen based on the observational data and our current understanding of stellar winds, we cannot guarantee that they represent the only possible solution. It is crucial to point out that the SHAPE modeling is intended to examine the morphokinematic structures of the nebula on relative scales. We did not carry out radiative transfer calculations in this model. Consequently, the results do not directly depend on the temperature. In the future, it is highly desirable to develop a sophisticated radiative transfer model that incorporates 12CO lines, which are more sensitive to the temperature, in order to achieve more precise results.
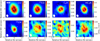 |
Fig. 4 Integrated-intensity (moment-zero) maps of the molecular lines detected in IRAS 23304+6147. The white ellipse in the lower corner represents the synthesized beam. For convenience, the dashed elliptical circles in each panel indicate the main CO emission region, whose semimajor (PA = 30°) and minor axis (PA = 60°) are 1.16″ and 0.84″, and the dashed straight lines mark the size of the extended CO halo. The NW direction is marked in the upper left corner of the CO map. |
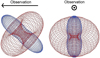 |
Fig. 5 Three-dimensional mesh geometry of the SHAPE model as seen from two orthogonal directions. The left panel shows the side view along the observer’s direction, and the right panel shows the front view facing the observer. The red torus represents the EDE, and the peanutshaped blue structure represents the EE. The inner and outer radii of the EDE are assumed to be 0.78 and 1.75″, respectively. The major axis of the EE is assumed to be 2″. |
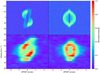 |
Fig. 6 P-V diagrams of the 13CO J = 2–1 transition derived from the modeling (upper panels) and observations (lower panels). The left panels present the velocity structure along the major axis of the EE, oriented from NW to SE, where negative offsets indicate the NW direction. The right panels show the velocity structure along the minor axis, oriented from SW to NE, with negative offsets corresponding to the SW direction. The cuts we used to extract these diagrams are detailed in Fig. 4. |
3.4 Nebular mass
After we established the excitation temperature, we derived the mass of molecular gas (M) from the 13CO (J = 2–1) line through the formula given by Olofsson & Nyman (1999) and Chiu et al. (2006). Drawing upon the approach delineated by Dinh-V-Trung (2009), we estimated the kinetic temperature (TK) of the molecular gas to be approximately 10 K. Subsequently, we made use of the online radiative transfer modeling tool RADEX (van der Tak et al. 2007) to compute the excitation temperature of the 13CO (J = 2–1) transition, which is roughly 10 K. Based on the same assumption as for IRAS 08544–4431 (Dinh-V-Trung 2009), where f13CO = 2 × 10⁻⁵, we find M = 1.3 × 10⁻² M⊙ for the nebula around the post-AGB star IRAS 23304+6147. There are some uncertainties in calculating M. Regarding IRAS 08544–4431, the investigations carried out by Dinh-V-Trung (2009) and Bujarrabal et al. (2018) derived values of M = 4.7 × 10⁻³ M⊙ and 2.2 × 10⁻² M⊙, respectively. After factoring in the effect of the different distances used in these calculations, this discrepancy indicates a five- to sixfold uncertainty in the mass estimation. Bujarrabal et al. (2018) implied a value of f13CO = 1.5 × 10⁻⁵ for IRAS 08544–4431, which is comparable to the assumption made by Dinh-V-Trung (2009). However, their studies indicated that the disk temperature in IRAS 08544–4431 might exceed 100 K. When we assume TK = 100 K, M decreases by a factor of 1.5. Therefore, we estimate that the uncertainty in the calculated mass could be as large as a factor of eight. Because of flux loss, the derived M should be regarded as a lower limit to the nebular mass. There might be an extended AGB-remnant halo with a mass of 3 × 10⁻² M⊙.
4 Discussion
The NOEMA observations of IRAS 23304+6147 update the molecular richness of this source and offer new details about its nebular structure that were not disclosed by earlier optical measurements. In Sect. 4.1 we discuss the shaping of this PPN. In Sect. 4.2 we examine the connection between the circumstellar chemistry and the nebular structure, which might shed new light on the origin of the 21 µm feature.
4.1 Origin and nature of the EDE
As pointed out by Lagadec (2018), there are two types of EDEs. The first type is short lived, created prior to the jet, and has a slow expansion velocity and limited angular momentum. One such example was found in the water fountain IRAS 16342-3814 (Sahai et al. 2017). The second type of EDE is in Keplerian rotation with a high angular momentum, and it has a longer lifetime. Disks of this type commonly coexist with disk-winds, as demonstrated by observations of the PPNe AC Her and Red Rectangle (Bujarrabal et al. 2015, 2016). Observational studies (Gallardo Cava et al. 2021; Gallardo Cava 2023) have demonstrated that although these outflows generally exhibit lower-mass budgets than their progenitor disks, they can occasionally exceed the mass of the rotating components they surround. In addition to the disk winds, high-velocity jets might be generated from the companion star (Bollen et al. 2022). In contrast to disk winds, these collimated high-velocity jets contribute only negligibly to the overall nebular mass (Gallardo Cava 2023). As shown in Fig. 6, the EDE of IRAS 23304+6147 has a slow expansion velocity of ~20 km s−1. For a Keperian disk, the velocity should be inversely proportional to the radial distance from the center, but this is not the case in Fig. 6. Therefore, the EDE does not exhibit rotation and should be assigned to the first category. The formation of EDE is commonly attributed to the interaction in a binary system, where the mass loss from the primary star tends to be directed in the orbital plane in the gravitational field of the companion. A pre-existing circumbinary disk might slow the superstellar winds down in the equatorial direction and generate the EDE. Dynamic interaction could lead to an angular momentum transfer from the binary orbit to the EDE and might form an expanding torus structure. During the further evolution, the torus might feed a circumpanion accretion disk and lead to the launch of a jet (see Bollen et al. 2022, and reference therein).
Decin et al. (2020) showed that in a binary system, the favorable conditions for forming the EDE are a high orbital eccentricity, a low fraction of the stellar wind mass within the orbital plane, a high stellar mass, a small orbital separation, and a low mass-loss rate. These conditions are often encountered in oxygen-rich stellar winds. Conversely, carbon-rich winds often exhibit a spiral structure rather than EDE because the acceleration by carbon-bearing dust is stronger (Decin et al. 2020). Therefore, the chance of detecting EDE in carbon-rich envelopes is probably low, although detections like this have been reported (e.g., Sánchez Contreras et al. 2004). However, our detection, together with those of Ueta et al. (2000) and Nakashima et al. (2009, 2012), suggests that the probability that 21 µm sources harbor an EDE is high. Klochkova et al. (2000) posited that the overabundance of silicon in IRAS 23304+6147 might be caused by the hot bottom-burning (HBB) process that occurs in the hot layers of the convective envelope of a massive AGB star. This is characteristic of J-type carbon stars (Chen et al. 2007), and it suggests that the central star has an initial mass greater than 4 M⊙. According to the formula of Decin et al. (2020), the likelihood of developing an EDE structure would increase fivefold with a fourfold increase in stellar mass. Therefore, it is reasonable to infer that the formation of the 21 µm carrier might be associated with the short-lived EDE in massive carbon-rich PPNe. This might provide a plausible explanation for the low detection rate of this feature.
On the other hand, HBB predominantly consumes 18O. De Nutte et al. (2017) showed that the 17O/18O ratio is positively correlated with the initial mass of the post-AGB star. The 17O/18O ratio approximately equals the ratio of integrated intensities of the C17O and C18O lines. We have detected the C18O line, but the C17O line lies below our detection threshold. Consequently, the upper limit of the 17O/18O ratio is determined to be 0.5. In light of the relation presented by De Nutte et al. (2017), it can be inferred that the stellar initial mass is lower than 1.5 M⊙. This inference implies that HBB does not play a significant role in this PPN, which stands in contrast to the conclusion drawn by Klochkova et al. (2000). We put forward the hypothesis that the discrepancy might be attributable to binary evolution, even though the specific details remain obscure.
The EDE was also detected in the mid-infrared image of another 21 µm PPN IRAS 07134+1005 (Ueta et al. 2000; Kwok et al. 2002), which traces the dust emission. However, high-angular resolution CO and 13CO maps showed that it is a hollow shell with a slight velocity enhancement along the major axis. The presence of the EDE is therefore doubtful (Ueta et al. 2019). The CO map (Fig. B.1) might have made us raise the same claim for the morpho-kinematics of IRAS 23304+6147: that no EDE is visible. However, as clearly shown in Fig. 4, the carbon-chain molecules trace a torus-like structure. The CO map displays a significantly different morphology mostly due to its optically thick nature. On the other hand, C4H and HC3N have subtly different spatial distributions, and the former are more concentrated in the torus. This probably suggests a chemical differentiation. This discussion shows that the appearances of PPNe depend on the molecules. The images of only one or two molecular lines might cause an unrealistic classification of the nebular morphologies. Masa et al. (2024) provided compelling evidence for this molecular selectivity. Their interferometric observations demonstrated that HCO+ and HCN maps resolve knotty structures that span the central region to the polar tips of M1-92. Notably, these structures are absent in the CO and 13CO maps. Future observations with high spatial resolution could reveal the distribution of a wider range of molecules and not just CO within the EDE and EE post-AGB structures.
4.2 Chemistry of the 21 µm PPN
The departure from spherical symmetry could result in spatially distinct chemical differentiation. The parent molecules ejected from the AGB star are ionized or dissociated by the UV photons from the external interstellar radiation field, which induces ion- or radical-neutral reactions and thus increases the molecular complexity in the circumstellar envelope. As the star evolves into the PPN phase, the increasing temperature of the central star and the expansion of the envelope might strengthen the internal UV radiation, which might in principle also contributes to the photo and radiation chemistry of the envelope. The most recent astrochemical models predict that under the assumption of a clumpy stellar wind and additional radiation from a hot companion, sufficient internal UV photons can penetrate deeply into the envelope and impose a significant influence on the circumstellar chemistry (Millar 2020; Van de Sande et al. 2023). Observational evidence for circumstellar chemistry driven by internal UV radiation is still scarce. Different chemical processes in the EE and EDE might occur due to their different densities and extinctions, which govern the penetration of the UV photons into the envelope. In the low-density EE, the collisions between molecules are relatively inefficient and the UV radiation is intense, and thus, the synthesis of daughter molecules from photodissociation products is inefficient. The situation is the reverse for the EDE, where the density is higher and daughter molecules can be synthesized more efficiently. With this in mind, the following subsections attempt to provide an interpretation of the spatial distribution of molecules in this PPN. In Sects. 4.2.1 and 4.2.2, we discuss the carbon- and silicon-bearing molecules, respectively. Section 4.2.3 presents the spatial distribution of the 12CO/13COratio.
4.2.1 Carbon-bearing molecules
For the sake of clarity, Fig. 7 presents the line intensity profiles of three carbon-bearing molecules along the major axis of the EE and the EDE (i.e., the minor axis of the EE). As shown in the right panels of this figure, larger carbon-bearing molecules are located farther out in the EDE. HC3N and C4H exhibits a double-peak profile, with the latter lying in the extended region of the EDE, while13 CN shows a single peak. In the direction of the EE major-axis (the left panels of Fig. 7), the intensity profiles of 13CN and HC3N lines are asymmetric, and the peak intensities slightly shift to the SE. This can be attributed to the obscuration of the emission from the EE by the inclined front torus (see Fig. 9). The asymmetry is more pronounced for 13CN, suggesting that this molecule is located in the innermost region of the EE. C4H lines exhibit a symmetrical intensity profiles, indicating that they are located predominantly in the outer EDE. The HC3N line profile appears to fall somewhere in between those of the 13CN and C4H, and it might be decomposed into two components that correspond to the EE and EDE, respectively.
The breadths (R) of the spatial distributions of the molecular emission along the EDE diration have a relation of R(13CN) < R(HC3N) < R(C4H). The dipole moments (µ) of the three carbon-bearing molecules follow µ(13CN) < µ(C4H) < µ(HC3N). The HC3N and C4H lines have a similar excitation energy that is substantially higher than that of the 13CN lines (Table 1). Therefore, it is hard to explain the different spatial distributions of the molecular emission in the EDE in terms of different excitation conditions, which are more likely to stem from chemistry.
In gas-phase chemistry, HC3N is primarily formed through the reaction between C2H2 and CN (Agúndez et al. 2017). The gas ejected from the stellar surface is rich in C2H2 and HCN. CN is available only when HCN is dissociated by sufficiently intense UV radiation. According to traditional astrochemical models, UV photons are mainly from the interstellar medium, and thus, CN and HC3N should be enriched in the outer regions of the envelope, with CN lying more outside (see e.g., Millar & Herbst 1994; Agúndez et al. 2017). This is opposite to our observations and provides strong evidence that the photochemistry is driven by the internal UV radiation. The photochemistry of the cyanopolyyne family has also been revealed in CRL 618 (Pardo et al. 2005). However, CRL 618 has a central B0 star that has developed a compact ionized region, and thus, it is now leaving the PPN stage. Unlike that of CRL 618, the central stars of the 21 µm sources have a temperature of ~5000 K; their photochemistry might be driven by an obscured hot companion.
There are two potential routes to form circumstellar C4H. First, this species can be formed via C2H2 +C2H, where C2H can be enriched by the photodissociation of HC3N (Agúndez et al. 2017). If this is the case, the distribution of C4H provides a further supporting argument for the hypothesis of an internal photochemistry. Alternatively, C4H can be formed via C2H2+C2, which is efficient even at low temperatures (Canosa et al. 2007). The outer midplane of the EDE is short of photon heating, and it is thus colder, providing a favorable environment for the formation of C4H. This is consistent with the observed spatial distribution of C4H. The rate coefficients of these neutral-neutral reactions are typically 10−10 cm3 s−1. When we assume the density of C2H2 to be 1 cm−3, the reaction timescale is ~300 years, which is comparable to the dynamical timescale of the EDE. Since large hydrocarbons can be formed in the EDE, it is reasonable to speculate that it also harbors more complex organics. The enhancement of hydrocarbon clusters in 21 µm sources was taken as an indication of carbonaceous molecules as the carrier of the 21 µm feature (Buss et al. 1990).
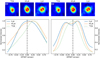 |
Fig. 7 Spatial distributions of the 13CN, HC3N, and C4H molecules. The NW direction is marked in the upper left corner of the 13CN map. The left panels show the molecular line intensity distributions in the major-axis direction, tracking a path from NW to SE (the offset changes from negative to positive) at a PA of 30° relative to the NS direction. The right panels show the molecular line intensity distributions in the minor-axis direction, tracking a path from SW to NE (the offset changes from negative to positive) at a PA of 60°. In the upper panels, the dashed lines denote the paths along which the line intensity profiles are extracted. The positions of the phase centers are denoted by the pentagrams in the upper panels and the vertical dashed lines in the lower panels. |
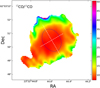 |
Fig. 8 Ratio map of the 12CO and 13CO integrated intensities. The dashed ellipse is the same as that in Fig. 4. The major and minor axes of the ellipse align with the EE and EDE direction, respectively. |
4.2.2 Silicon-bearing molecules
Differing from carbon-bearing molecules, silicon-bearing molecules are distributed around the periphery of the EDE (Fig. 4). Because of their refractory nature, silicon-bearing molecules can readily condense onto dust particles. Massalkhi et al. (2018) reported that the SiC2 abundance in carbon-rich AGB envelopes strongly decreases with increasing density, and they inferred that SiC2 is the gas-phase precursor of SiC dust. The absence of gaseous silicon-bearing molecules in the EDE might suggest an efficient dust formation. This agrees with the mid-infrared detection of the EDE in IRAS 07134+1005 (Ueta et al. 2000; Kwok et al. 2002).
The synthesis of circumstellar SiC2 has been a long-standing debate, centered on whether it is a parent molecule existing in the photosphere or a daughter species formed in the outer envelope through ion recombination reactions of parent molecules (Howe & Millar 1990; Feng et al. 2023). As shown in Fig. 4, SiC2 and SiS seem to exhibit complementary spatial distributions, suggesting that the two species are chemically linked. SiC2 can be formed from SiS through the reaction routes SiS → SiC2H+ → SiC2.
Notably, a broad emission around 30 µm is consistently detected in sources exhibiting the 21 µm feature, suggesting a profound connection between the two features (Volk et al. 2020). The 30 µm feature is widely attributed to MgS (Goebel & Moseley 1985; Nuth et al. 1985). Zhukovska & Gail (2008) reported that in carbon-rich environments, the formation of MgS through reactions between Mg and gas-phase sulfur-bearing molecules can only occur when Si is substantially depleted into solid SiC. In the absence of such Si depletion, S is primarily locked in SiS. Therefore, the severe condensation of Si-bearing molecules in the EDE might have boosted the formation of MgS. As a result, the 30 µm feature is strong in this source. When the dusty EDE is exposed to the internal UV radiation, there might be a wealth of a dust-gas chemistry (Van de Sande et al. 2023). Complex organic molecules, such as hydrogenated fullerenes (Zhang 2020), might be efficiently formed and cause the 21 µm feature. This hypothesis is consistent with the findings of Kwok et al. (2002) that the aromatic/aliphaic and 21 µm features and the dust emission arise from the same location.
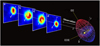 |
Fig. 9 Schematic illustration of the true shape of IRAS 23304+6147. The grid on the right represents the conceptual model consisting of a hypothetical binary star system (filled yellow circles), an EE, and an EDE. The coloration of the grid is defined according to the Doppler effect, i.e., the regions moving away from the observer’s perspective (along the y-axis, as denoted by the arrow below ‘Observation’) are indicated in red, and those moving toward the observer are shown in blue. Four representational velocity slices are shown on the left: a (VLSR = −3 to 3 km s−1), b (VLSR = −16 to −5 km s−1), c (VLSR = −27 to −18 km s−1), and d (VLSR = −40 to −29 km s−1). The nebula is projected onto the X–Z plane (the sky plane). From the observer’s perspective, from the far to near sides, the EE is first seen in channel a and progresses toward d, while the EDE shifts from channel b to c. |
4.2.3 12CO/13CO ratio
It is well established that the isotopic 12C/13C ratios in evolved stars are lower than the solar value (89). According to Ramstedt & Olofsson (2014), the median values of the 12CO/13CO abundance ratios in M-, S-, and C-type AGB stars are 13, 26, and 34, respectively. The CN cycle in the hydrogenburning shell converts 12C into the β-unstable isotope 13N, which decays into 13C. The third dredge-up transports 13C to the stellar surface, lowering circumstellar 12C/13C ratio. In binary stellar systems, the 13C enhancement could be caused by nova pollution (Sengupta et al. 2013). The 12CO and 13CO (J = 2−1) lines in IRAS 23304+6147 have an integrated-intensity ratio of 7.1. The value is similar to the mean value of other 21 µm sources (10.3 ± 3.1, Hrivnak & Bieging 2005; Qiu et al. 2024), suggesting that 21 µm sources have a low 12C/13C abundance ratio. Such low 12CO/13CO ratios have also been found in binary post- AGB stars with (sub-)Keplerian rotating disks (~8.6, Gallardo Cava et al. 2022). J-type carbon stars have relatively low 12C/13C ratios, which might be related to their binary nature (e.g., Izzard et al. 2007; Sengupta et al. 2013; Abia & Isern 2000), although the exact cause is unclear. It is reasonable to hypothesize that the 21 µm sources might be descended from J-type carbon stars.
Figure 8 presents the 12CO/13CO map, demonstrating the notable differences between the EDE and EE. The ratio is comparatively low (6.9–15) in the EDE and higher (20–50) in the EE, where it peaks in the outermost regions. The reason might be that the EDE optical thickness is higher than that of the EE. On the other hand, the outermost regions of the EE are exposed to the interstellar radiation field, causing photodissociation of 13CO. As12 CO might remain largely intact due to its self-shielding effect, the 12CO/13CO is higher in the tips of the EE. As shown in Fig. 4, the 12CO emission has a larger extent along the EE major axis than the 13CO emission. Therefore, 13CO is unable to fully represent the actual nebular structure. We propose that the EE and EDE might constitute structural components of an oval nebula. In Fig. 9 we present a schematic illustration of the intrinsic geometry of this PPN without the diffuse halo for visual clarity.
5 Conclusion
We presented interferometric NOEMA maps of gas-phase molecules in the 21 µm source IRAS 23304+6147 that offer valuable information about the structure of this nebula. Eight different molecules and isotopologs were observed, six of which (C18O, SiS, SiC4, 13CN, HC3N, and C4N) are new detections in this object. In comparison to the extensive research on the chemistry of AGB envelopes, the chemistry of PPNe has barely been explored. The newly detected molecular lines have, to some extent, deepened our understanding of the molecular chemistry in these objects. We constructed a morpho-kinematic model to reproduce the observed maps. A chemically stratified structure is revealed that showcs two distinct features: EDE and EE. Based on the 13CO emission, we estimated that the nebular mass is higher than 1.3 × 10⁻² M⊙. A comparison with single-dish observations indicated that an extended halo might be missed by our interferometric observations. Linear carbon-chain molecules are preferentially distributed in the EDE and form a torus-like structure. The different spatial distributions of 13CN, HC3N, and C4H provide strong evidence that the internal UV radiation initiates the photochemistry. SiS and SiC2 maps exhibit a lacuna, indicating an efficient dust formation in the EDE. These results show that the transition of the PPN morphology might result in a significant chemical differentiation. As a result, different species might have distinct spatial distributions, and the morpho-kinematics of PPNe might depend on molecules.
The 12CO/13CO ratios span from 6.9 in the core of the EDE to 50 in the tips of EE, and they stay approximately constant in the main nebular regions. This suggests that the EDE is optically thick in 12CO and that 13CO has been significantly photodissociated in the outermost regions. The generally low 12CO/13CO ratio and the EDE structure in IRAS 23304+6147 seem to indicate that its progenitor probably is a J-type carbon star in a binary system.
This carbon-rich EDE might hold the vital clue to the origin of the 21 µm feature. Our observations showed that the EDE serves as a favorable environment for dust formation and molecular synthesis. We speculate that complex aromatic or aliphatic compounds can be formed in the EDE, some of which, such as hydrogenated fullerenes, might be the carrier of the 21 µm feature.
Acknowledgements
We thank the anonymous reviewer for insightful suggestions, which have significantly improved the quality of this work. We are grateful to Ana Lopez Sepulcre and Michael Bremer for their helps in the data reduction. The financial supports of this work are from the National Natural Science Foundation of China (NSFC, No. 12473027, 12333005, and 11973099), the Guangdong Basic and Applied Basic Research Funding (No. 2024A1515010798), and the science research grants from the China Manned Space Project (NO. CMS- CSST-2021-A09, CMS-CSST-2021-A10, etc). Y.Z. thanks the Xinjiang Tianchi Talent Program (2023). X.H.L. acknowledges support from the Natural Science Foundation of Xinjiang Uygur Autonomous Region (No. 2024D01E37) and the National Science Foundation of China (12473025). This work is based on observations carried out with the IRAM NOEMA Interferometer. IRAM is supported by INSU/CNRS (France), MPG (Germany) and IGN (Spain).
Appendix A Spectra
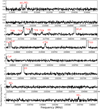 |
Fig. A.1 NOEMA spectra of IRAS 23304+6147 in the frequency ranges of 213–221 GHz (LSB) and 228–236 GHz (USB). |
Appendix B Channel maps
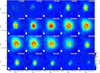 |
Fig. B.1 Channel maps of IRAS 23304+6147 in CO J = 2 − 1 emission. The contour levels are individually set for each channel by creating ten equally spaced contour lines between the maximum and minimum intensities of that channel. The crosses mark the position of the phase center. The LSR velocities are indicated in each panel. The systemic velocity of this object is –16.1 km s−1. The white ellipse at the bottom-left corner represents the synthesized beam, with a size of 0.52″ × 0.42″ and a PA of 23°. |
Appendix C Modelling
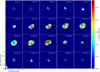 |
Fig. C.1 Modeled 13CO (J = 2–1) channel maps. The white ellipse in the lower-left corner of the image represents the synthesized beam. The angular size of each panel is identical to those in Figs. B.1–B.3. |
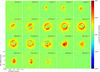 |
Fig. C.2 Residuals between the observed and modeled 13CO (J = 2–1) channel maps. The angular size of each panel is identical to those in Figs. B.1–B.3. |
References
- Abia, C., & Isern, J. 2000, ApJ, 536, 438 [NASA ADS] [CrossRef] [Google Scholar]
- Agúndez, M., Cernicharo, J., Quintana-Lacaci, G., et al. 2017, A&A, 601, A4 [Google Scholar]
- Bloecker, T. 1995, A&A, 299, 755 [NASA ADS] [Google Scholar]
- Boffin, H. M. J., Miszalski, B., Rauch, T., et al. 2012, Science, 338, 773 [Google Scholar]
- Bollen, D., Kamath, D., Van Winckel, H., et al. 2022, A&A, 666, A40 [NASA ADS] [CrossRef] [EDP Sciences] [Google Scholar]
- Bujarrabal, V., Alcolea, J., & Planesas, P. 1992, A&A, 257, 701 [NASA ADS] [Google Scholar]
- Bujarrabal, V., Castro-Carrizo, A., Alcolea, J., et al. 2013, A&A, 557, L11 [CrossRef] [EDP Sciences] [Google Scholar]
- Bujarrabal, V., Castro-Carrizo, A., Alcolea, J., & Van Winckel, H. 2015, A&A, 575, L7 [CrossRef] [EDP Sciences] [Google Scholar]
- Bujarrabal, V., Castro-Carrizo, A., Alcolea, J., et al. 2016, A&A, 593, A92 [NASA ADS] [CrossRef] [EDP Sciences] [Google Scholar]
- Bujarrabal, V., Castro-Carrizo, A., Van Winckel, H., et al. 2018, A&A, 614, A58 [NASA ADS] [CrossRef] [EDP Sciences] [Google Scholar]
- Buss, R. H. J., Cohen, M., Tielens, A. G. G. M., et al. 1990, ApJ, 365, L23 [NASA ADS] [CrossRef] [Google Scholar]
- Canosa, A., Páramo, A., Le Picard, S. D., & Sims, I. R. 2007, Icarus, 187, 558 [NASA ADS] [CrossRef] [Google Scholar]
- Cernicharo, J., Guélin, M., & Kahane, C. 2000, A&AS, 142, 181 [NASA ADS] [CrossRef] [EDP Sciences] [Google Scholar]
- Chen, P.-S., Yang, X.-H., & Zhang, P. 2007, AJ, 134, 214 [NASA ADS] [CrossRef] [Google Scholar]
- Chiu, P.-J., Hoang, C.-T., Dinh-V-Trung, et al. 2006, ApJ, 645, 605 [NASA ADS] [CrossRef] [Google Scholar]
- Decin, L. 2021, ARA&A, 59, 337 [NASA ADS] [CrossRef] [Google Scholar]
- Decin, L., Homan, W., Danilovich, T., et al. 2019, Nat. Astron., 3, 408 [NASA ADS] [CrossRef] [Google Scholar]
- Decin, L., Montargès, M., Richards, A. M. S., et al. 2020, Science, 369, 1497 [Google Scholar]
- De Nutte, R., Decin, L., Olofsson, H., et al. 2017, A&A, 600, A71 [NASA ADS] [CrossRef] [EDP Sciences] [Google Scholar]
- Dinh-V-Trung. 2009, ApJ, 692, 1382 [Google Scholar]
- Engels, D. 1979, A&AS, 36, 337 [NASA ADS] [Google Scholar]
- Feng, Y., Li, X., Millar, T. J., et al. 2023, Front. Astron. Space Sci., 10, 1215642 [NASA ADS] [CrossRef] [Google Scholar]
- Gallardo Cava, I. 2023, arXiv e-prints [arXiv:2311.08034] [Google Scholar]
- Gallardo Cava, I., Gómez-Garrido, M., Bujarrabal, V., et al. 2021, A&A, 648, A93 [NASA ADS] [CrossRef] [EDP Sciences] [Google Scholar]
- Gallardo Cava, I., Bujarrabal, V., Alcolea, J., Gómez-Garrido, M., & Santander-García, M. 2022, A&A, 659, A134 [NASA ADS] [CrossRef] [EDP Sciences] [Google Scholar]
- Goebel, J. H., & Moseley, S. H. 1985, ApJ, 290, L35 [NASA ADS] [CrossRef] [Google Scholar]
- Högbom, J. A. 1974, A&AS, 15, 417 [Google Scholar]
- Howe, D. A., & Millar, T. J. 1990, MNRAS, 244, 444 [NASA ADS] [Google Scholar]
- Hrivnak, B. J., & Bieging, J. H. 2005, ApJ, 624, 331 [Google Scholar]
- Izzard, R. G., Jeffery, C. S., & Lattanzio, J. 2007, A&A, 470, 661 [NASA ADS] [CrossRef] [EDP Sciences] [Google Scholar]
- Jiang, B. W., Zhang, K., & Li, A. 2010, Earth Planets Space, 62, 105 [NASA ADS] [CrossRef] [Google Scholar]
- Kamath, D., Van Winckel, H., Ventura, P., et al. 2022, ApJ, 927, L13 [NASA ADS] [CrossRef] [Google Scholar]
- Klochkova, V. G., Szczerba, R., & Panchuk, V. E. 2000, AstL, 26, 88 [NASA ADS] [Google Scholar]
- Koning, N., Kwok, S., & Steffen, W. 2011, ApJ, 740, 27 [NASA ADS] [CrossRef] [Google Scholar]
- Kwok, S., Volk, K. M., & Hrivnak, B. J. 1989, ApJ, 345, L51 [Google Scholar]
- Kwok, S., Volk, K., & Bernath, P. 2001, ApJ, 554, L87 [NASA ADS] [CrossRef] [Google Scholar]
- Kwok, S., Volk, K., & Hrivnak, B. J. 2002, ApJ, 573, 720 [Google Scholar]
- Lagadec, E. 2018, Galaxies, 6, 99 [NASA ADS] [CrossRef] [Google Scholar]
- Likkel, L., Forveille, T., Omont, A., & Morris, M. 1991, A&A, 246, 153 [NASA ADS] [Google Scholar]
- Masa, E., Alcolea, J., Santander-García, M., et al. 2024, Galaxies, 12, 63 [NASA ADS] [CrossRef] [Google Scholar]
- Massalkhi, S., Agúndez, M., Cernicharo, J., et al. 2018, A&A, 611, A29 [CrossRef] [EDP Sciences] [PubMed] [Google Scholar]
- Millar, T. J. 2020, Chinese J. Chem. Phys., 33, 668 [NASA ADS] [CrossRef] [Google Scholar]
- Millar, T. J., & Herbst, E. 1994, A&A, 288, 561 [NASA ADS] [Google Scholar]
- Nakashima, J.-I., Koning, N., Kwok, S., & Zhang, Y. 2009, ApJ, 692, 402 [Google Scholar]
- Nakashima, J.-I., Koning, N., Volgenau, N. H., et al. 2012, ApJ, 759, 61 [Google Scholar]
- Nuth, J. A., Moseley, S. H., Silverberg, R. F., Goebel, J. H., & Moore, W. J. 1985, ApJ, 290, L41 [Google Scholar]
- Olofsson, H., & Nyman, L. Å. 1999, A&A, 347, 194 [Google Scholar]
- Olofsson, H., Eriksson, K., Gustafsson, B., & Carlstrom, U. 1993, ApJS, 87, 267 [NASA ADS] [CrossRef] [Google Scholar]
- Omont, A., Loup, C., Forveille, T., et al. 1993, A&A, 267, 515 [NASA ADS] [Google Scholar]
- Pardo, J. R., Cernicharo, J., & Goicoechea, J. R. 2005, ApJ, 628, 275 [NASA ADS] [CrossRef] [Google Scholar]
- Pardo, J. R., Cernicharo, J., Goicoechea, J. R., Guélin, M., & Asensio Ramos, A. 2007, ApJ, 661, 250 [NASA ADS] [CrossRef] [Google Scholar]
- Park, J. A., Cho, S.-H., Lee, C. W., & Yang, J. 2008, AJ, 136, 2350 [NASA ADS] [CrossRef] [Google Scholar]
- Qiu, J.-J., Zhang, Y., Zhang, J.-S., & Nakashima, J.-I. 2022, ApJS, 259, 56 [NASA ADS] [Google Scholar]
- Qiu, J.-J., Zhang, Y., Nakashima, J.-I., et al. 2024, AJ, 167, 91 [NASA ADS] [Google Scholar]
- Ramstedt, S., & Olofsson, H. 2014, A&A, 566, A145 [NASA ADS] [CrossRef] [EDP Sciences] [Google Scholar]
- Sahai, R., & Trauger, J. T. 1998, AJ, 116, 1357 [NASA ADS] [CrossRef] [Google Scholar]
- Sahai, R., Morris, M., Sánchez Contreras, C., & Claussen, M. 2007, AJ, 134, 2200 [NASA ADS] [CrossRef] [Google Scholar]
- Sahai, R., Vlemmings, W. H. T., Gledhill, T., et al. 2017, ApJ, 835, L13 [NASA ADS] [CrossRef] [Google Scholar]
- Sánchez Contreras, C., & Sahai, R. 2012, ApJS, 203, 16 [NASA ADS] [CrossRef] [Google Scholar]
- Sánchez Contreras, C., Bujarrabal, V., Castro-Carrizo, A., Alcolea, J., & Sargent, A. 2004, ApJ, 617, 1142 [Google Scholar]
- Santander-García, M., Bujarrabal, V., Koning, N., & Steffen, W. 2015, A&A, 573, A56 [NASA ADS] [CrossRef] [EDP Sciences] [Google Scholar]
- Sengupta, S., Izzard, R. G., & Lau, H. H. B. 2013, A&A, 559, A66 [NASA ADS] [CrossRef] [EDP Sciences] [Google Scholar]
- Steffen, W., & Koning, N. 2012, Shape: A 3D Modeling Tool for Astrophysics, Astrophysics Source Code Library [record ascl:1204.010] [Google Scholar]
- Tafoya, D., Orosz, G., Vlemmings, W. H. T., Sahai, R., & Pérez-Sánchez, A. F. 2019, A&A, 629, A8 [NASA ADS] [CrossRef] [EDP Sciences] [Google Scholar]
- Ueta, T., Meixner, M., & Bobrowsky, M. 2000, ApJ, 528, 861 [Google Scholar]
- Ueta, T., Izumiura, H., Yamamura, I., & Otsuka, M. 2019, in Why Galaxies Care About AGB Stars: A Continuing Challenge through Cosmic Time, 343, eds. F. Kerschbaum, M. Groenewegen, & H. Olofsson, 520 [Google Scholar]
- van der Tak, F. F. S., Black, J. H., Schöier, F. L., Jansen, D. J., & van Dishoeck, E. F. 2007, A&A, 468, 627 [NASA ADS] [CrossRef] [EDP Sciences] [Google Scholar]
- Van de Sande, M., Walsh, C., & Millar, T. J. 2023, Faraday Discuss., 245, 586 [CrossRef] [Google Scholar]
- van Winckel, H. 2003, ARA&A, 41, 391 [Google Scholar]
- Vassiliadis, E., & Wood, P. R. 1993, ApJ, 413, 641 [Google Scholar]
- Volk, K., Sloan, G. C., & Kraemer, K. E. 2020, Ap&SS, 365, 88 [Google Scholar]
- Woodsworth, A. W., Kwok, S., & Chan, S. J. 1990, A&A, 228, 503 [NASA ADS] [Google Scholar]
- Zhang, Y. 2020, ApJ, 898, 151 [Google Scholar]
- Zhang, Y., & Kwok, S. 2011, ApJ, 730, 126 [NASA ADS] [CrossRef] [Google Scholar]
- Zhang, K., Jiang, B. W., & Li, A. 2009, MNRAS, 396, 1247 [NASA ADS] [CrossRef] [Google Scholar]
- Zhang, Y., Kwok, S., & Hrivnak, B. J. 2010, ApJ, 725, 990 [Google Scholar]
- Zhang, Y., Kwok, S., Nakashima, J.-I., Chau, W., & Dinh-V-Trung. 2013, ApJ, 773, 71 [NASA ADS] [CrossRef] [Google Scholar]
- Zhukovska, S., & Gail, H. P. 2008, A&A, 486, 229 [NASA ADS] [CrossRef] [EDP Sciences] [Google Scholar]
The spectral index α is defined as the exponent in the power-law relation describing the dependence of the continuum flux density S v on frequency v, given by S v ∝ vα.
The EE expands at different velocities along different directions, and has the highest velocity along the major axis, which is referred to the velocity of the EE hereafter for simplicity. The EDE expands along the equatorial direction at a constant velocity.
The 13CO (J = 2–1) line might not be optically thin in PPNe. For instance, Bujarrabal et al. (2013) showed that the Red Rectangle core is optically thick in the 13CO (J = 2–1) line. However, the morphokinematic reconstruction remains robust to slight deviations from the optically thin assumption.
All Tables
All Figures
|
Fig. 1 Profiles of the lines detected in IRAS 23304+6147. The systemic velocity (−16.1 km s−1) is indicated by the vertical dashed line. The positions and relative intensities of the hyperfine components of 13CN are marked by vertical solid lines. |
| In the text | |
|
Fig. 2 Comparison of the 13CO J = 2−1 observations made by NOEMA and SMT. The NOEMA data were convolved to match the SMT resolution of 34.3″. The central velocity was set to 0 km s−1. |
| In the text | |
|
Fig. 3 Continuum emission at 1.39 and 1.28 mm wavelengths. The synthesized beams shown in the lower left corner are 0.52″ × 0.42″. The contour levels are at 1σ intervals starting at 1σ, where the rms is σ = 41 and 55 µJy beam−1 at 1.39 and 1.28 mm, respectively. |
| In the text | |
|
Fig. 4 Integrated-intensity (moment-zero) maps of the molecular lines detected in IRAS 23304+6147. The white ellipse in the lower corner represents the synthesized beam. For convenience, the dashed elliptical circles in each panel indicate the main CO emission region, whose semimajor (PA = 30°) and minor axis (PA = 60°) are 1.16″ and 0.84″, and the dashed straight lines mark the size of the extended CO halo. The NW direction is marked in the upper left corner of the CO map. |
| In the text | |
|
Fig. 5 Three-dimensional mesh geometry of the SHAPE model as seen from two orthogonal directions. The left panel shows the side view along the observer’s direction, and the right panel shows the front view facing the observer. The red torus represents the EDE, and the peanutshaped blue structure represents the EE. The inner and outer radii of the EDE are assumed to be 0.78 and 1.75″, respectively. The major axis of the EE is assumed to be 2″. |
| In the text | |
|
Fig. 6 P-V diagrams of the 13CO J = 2–1 transition derived from the modeling (upper panels) and observations (lower panels). The left panels present the velocity structure along the major axis of the EE, oriented from NW to SE, where negative offsets indicate the NW direction. The right panels show the velocity structure along the minor axis, oriented from SW to NE, with negative offsets corresponding to the SW direction. The cuts we used to extract these diagrams are detailed in Fig. 4. |
| In the text | |
|
Fig. 7 Spatial distributions of the 13CN, HC3N, and C4H molecules. The NW direction is marked in the upper left corner of the 13CN map. The left panels show the molecular line intensity distributions in the major-axis direction, tracking a path from NW to SE (the offset changes from negative to positive) at a PA of 30° relative to the NS direction. The right panels show the molecular line intensity distributions in the minor-axis direction, tracking a path from SW to NE (the offset changes from negative to positive) at a PA of 60°. In the upper panels, the dashed lines denote the paths along which the line intensity profiles are extracted. The positions of the phase centers are denoted by the pentagrams in the upper panels and the vertical dashed lines in the lower panels. |
| In the text | |
|
Fig. 8 Ratio map of the 12CO and 13CO integrated intensities. The dashed ellipse is the same as that in Fig. 4. The major and minor axes of the ellipse align with the EE and EDE direction, respectively. |
| In the text | |
|
Fig. 9 Schematic illustration of the true shape of IRAS 23304+6147. The grid on the right represents the conceptual model consisting of a hypothetical binary star system (filled yellow circles), an EE, and an EDE. The coloration of the grid is defined according to the Doppler effect, i.e., the regions moving away from the observer’s perspective (along the y-axis, as denoted by the arrow below ‘Observation’) are indicated in red, and those moving toward the observer are shown in blue. Four representational velocity slices are shown on the left: a (VLSR = −3 to 3 km s−1), b (VLSR = −16 to −5 km s−1), c (VLSR = −27 to −18 km s−1), and d (VLSR = −40 to −29 km s−1). The nebula is projected onto the X–Z plane (the sky plane). From the observer’s perspective, from the far to near sides, the EE is first seen in channel a and progresses toward d, while the EDE shifts from channel b to c. |
| In the text | |
|
Fig. A.1 NOEMA spectra of IRAS 23304+6147 in the frequency ranges of 213–221 GHz (LSB) and 228–236 GHz (USB). |
| In the text | |
|
Fig. B.1 Channel maps of IRAS 23304+6147 in CO J = 2 − 1 emission. The contour levels are individually set for each channel by creating ten equally spaced contour lines between the maximum and minimum intensities of that channel. The crosses mark the position of the phase center. The LSR velocities are indicated in each panel. The systemic velocity of this object is –16.1 km s−1. The white ellipse at the bottom-left corner represents the synthesized beam, with a size of 0.52″ × 0.42″ and a PA of 23°. |
| In the text | |
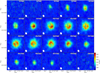 |
Fig. B.2 Same as Fig. B.1 but for 13CO J = 2 – 1. |
| In the text | |
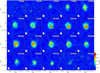 |
Fig. B.3 Same as Fig. B.1 but for HC3N J = 24 − 23. |
| In the text | |
|
Fig. C.1 Modeled 13CO (J = 2–1) channel maps. The white ellipse in the lower-left corner of the image represents the synthesized beam. The angular size of each panel is identical to those in Figs. B.1–B.3. |
| In the text | |
|
Fig. C.2 Residuals between the observed and modeled 13CO (J = 2–1) channel maps. The angular size of each panel is identical to those in Figs. B.1–B.3. |
| In the text | |
Current usage metrics show cumulative count of Article Views (full-text article views including HTML views, PDF and ePub downloads, according to the available data) and Abstracts Views on Vision4Press platform.
Data correspond to usage on the plateform after 2015. The current usage metrics is available 48-96 hours after online publication and is updated daily on week days.
Initial download of the metrics may take a while.