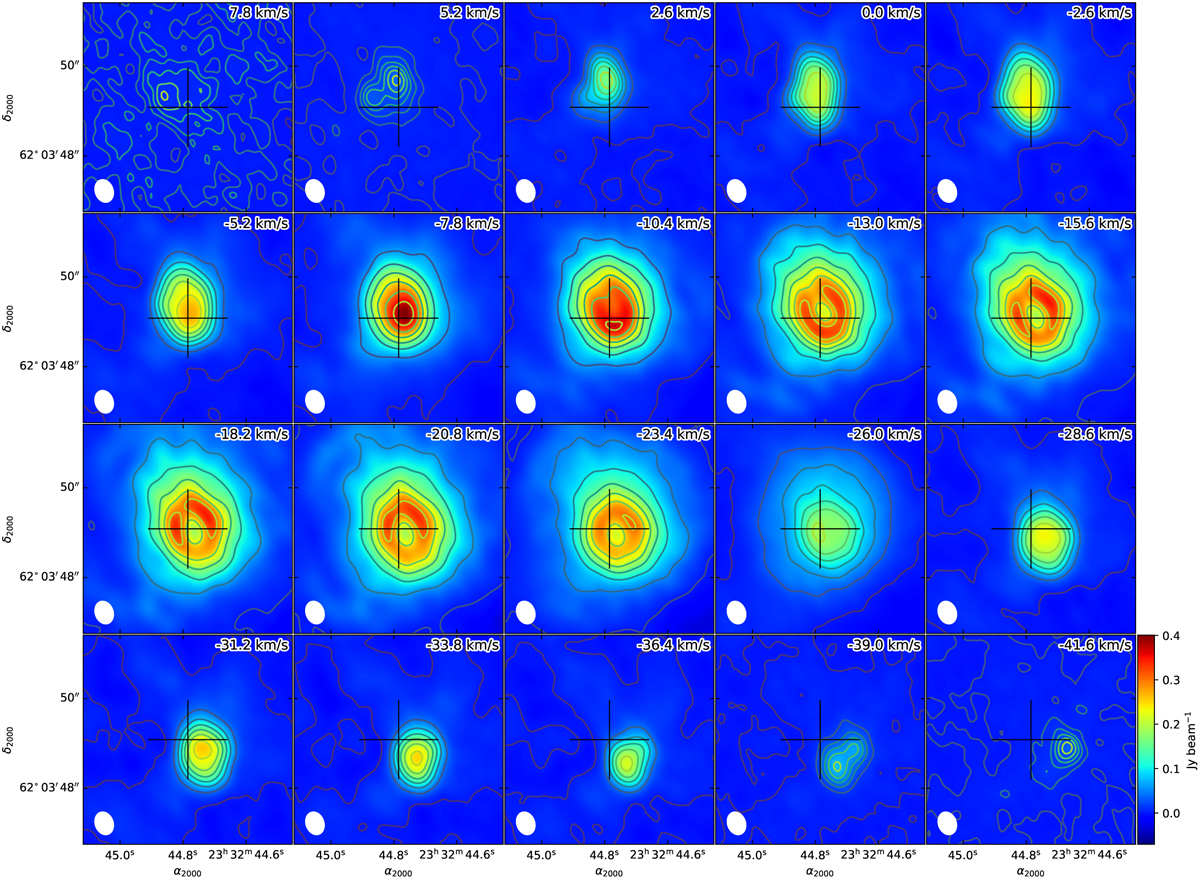
Fig. B.1
Download original image
Channel maps of IRAS 23304+6147 in CO J = 2 − 1 emission. The contour levels are individually set for each channel by creating ten equally spaced contour lines between the maximum and minimum intensities of that channel. The crosses mark the position of the phase center. The LSR velocities are indicated in each panel. The systemic velocity of this object is –16.1 km s−1. The white ellipse at the bottom-left corner represents the synthesized beam, with a size of 0.52″ × 0.42″ and a PA of 23°.
Current usage metrics show cumulative count of Article Views (full-text article views including HTML views, PDF and ePub downloads, according to the available data) and Abstracts Views on Vision4Press platform.
Data correspond to usage on the plateform after 2015. The current usage metrics is available 48-96 hours after online publication and is updated daily on week days.
Initial download of the metrics may take a while.