Fig. 9
Download original image
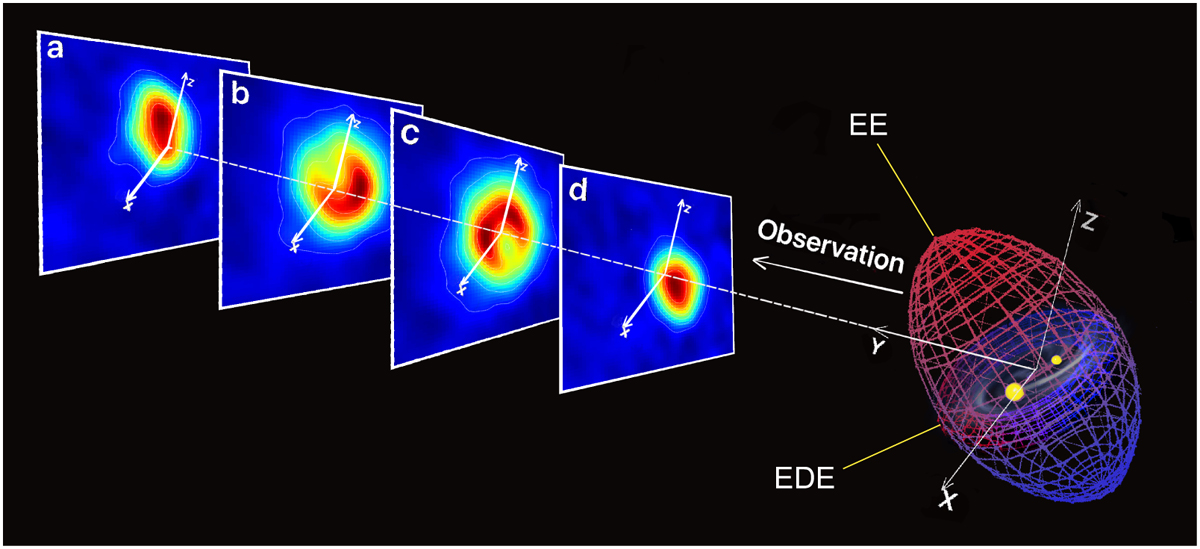
Schematic illustration of the true shape of IRAS 23304+6147. The grid on the right represents the conceptual model consisting of a hypothetical binary star system (filled yellow circles), an EE, and an EDE. The coloration of the grid is defined according to the Doppler effect, i.e., the regions moving away from the observer’s perspective (along the y-axis, as denoted by the arrow below ‘Observation’) are indicated in red, and those moving toward the observer are shown in blue. Four representational velocity slices are shown on the left: a (VLSR = −3 to 3 km s−1), b (VLSR = −16 to −5 km s−1), c (VLSR = −27 to −18 km s−1), and d (VLSR = −40 to −29 km s−1). The nebula is projected onto the X–Z plane (the sky plane). From the observer’s perspective, from the far to near sides, the EE is first seen in channel a and progresses toward d, while the EDE shifts from channel b to c.
Current usage metrics show cumulative count of Article Views (full-text article views including HTML views, PDF and ePub downloads, according to the available data) and Abstracts Views on Vision4Press platform.
Data correspond to usage on the plateform after 2015. The current usage metrics is available 48-96 hours after online publication and is updated daily on week days.
Initial download of the metrics may take a while.