Fig. 7

Download original image
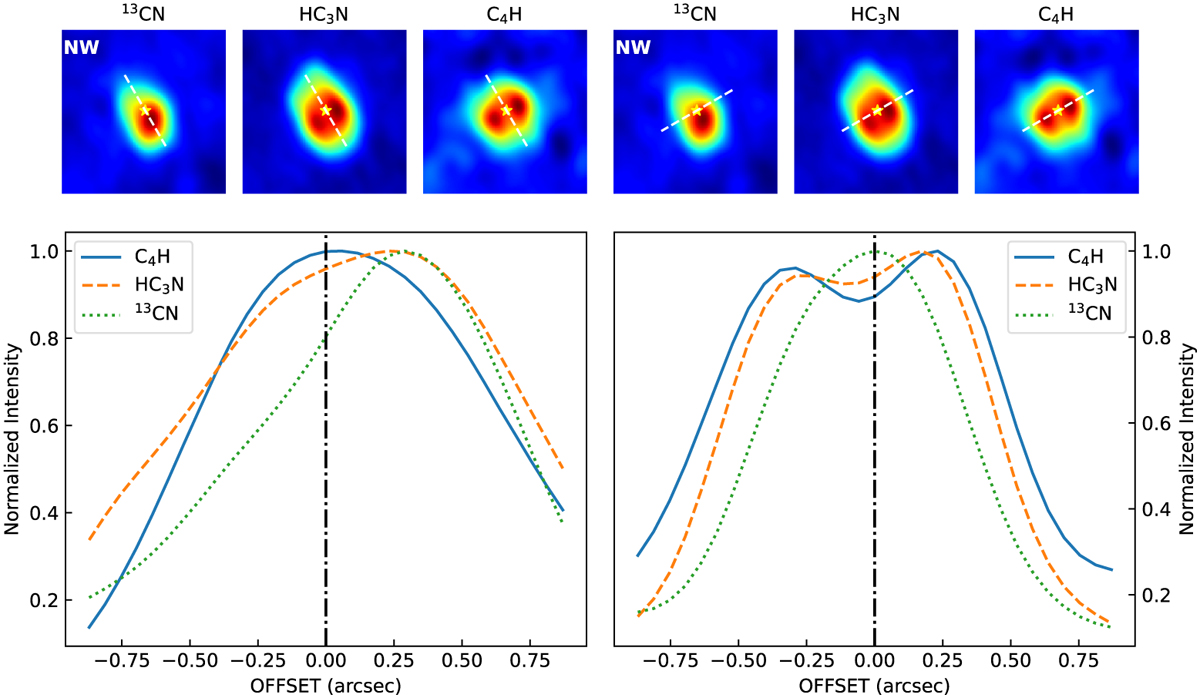
Spatial distributions of the 13CN, HC3N, and C4H molecules. The NW direction is marked in the upper left corner of the 13CN map. The left panels show the molecular line intensity distributions in the major-axis direction, tracking a path from NW to SE (the offset changes from negative to positive) at a PA of 30° relative to the NS direction. The right panels show the molecular line intensity distributions in the minor-axis direction, tracking a path from SW to NE (the offset changes from negative to positive) at a PA of 60°. In the upper panels, the dashed lines denote the paths along which the line intensity profiles are extracted. The positions of the phase centers are denoted by the pentagrams in the upper panels and the vertical dashed lines in the lower panels.
Current usage metrics show cumulative count of Article Views (full-text article views including HTML views, PDF and ePub downloads, according to the available data) and Abstracts Views on Vision4Press platform.
Data correspond to usage on the plateform after 2015. The current usage metrics is available 48-96 hours after online publication and is updated daily on week days.
Initial download of the metrics may take a while.


