Fig. 6
Download original image
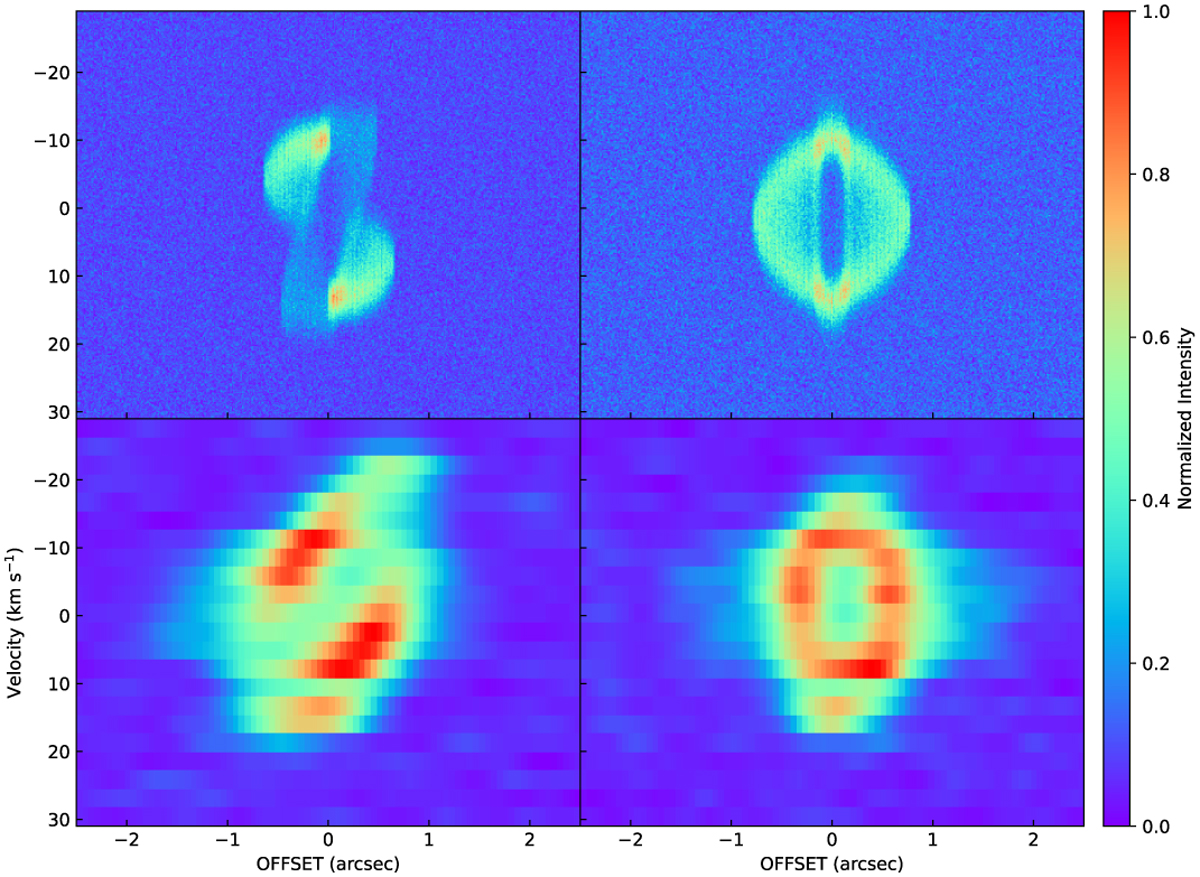
P-V diagrams of the 13CO J = 2–1 transition derived from the modeling (upper panels) and observations (lower panels). The left panels present the velocity structure along the major axis of the EE, oriented from NW to SE, where negative offsets indicate the NW direction. The right panels show the velocity structure along the minor axis, oriented from SW to NE, with negative offsets corresponding to the SW direction. The cuts we used to extract these diagrams are detailed in Fig. 4.
Current usage metrics show cumulative count of Article Views (full-text article views including HTML views, PDF and ePub downloads, according to the available data) and Abstracts Views on Vision4Press platform.
Data correspond to usage on the plateform after 2015. The current usage metrics is available 48-96 hours after online publication and is updated daily on week days.
Initial download of the metrics may take a while.