Fig. 4
Download original image
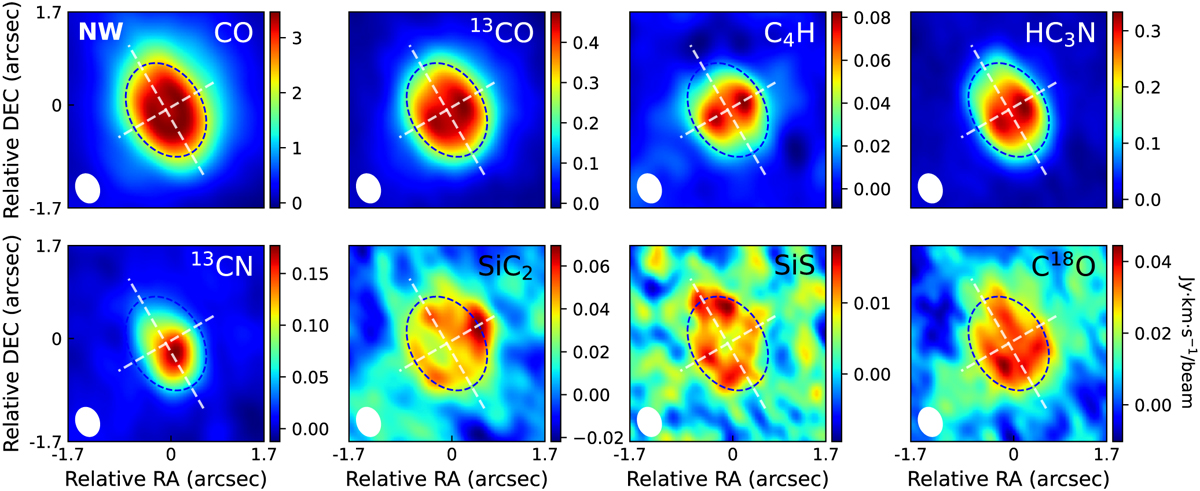
Integrated-intensity (moment-zero) maps of the molecular lines detected in IRAS 23304+6147. The white ellipse in the lower corner represents the synthesized beam. For convenience, the dashed elliptical circles in each panel indicate the main CO emission region, whose semimajor (PA = 30°) and minor axis (PA = 60°) are 1.16″ and 0.84″, and the dashed straight lines mark the size of the extended CO halo. The NW direction is marked in the upper left corner of the CO map.
Current usage metrics show cumulative count of Article Views (full-text article views including HTML views, PDF and ePub downloads, according to the available data) and Abstracts Views on Vision4Press platform.
Data correspond to usage on the plateform after 2015. The current usage metrics is available 48-96 hours after online publication and is updated daily on week days.
Initial download of the metrics may take a while.