| Issue |
A&A
Volume 693, January 2025
|
|
|---|---|---|
| Article Number | A317 | |
| Number of page(s) | 9 | |
| Section | Galactic structure, stellar clusters and populations | |
| DOI | https://doi.org/10.1051/0004-6361/202452962 | |
| Published online | 29 January 2025 | |
Unveiling the binary nature of NGC 2323
1
Astrophysics Division, Shanghai Astronomical Observatory, Chinese Academy of Sciences,
80 Nandan Road,
Shanghai
200030,
PR China
2
School of Astronomy and Space Science, University of Chinese Academy of Sciences,
No. 19A, Yuquan Road,
Beijing
100049,
PR China
3
Institut de Ciències del Cosmos, Universitat de Barcelona (ICCUB),
Martí i Franquès 1,
08028
Barcelona,
Spain
4
School of Physics and Astronomy, Sun Yat-sen University,
Daxue Road,
Zhuhai
519082,
China
5
CSST Science Center for the Guangdong-Hong Kong-Macau Greater Bay Area,
Zhuhai
519082,
China
6
Astronomisches Rechen-Institut, Zentrum für Astronomie der Universität Heidelberg,
Mönchhofstr. 12–14,
69120
Heidelberg,
Germany
7
Departament de Física Quàntica i Astrofísica (FQA), Universitat de Barcelona (UB),
C Martí i Franquès 1,
08028
Barcelona,
Spain
8
Institut d’Estudis Espacials de Catalunya (IEEC),
Edifici RDIT, Campus UPC,
08860
Castelldefels (Barcelona),
Spain
9
Xinjiang Astronomical Observatory, Chinese Academy of Sciences,
Urumqi
830011,
China
10
School of Physics and Astronomy, China West Normal University,
No. 1 Shida Road,
Nanchong
637002,
China
★ Corresponding authors; This email address is being protected from spambots. You need JavaScript enabled to view it.
; This email address is being protected from spambots. You need JavaScript enabled to view it.
Received:
11
November
2025
Accepted:
17
December
2024
Abstract
Context. As a well-known open cluster, NGC 2323 (also called M50) has been widely investigated for over a hundred years and has always been considered a classical single cluster.
Aims. We studied the binary structure nature of NGC 2323 with Gaia Data Release 3 (DR3).
Methods. We discovered the binary structure of NGC 2323 by the HDBSCAN algorithm based on the astrometric and photometric data from Gaia DR3. Then we employed the PETAR N-body code to investigate its binary structure origin.
Results. We found that NGC 2323 consists of two distinct subclusters (NGC 2323-a and NGC 2323-b) that are still gravitationally bound. They have very close positions (three-dimensional Δpos = 12.3 pc, σΔpos = 3.4 pc) and similar tangential velocities (two-dimensional ΔV = 2.2 km s−1, σΔV = 0.02 km s−1). The best isochrone fitting ages of the two clusters are the same (158 Myr), further proving their possibly common origin. The numerical N-body simulation suggests that the less massive cluster is unlikely to be the cluster tidal tails created by the differential rotation of the Milky Way.
Key words: open clusters and associations: general / open clusters and associations: individual: NGC 2323
© The Authors 2025
 Open Access article, published by EDP Sciences, under the terms of the Creative Commons Attribution License (https://creativecommons.org/licenses/by/4.0), which permits unrestricted use, distribution, and reproduction in any medium, provided the original work is properly cited.
This article is published in open access under the Subscribe to Open model. This email address is being protected from spambots. You need JavaScript enabled to view it. to support open access publication.
1 Introduction
Open clusters (OCs) are born in giant molecular clouds (Lada & Lada 2003), most of which are isolated stellar systems (Conrad et al. 2017), and in some cases are also formed in groups, such as binary clusters or higher-order systems (Camargo et al. 2016). Observed diverse OC groups or complexes provide an ideal laboratory for studying the physical principles underlying the hierarchical structure of star-forming regions (Larson 1981; Bonnell et al. 2003; Pang et al. 2022). At the same time, exploring OC groups can help us to understand the extension of the hierarchical star formation process to larger galactic scales (Elmegreen & Efremov 1996).
de la Fuente Marcos & de la Fuente Marcos (2009) summarized several formation channels of binary clusters. The co-formation scenario suggests that binary clusters are genetic or primordial pairs that are formed from the same molecular cloud and share the same velocity, age, and metallicity (Fujimoto & Kumai 1997; Bekki et al. 2004), such as the extensively studied h and χ Persei pair (NGC 869/NGC 884) (Slesnick et al. 2002; Zhong et al. 2019). Another scenario is that the stellar winds or supernova shocks would induce the collapse of the cloud and the sequential formation of a companion cluster (Brown et al. 1995), resulting in different ages but similar velocities of the binary clusters. The tidal capture mechanism proposed that two clusters with small relative velocities may be tidally captured and even merge when encountering each other (de la Fuente Marcos & de la Fuente Marcos 2009). They are possibly not primordial; therefore, significant age and chemical composition differences can be observed, such as the recently discovered colliding binary clusters IC 4665 and Collinder 35 (Piatti & Malhan 2022).
de la Fuente Marcos & de la Fuente Marcos (2010) investigated the evolution of primordial binary clusters through N -body simulation, including mergers, shredded secondaries, and separated twins, while the evolution outcome is associated with the initial orbital elements and mass ratio of the cluster pairs. They also demonstrated that primordial binary clusters are not stable for a long time, which is consistent with the observational results of Casado (2021, 2022). Primordial binary clusters are prone to disintegration or merger due to dynamic evolution, which leads to an apparent lack of binary clusters in the Milky Way (Subramaniam et al. 1995; de la Fuente Marcos & de la Fuente Marcos 2009).
Before the Gaia era, reliable cluster member selection was fairly difficult, due to the limited astrometric precision, which made identifying and exploring binary star clusters difficult. Based on the distance separation criterion (≤30 pc), de la Fuente Marcos & de la Fuente Marcos (2009) selected 34 pairs with WEBDA1 and 27 pairs with NCOVOCC2 and obtained the binary cluster fraction of 12%, which is comparable to that in the Magellanic Clouds. By adding kinematic information, Conrad et al. (2017) applied the Friends-of-Friends algorithm with linking length 100 pc in spatial space and 10 km s−1 in velocity space, and detected 19 groups including 14 pairs.
Gaia (Gaia Collaboration 2018, 2021, 2023) presents, in unprecedented high-precision, five astrometric parameters (α, δ, ϖ,  , µδ) and three-band photometry (G, GBP , and GRP ). Radial velocity data are also in the released catalog (Katz et al. 2019, 2023). As one of the most successful and ambitious projects, Gaia enabled the increasing discovery of new OCs (Cantat-Gaudin et al. 2018, 2020; Liu & Pang 2019; Castro-Ginard et al. 2020, 2022; Qin et al. 2021, 2023; He et al. 2022; Hunt & Reffert 2021, 2023), promoting the growing exploration of binary clusters (Soubiran et al. 2019; Casado 2021; Angelo et al. 2022; Piatti & Malhan 2022; Song et al. 2022; Qin et al. 2023; Casado & Hendy 2023). Particularly, Qin et al. (2023) discovered 324 clusters with a data slicing method based on Gaia Data Release 3 (DR3), of which 101 are new clusters. As the most complete open cluster sample in the solar neighborhood to date, a total of 19 binary clusters and three triple clusters have been identified, with a spatial separation of less than 20 pc, a velocity difference of less than 5 km s−1 , and similar ages.
Based on Gaia DR3, we serendipitously found that the famous cluster NGC 2323 (M50) is, in its nature, probably a binary cluster. NGC 2323, located in the Monoceros region of the Milky Way, was first discovered by Giovanni Cassini before 1709, and was later compiled in the Messier catalog by Charles Messier. NGC 2323 was widely perceived as an isolated star cluster in the literature. Early studies of NGC 2323 presented its distance varying from 500 to 1230 pc (Trumpler 1930; Shapley 1930; Collinder 1931; Cuffey 1941; Hoag et al. 1961; Kalirai et al. 2003) and age ranging from 60 to 180 Myr (Barbaro et al. 1969; Claria et al. 1998; Kalirai et al. 2003; Frolov et al. 2012; Kharchenko et al. 2013; Amin & Elsanhoury 2017). Since the Gaia data release, NGC 2323 has still been identified as a single OC in the most updated OC catalogs (Cantat-Gaudin et al. 2018, 2020; Sim et al. 2019; Hunt & Reffert 2023). Incorporating Gaia Data Release 2 and UBV photometric data from the ground-based instrument, Oralhan et al. (2019) estimated the metallicity (Z = 0.012) of NGC 2323 via the δ(U − B) technique.
However, with the help of precise astrometric and photometric Gaia data, we can now reveal the nature of NGC 2323: it is probably a pair of primordial binary clusters. In Sect. 2, we confirm the true existence of the binary structures in NGC 2323 and investigate their properties. In Sect. 3, we discuss the possible origin of the binary structures, including binary cluster and tidal tail scenarios. A summary of this work is given in Sect. 4.
2 Discovery of the binary structure
By employing the Hierarchical Density-Based Spatial Clustering of Applications with Noise (HDBSCAN) algorithm, Hunt & Reffert (2023) identified 7200 clusters with Gaia DR3, while the latest property parameters of NGC 2323 (α, δ,  ,
,  , µδ ,
  , ϖ, Sϖ , Rtot) were included in their catalog. With the members of NGC 2323 from their catalog, we found two overdensities in the proper motion distribution, as shown in Fig. 1. Meanwhile, we used the Gaussian Mixture Models (GMM; Pizzolato et al. 2003) from the scikit-learn3 Python package to determine the number of mixture components (n_components) in the proper motion space, with n_components ranging from 1 to 5. We obtained the smallest Bayesian information criterion (BIC) value when n_components is equal to 2, which also indicates the existence of binary structure in NGC 2323.
To study the binary structure in the NGC 2323 region, we retrieved the member stars referring to those parameters of NGC 2323 in Hunt & Reffert (2023) and then re-investigated the properties of this star cluster. The selection criteria of astrometric and photometric data from the Gaia Archive4 based on the cluster properties5 are as follows:
Centering on the approximate central position (α, δ) with a radius of Rtot ;
Proper motion selection:

Parallax selection: ϖ ± 3 ⋅ sϖ;
G < 20 mag.
With the initial sample, we tried min_cluster_size (mclS iɀe) from 2 to 60 (step = 1) of the HDBSCAN algorithm (McInnes et al. 2017) in the proper motion space. The key parameter mclS iɀe refers to the minimum number of samples in a group that is considered a cluster. For small mclS iɀe values, the algorithm is sensitive enough to identify many small clusters, while some small clusters get merged when increasing mclS iɀe . In this cluster sample, the true cluster number and the cluster member results remain stable when mclS iɀe reaches 27, as shown in Fig. 2. Hence, we adopted mclS iɀe = 27 as an optimal parameter to perform the HDBSCAN (McInnes et al. 2017) clustering process. As a result, we identified two components, named NGC 2323-a and NGC 2323-b, and obtained 519 and 139 members, respectively. In the upper left panel of Fig. 3 it can be seen that these two overdensities are located very close in the projection spatial space (NGC 2323-a has more members and is more concentrated than NGC 2323-b) and roughly have a similar tangential velocity direction.
Based on their members, we provided the properties for NGC 2323-a and NGC 2323-b as listed in Table 1. We derived the mean and standard deviation values of the positions and proper motions for the two overdensities. Then we calculated the average radial velocity and corresponding uncertainty for each cluster using the same procedure described by Soubiran et al. (2018) and Carrera et al. (2022). The average radial velocity is obtained using the formula
 (1)
(1)
where wi is defined as wi = 1/(ϵi)2, and RVi and ϵi are the radial velocity and corresponding error provided by Gaia DR3 for each member. The RVOC uncertainty is defined as the maximum of  and
and  , and the RVOC weighted standard deviation
  is defined as
 (2)
(2)
and the internal error of RVOC is
 (3)
(3)
To discard stars with discrepant radial velocities with respect to RVOC because of binaries, we iteratively excluded the stars with velocities outside the  . We corrected the parallax zeropoint offsets for all the members (Lindegren et al. 2021) and obtained the mean parallaxes and standard deviation values. Then we assumed that the cluster is very small compared to its distance and adapted an exponential prior and a Gaussian distribution of parallax (Bailer-Jones 2015) to determine the Bayesian distances of 0.954 ± 0.001 kpc for NGC 2323-a and 0.966 ± 0.003 kpc for NGC 2323-b.
To determine other parameters of NGC 2323-a and NGC 2323-b through the color-magnitude diagram (CMD), we downloaded a set of PARSEC isochrones (Marigo et al. 2017) with Gaia photometric system (Riello et al. 2021) from CMD 3.76 to perform the isochrone fitting. The isochrones used for fitting have a grid of logarithm ages from 7.0 to 9.0 with an interval of 0.05 and an abundance of Z = 0.012 (Oralhan et al. 2019). Then we carefully inspected the matching of the isochrones to the characteristic regions, such as the upper main sequence, the turn-off point, and the red giant in the CMDs. We adopted the formula AG = 2.74 × E(B − V) and E(BP − RP) = 1.339 × E(B − V) (Casagrande & VandenBerg 2018) to calculate the reddening values. Finally, by traversing the grid of isochrones in the CMDs, we used the “blue edge” for visual isochrone fitting and obtained the optimal fitted parameters for NGC 2323-a and NGC 2323-b. The age parameters from isochrone fitting are  Myr for NGC 2323-a and
  Myr for NGC 2323- b. Both clusters have the same optimal fitted result with log(age (yr)) = 8.20, distance modulus DM = 10.56 mag, and reddening E(B − V) = 0.26 mag as shown in Fig. 4. We found that the mean distances (both are 938 pc) from isochrone fitting are slightly smaller than the Bayesian distances. This difference may be due to the effect of differential reddening on the visual isochrone-fitting.
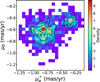 |
Fig. 1 2D histogram of proper motion ( |

Property parameters of NGC 2323-a, NGC 2323-b, and NGC 2323-HR.
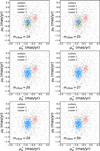 |
Fig. 2 Proper motion ( |

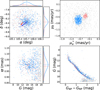 |
Fig. 3 Spatial (α, δ), proper motion ( |

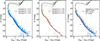 |
Fig. 4 Isochrone fitting of the two components in NGC 2323. The blue and pink dots refer to NGC 2323-a and NGC 2323-b members identified in this work respectively. The black solid lines indicate the best-fitting isochrone, while the gray and green dashed lines denote the isochrones with the lower and upper limits of visually fitted age. |
3 Binary structure origin
Since star clusters form in hierarchically collapsing gas clouds (Cantat-Gaudin et al. 2019; Krause et al. 2020; Pang et al. 2022; Žerjal et al. 2024), the two different clumps in Fig. 3 (close positions and similar yet distinct velocities) illustrate the existence of two clusters in the NGC 2323 region, or the less massive cluster is possibly the tidal tail or sub-structure of the open cluster NGC 2323. Hence, we used N-body simulation to discuss the possible origin of this binary structure.
3.1 Binary cluster
We calculated the mean positions and velocities in Cartesian Galactic coordinates with the Astropy7 package (Astropy Collaboration 2013, 2018; Astropy Collaboration 2022) for the two clusters, as shown in Table 2. We adopted [10, 235, 7] km s−1 and 8.0 kpc as the galactocentric velocities of the Sun and the distance from the Sun to the Galactic center, respectively (Bovy 2015). The mean central positions of the two clusters are close with three-dimensional Δpos = 12.3 pc < 20 pc (σΔpos = 3.4 pc), and the tangential velocity difference between the two clusters is ΔV = 2.2 km s−1 < 5 km s−1 (σΔV = 0.02 km s−1), which suggests that they may be physically associated binary clusters (Subramaniam et al. 1995; Soubiran et al. 2019). In addition, the distribution of the two clusters in the color-magnitude diagram (Fig. 4) indicates that they are coeval.
To trace back the origin of the binary cluster and explore their future dynamical evolution, we exploited numerical N -body simulations for in-depth analysis. At first we derived the basic parameters from the observational data as input parameters for McLuster8 (Küpper et al. 2011), which can be used to generate the two clusters for the following N-body computations. Then, we employed the new high-performance N-body code called PETAR9 (Wang et al. 2020) to conduct numerical simulations of the binary cluster. Finally, based on the results of PETAR, we investigated the kinematic states of the binary cluster at different times.
The star cluster initial model generator McLuster (Küpper et al. 2011) can generate star clusters with various options and parameters. To create a mock cluster, we need to set the input parameters as listed in Table 2, which include a dimensionless value that specifies the King model concentration (W0); the half-mass radius (Rhm); the degree of mass segregation (S); the number of cluster members (N) or the mass of cluster (M); the mass function parameters, which are the user defined two- segment power-law function, the slope of the low-mass part (α1), the slope of the high-mass part (αh), the minimum star mass ( ), and the transition mass between two segments (
 ); the maximum star mass (
 ), the virial ratio (Q), and the binary fraction (fb).
Based on the observational data of the binary cluster, we performed the radial density profile fitting using the king model (King 1962) and obtained their concentration parameters c = rt/rc, where rt refers to the tidal radius and rc refers to the core radius of clusters. According to the correspondence between c and another concentration parameter W0 (King 1966), we derived that W0 equals 3 and 1 respectively for the two clusters. We applied the degree of mass segregation S = 0, 1 for no mass segregation and maximum mass segregation to those density profiles. Then we utilized the best-fitting isochrone in Sect. 2 to acquire the mass of the cluster members (Jiang et al. 2024) with G < 18 mag10 and estimated the half-mass radius for each cluster. At the same time, we respectively derived the low-mass slope α1, high-mass slope αh, and transition mass between two segments  parameters of each cluster using a two-part power-law form (Almeida et al. 2023). We note that the two white dwarfs (Cummings et al. 2016) in NGC 2323 were not included in our simulation, which would have little effect on our simulations. The total number (Nt_a = 1208, Nt_b = 415) and mass (Mt_a = 827 M⊙, Mt_b = 250 M⊙) of the two clusters including unseen stars were estimated by integrating the extrapolated observed mass function down to the lower mass limit (0.08 M⊙). To derive the dynamic relaxation time of each cluster, we used the formula provided by Binney & Tremaine (1987) for estimation:
 (4)
(4)
Here G is the gravitational constant, N is the total member number, M is the total cluster mass, and rh is the half-mass radius. The dynamic relaxation ages of NGC 2323-a and NGC 2323-b are 69 Myr and 85 Myr, respectively. Considering that the ages of both clusters are older than their relaxation ages, the binary cluster has evolved to a relaxation state. Kalirai et al. (2003) also suggested that NGC 2323 is somewhat dynamically relaxed (trelaxed = 102 Myr, tage = 130 Myr). Hence, we assumed that they are both in virial equilibrium (Q = 0.5). The binary fraction of our mock clusters is adopted as a typical fraction value of 30% (Li & Shao 2022). Based on these parameters (listed in Table 2), we utilized the McLuster (Küpper et al. 2011) code to simulate the two clusters. We note that the total mass discrepancies between the simulated star clusters (S = 0, 1) and the actual clusters (extrapolated observed mass function) are about 3.1% and 4.5%, which indicates that the mock clusters have a high similarity to the observational clusters in total mass.
It is difficult to simulate the dynamical evolution of the binary clusters from their birth time because we cannot directly observe the initial state of the clusters, such as the initial total mass, the initial mass function, the initial mass segregation, the initial density profile, the initial velocity distribution, and the initial position in the Milky Way. Hence, we treated the two mock clusters as two mass points to integrate their orbits in the past. The gravitational interaction between them in the Milky Way was considered with PETAR (Wang et al. 2020). However, the stellar evolution option was turned off during the simulation. We used the positions and velocities of the binary cluster in Cartesian Galactic coordinates at the present day (see Sect. 2) to trace back the orbits of the binary cluster to their birthplaces. Finally, PETAR provided the positions and velocities of each mass point with a time interval of 0.5 Myr. Figure 5 shows their orbital separation (black line) from the birth time (−158 Myr) to the present day (0 Myr). Through the simplified simulation with cluster mean property parameters, we found that the two clusters were physically separated by a distance of 27.2 pc at their birthplaces, which is smaller than the typical size of the molecular cloud (100 pc; Heyer & Dame 2015). This indicates that they may have been born from the same molecular cloud.
To check whether the simplified assumptions in the backward simulation are justified, we applied the forward simulation (including stellar formation) of the binary cluster from 158 Myr ago to the present day. However, the initial cluster mass, the initial mass function, the initial mass segregation, and the initial density profile are unknown. For simplicity, we assumed that the initial mass and density distributions are the same as the distributions at present. Figure 5 illustrates the backward and forward orbital separation distributions. The two distributions (black line and green dashed line) exhibit similar oscillatory patterns, although the difference becomes discernible at the cluster age of about 80 Myr. The separation at the present day between the two clusters obtained from the forward simulation is 22.1 pc with a 9.8 pc discrepancy compared to the observation. We regard it rational to trace back the orbit of the binary cluster under the simplified assumption of mass points using PETAR.
Using the mock clusters as input samples, we simulated the future dynamical evolution state of the binary cluster with PETAR (Wang et al. 2020), which is quite different from the backward simulation under the simplifying assumption of point mass. The simulation started from the gas-free phase, and only particle-like stellar components were contained during the modeling. The evolution of the binary cluster is controlled by the combination of single stellar evolution (SSE) and binary stellar evolution (BSE) (Hurley et al. 2000, 2002; Banerjee et al. 2020), stellar interaction, and the external Galactic potential (Bovy 2015). Since the maximum mass of the mock cluster members is 4.26 M⊙, and the evolution of 99.8% stars within 158 Myr (from birth to the present) is still in the main-sequence stage, which also means the impact of stellar wind loss on the cluster dynamical state can be ignored. The actual central mean positions (X, Y, Z) and orbital velocities (U, V, W) of the binary cluster in the Galactic tidal field are listed in Table 2. The metallicity of the binary cluster was set as Z = 0.012 (Oralhan et al. 2019) for stellar evolution. In the simulation process, the binary cluster was set to evolve from the present day (cluster age at now Ta = 158 Myr) to 200 Myr (cluster age = 358 Myr), generating output snapshots with a time interval of 0.5 Myr, which included the Galactic positions and velocities of each star.
Figure 5 presents the separation distance between the two clusters’ centroids as a function of time. In summary, the future evolutionary process (blue and red lines) of the binary cluster can be divided into two stages. During the first 100 Myr, due to the distance between the two clusters being small enough, they rotate with each other, and their separation distance oscillates with a variation of less than 50 pc. The two clusters undoubtedly constitute a binary cluster and exhibit interaction during this dynamic stage. At 45 Myr, the minimum distance between cluster centroids is only 8.6 pc. We note that, because of the gravitational interaction between the two clusters, the small mass cluster (NGC 2323-b) gradually expands after the close encounter occurs at 45 Myr, resulting in a change in the mass of NGC 2323-b. At the time of 100 Myr, since NGC 2323-b will expand into a looser cluster (approximately 20% of stars are stripped outside the tidal radius of the cluster), the two clusters lack sufficient mass to remain gravitationally bound to each other, causing them to drift apart gradually. Then, from 100 Myr to 200 Myr, the separation distance between the two clusters becomes larger and larger, promoting them to evolve independently along their orbits in the Milky Way, ultimately becoming two isolated star clusters separated by hundreds of parsecs. We also found that the influence of mass segregation (S = 1) on the dynamic evolution of the binary cluster is feeble for cluster ages <200 Myr: the presence or absence of mass segregation does not affect the separation distance of the cluster.
Overall, the evolution of the binary cluster with their mean properties can be divided into two different dynamical states: one is the phase of being bound by the cluster’s gravitational potential, and the two clusters evolving together as a binary cluster to undergo dynamical interaction; the other is the orbital motion that occurs after the two clusters break free from their joint gravitational constraints, being solely influenced by the gravitational potential of the Milky Way. The binary cluster evolves into two isolated open clusters in a few hundred million years.
Moreover, we repeated the backward and forward simulations 500 times with Markov chain Monte Carlo (MCMC) algorithms (Kalos 1986; Tierney 1994), sampling over the measured uncertainties in the 3D positions and velocities, as shown in Table 1. The numerical simulations with different sampling parameters are displayed in Fig. 5. Figure 6 exhibits the orbital separations at birth time and at 200 Myr, which gives many possibilities of the origin and future evolution of the two clusters. We can see that the orbital separations for both backward and forward simulations are not very robust, demonstrating that the N-body simulation of the two clusters is sensitive to the initial parameters. The median values of the orbital separations are about 300 pc at birth time and 260 pc at 200 Myr. We used the scipy package11 with gamma function to fit the three probability density distributions in Fig. 6. The mode values we obtained from the gamma fitting are 75.1 ± 26.2 pc, 60.9 ± 23.6 pc, and 59.4 ± 23.8 pc.
To investigate the interaction and morphological characteristic of the two clusters with the mean property parameters, we plot the snapshots at different times in Fig. 7, including 0 Myr (Ta + 0 Myr), 100 Myr (Ta + 100 Myr), and 200 Myr (Ta + 200 Myr), where Ta is the cluster age at present time (Ta = 158 Myr). The snapshot of 0 Myr is consistent with the observational data, presenting the morphological characteristics of a typical star cluster. The separation distance between the cluster centroids is about 12.3 pc at the present day, and the relative velocity direction of the two clusters is parallel, indicating that the interaction between them is not strong, so it is unlikely that they will eventually merge into one cluster. At the snapshot of 100 Myr, the less massive cluster NGC 2323-b gradually expands after flying over another cluster NGC 2323-a several times. As the expansion of the cluster NGC 2323-b continues, its mass experiences a moderate loss, leading to the end of the interacting binary cluster stage. Eventually, when the two clusters evolve to the time of 200 Myr, they happen to complete one orbital period in the Milky Way. However, they will become two disconnected single clusters with significant tidal tails extending to about 300 pc and a separation distance reaching 150 pc.
Initial parameters for McLuster.
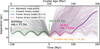 |
Fig. 5 Backward (black line), forward (green dashed line), and future orbital separation (blue line with mass segregation degree S = 0 and red dashed line with mass segregation degree S = 1) simulated by using PETAR with mean property parameters for the binary cluster. The light shaded curves correspond to the orbits simulated with MCMC sampling over the measured uncertainties in 3D positions and velocities. |
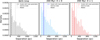 |
Fig. 6 Histogram of orbital separation at birth time and at 200 Myr (cluster with mass segregation S = 0 and 1). The black line, blue line, and red dashed line represent the orbital separation for the two clusters with mean property parameters (corresponding to the lines in Fig. 5), and the dash-dotted lines refer to the mode values of orbital separations for clusters fitted with a gamma function. The dotted lines refer to the median values of orbital separations for clusters with MCMC sampling parameters. The dash-dotted lines represent the mode values from the gamma fitting of the density distributions. |
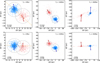 |
Fig. 7 Future evolution of the two clusters (blue line in Fig. 5): snapshots at the present day (cluster age = Ta = 158 Myr), 100 Myr (cluster age = Ta + 100 Myr), 200 Myr (cluster age = Ta + 200 Myr) in the X–Y plane (top) and the X–Z plane (bottom) for the binary clusters with mass segregation degree S = 0. The blue and pink points refer to the members of NGC 2323-a and NGC 2323-b, respectively; the blue and red arrows indicate the relative velocities. Here the relative velocities are the velocities relative to the average velocity of the two clusters. The size of the points represents the stellar mass. The dotted and dashed circles represent the tidal radius of NGC 2323-a and NGC 2323-b. The orange dashed lines represent the line-of-sight direction. |
3.2 Tidal tail
It is well known that the tidal tails of open clusters may be created by the tidal forces from the Milky Way potential or a nearby massive object (Röser et al. 2019; Zhang et al. 2020; Jerabkova et al. 2021; Wang & Jerabkova 2021; Boffin et al. 2022; Bai et al. 2022). It is worth mentioning that Bai et al. (2022) documented a tidal structure stretching to around 270 pc of the nearby cluster COIN-Gaia 13 (cluster age 250 Myr), while Boffin et al. (2022) similarly observed a 260 pc long tidal tail of the open cluster NGC 752 (cluster age 1–2 Gyr). These tidal tails are mainly torn by the differential rotation induced by the Galactic potential. Similarly, the less massive cluster in this work is possibly the tidal tail of NGC 2323. Here we employed N-body simulation to check whether this single cluster NGC 2323 could have developed tidal tails in the Milky Way since its birth.
We assumed that NGC 2323 was born as an isolated cluster, and used an approach similar to that described in Sect. 3.1 to mock this single cluster at birth time with the McLuster package (Küpper et al. 2011). The initial state of the cluster is set as the simulated initial state of the cluster 158 Myr ago from backward simulation. To check whether NGC 2323 would develop tidal tails after 158 Myr, we simulated its dynamical evolution in the Milky Way from the birth time to the present day with PETAR (Wang et al. 2020). The position and proper motion distributions at the present day are presented in Figs. 8 and 9. This cluster forms a tidal tail (blue points); however, we can see that the proper motion distribution at the present day exhibits a single concentration, which is different from what we observed with Gaia DR3. We note that some stars, color-coded in green, have higher relative velocities (velocities relative to the cluster mean velocities), which are caused by the orbital motion of binary stars. Because the upper age of this cluster from isochrone fitting is 281 Myr in Sect. 2, we set the simulation time as 281 Myr. However, there are still not two concentrations in the proper motion distribution of the tail and core members at 281 Myr from the N-body simulation. The two distinct clumps or concentrations in the proper motion distribution in Fig. 3 demonstrate that the less massive cluster is unlikely to be the tidal tails of this young open cluster NGC 2323, which are torn by the Galactic potential. However, we cannot exclude the possibility that this component may be caused by a nearby massive object, and further numerical simulations are needed to investigate this in the future.
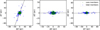 |
Fig. 8 Distributions (∆X-∆Y, ∆X-∆Z, ∆Y-∆Z) of the members for the simulated single cluster NGC 2323 at the present day in Galactic coordinates. The green and blue points refer to the stars inside and outside the cluster tidal radius (rtid = R(Moc/3MMW)1/3 (King 1962; Kroupa et al. 2022), where Moc and MMW refer to the masses of the cluster and the Milky Way, and R represents the distance of the cluster from the Galactic center. The black dashed lines are the line-of-sight direction; ∆X, ∆Y, and ∆Z are calculated relative to the cluster center. |
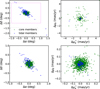 |
Fig. 9 Spatial (∆α, ∆δ) and proper motion ( |


4 Summary
Based on the spatial and proper motion distributions provided by Gaia DR3, we discovered that the well-known open cluster NGC 2323 has a binary structure, which might be classified as a binary cluster containing two individual components, NGC 2323-a and NGC 2323-b, or a cluster with tidal tails created by a nearby massive object. Further investigation of the cluster properties shows that the two components are located very close to each other (three-dimensional ∆pos = 12.3 pc) and have similar yet discernible kinematics (two-dimensional ∆V = 2.2 km s−1) and the same age (158 Myr), which indicates they may have a common origin and may currently be in physical interaction.
The close positions and similar velocities of the two structures suggest that NGC 2323 is probably a binary cluster. To obtain a comprehensive understanding of the formation and evolution of this binary cluster, we employed PETAR to trace back their birthplace and deduce their dynamical evolutionary fate. Our work shows that the two clusters may have been born in primordial pairs with a separation of about 27.2 pc and then orbited each other as a binary cluster. In the future, undergoing multiple flyovers with each other, the smaller cluster (NGC2323-b) will gradually expand and lose some of its stellar mass. Then, about 300 Myr later, the two constituent parts of the binary cluster may drift apart and eventually evolve into two independent clusters.
Assuming that NGC 2323 was born as an isolated cluster, we simulated the dynamical evolution of NGC 2323 with PETAR to check whether it would develop tidal tails within 158 Myr. We compared the property distributions of simulation with those of observation, especially the proper motion distribution, which indicates that the less massive cluster is unlikely to be the cluster tidal tails torn by the differential rotation of the Milky Way. However, this component may have been created by a nearby massive object. More future simulations are needed to further investigate this subject.
Acknowledgements
We express our gratitude to the anonymous referee for their valuable comments and suggestions, which are very helpful in improving our manuscript. This work is supported by the National Natural Science Foundation of China (NSFC) through grants 12090040, 12090042, 12073060, 21BAA00619, 12073090, and 12233013. J.Z. would like to acknowledge the Youth Innovation Promotion Association CAS, the science research grants from the China Manned Space Project with No. CMS-CSST-2021-A08, the Science and Technology Commission of Shanghai Municipality (Grant No. 22dz1202400), and Sponsored by the Program of Shanghai Academic/Technology Research Leader. L.W. thanks the one-hundred-talent project of Sun Yat-sen University, the Fundamental Research Funds for the Central Universities, Sun Yat-sen University (22hytd09). K.W. would like to acknowledge the support from the DFG grant Sp 345/24-1. S.Q. acknowledges the financial support provided by the China Scholarship Council program (Grant No. 202304910547). This work was partially funded by the Spanish MICIN/AEI/10.13039/501100011033 and by the “ERDF A way of making Europe” funds by the European Union through grant PID2021-122842OB-C21, and the Institute of Cosmos Sciences University of Barcelona (ICCUB, Unidad de Excelencia ‘María de Maeztu’) through grant CEX2019-000918-M. FA acknowledges financial support from MCIN/AEI/10.13039/501100011033 and European Union NextGener- ationEU/PRTR through grant RYC2021-031638-I. This work has made use of data from the European Space Agency (ESA) mission Gaia (https://www.cosmos.esa.int/gaia), processed by the Gaia Data Processing and Analysis Consortium (DPAC, https://www.cosmos.esa.int/web/gaia/dpac/consortium). Funding for the DPAC has been provided by national institutions, in particular, the institutions participating in the Gaia Multilateral Agreement.
References
- Almeida, A., Monteiro, H., & Dias, W. S. 2023, MNRAS, 525, 2315 [NASA ADS] [CrossRef] [Google Scholar]
- Amin, M. Y., & Elsanhoury, W. H. 2017, Serb. Astron. J., 194, 59 [NASA ADS] [CrossRef] [Google Scholar]
- Angelo, M. S., Santos, J. F. C., Maia, F. F. S., & Corradi, W. J. B. 2022, MNRAS, 510, 5695 [CrossRef] [Google Scholar]
- Astropy Collaboration (Robitaille, T. P., et al.) 2013, A&A, 558, A33 [NASA ADS] [CrossRef] [EDP Sciences] [Google Scholar]
- Astropy Collaboration (Price-Whelan, A. M., et al.) 2018, AJ, 156, 123 [Google Scholar]
- Astropy Collaboration (Price-Whelan, A. M., et al.) 2022, ApJ, 935, 167 [NASA ADS] [CrossRef] [Google Scholar]
- Bai, L., Zhong, J., Chen, L., Li, J., & Hou, J. 2022, Res. Astron. Astrophys., 22, 055022 [CrossRef] [Google Scholar]
- Bailer-Jones, C. A. L. 2015, PASP, 127, 994 [Google Scholar]
- Banerjee, S., Belczynski, K., Fryer, C. L., et al. 2020, A&A, 639, A41 [NASA ADS] [CrossRef] [EDP Sciences] [Google Scholar]
- Barbaro, G., Dallaporta, N., & Fabris, G. 1969, Ap&SS, 3, 123 [NASA ADS] [CrossRef] [Google Scholar]
- Bekki, K., Beasley, M. A., Forbes, D. A., & Couch, W. J. 2004, ApJ, 602, 730 [NASA ADS] [CrossRef] [Google Scholar]
- Binney, J., & Tremaine, S. 1987, Galactic dynamics (Princeton: Princeton University Press) [Google Scholar]
- Boffin, H. M. J., Jerabkova, T., Beccari, G., & Wang, L. 2022, MNRAS, 514, 3579 [NASA ADS] [CrossRef] [Google Scholar]
- Bonnell, I. A., Bate, M. R., & Vine, S. G. 2003, MNRAS, 343, 413 [NASA ADS] [CrossRef] [Google Scholar]
- Bovy, J. 2015, ApJS, 216, 29 [NASA ADS] [CrossRef] [Google Scholar]
- Brown, J. H., Burkert, A., & Truran, J. W. 1995, ApJ, 440, 666 [NASA ADS] [CrossRef] [Google Scholar]
- Camargo, D., Bica, E., & Bonatto, C. 2016, MNRAS, 455, 3126 [Google Scholar]
- Cantat-Gaudin, T., Jordi, C., Vallenari, A., et al. 2018, A&A, 618, A93 [NASA ADS] [CrossRef] [EDP Sciences] [Google Scholar]
- Cantat-Gaudin, T., Jordi, C., Wright, N. J., et al. 2019, A&A, 626, A17 [NASA ADS] [CrossRef] [EDP Sciences] [Google Scholar]
- Cantat-Gaudin, T., Anders, F., Castro-Ginard, A., et al. 2020, A&A, 640, A1 [NASA ADS] [CrossRef] [EDP Sciences] [Google Scholar]
- Carrera, R., Casamiquela, L., Carbajo-Hijarrubia, J., et al. 2022, A&A, 658, A14 [NASA ADS] [CrossRef] [EDP Sciences] [Google Scholar]
- Casado, J. 2021, Astron. Rep., 65, 755 [NASA ADS] [CrossRef] [Google Scholar]
- Casado, J. 2022, Universe, 8, 113 [NASA ADS] [CrossRef] [Google Scholar]
- Casado, J., & Hendy, Y. 2023, MNRAS, 521, 1399 [NASA ADS] [CrossRef] [Google Scholar]
- Casagrande, L., & VandenBerg, D. A. 2018, MNRAS, 479, L102 [NASA ADS] [CrossRef] [Google Scholar]
- Castro-Ginard, A., Jordi, C., Luri, X., et al. 2020, A&A, 635, A45 [NASA ADS] [CrossRef] [EDP Sciences] [Google Scholar]
- Castro-Ginard, A., Jordi, C., Luri, X., et al. 2022, A&A, 661, A118 [NASA ADS] [CrossRef] [EDP Sciences] [Google Scholar]
- Claria, J. J., Piatti, A. E., & Lapasset, E. 1998, A&AS, 128, 131 [Google Scholar]
- Collinder, P. 1931, Ann. Observ. Lund, 2, B1 [Google Scholar]
- Conrad, C., Scholz, R. D., Kharchenko, N. V., et al. 2017, A&A, 600, A106 [NASA ADS] [CrossRef] [EDP Sciences] [Google Scholar]
- Cuffey, J. 1941, ApJ, 94, 55 [NASA ADS] [CrossRef] [Google Scholar]
- Cummings, J. D., Kalirai, J. S., Tremblay, P. E., & Ramirez-Ruiz, E. 2016, ApJ, 818, 84 [NASA ADS] [CrossRef] [Google Scholar]
- de la Fuente Marcos, R., & de la Fuente Marcos, C. 2009, A&A, 500, L13 [NASA ADS] [CrossRef] [EDP Sciences] [Google Scholar]
- de la Fuente Marcos, R., & de la Fuente Marcos, C. 2010, ApJ, 719, 104 [CrossRef] [Google Scholar]
- Elmegreen, B. G., & Efremov, Y. N. 1996, ApJ, 466, 802 [NASA ADS] [CrossRef] [Google Scholar]
- Frolov, V. N., Ananjevskaja, Y. K., & Polyakov, E. V. 2012, Astron. Lett., 38, 74 [NASA ADS] [CrossRef] [Google Scholar]
- Fujimoto, M., & Kumai, Y. 1997, AJ, 113, 249 [NASA ADS] [CrossRef] [Google Scholar]
- Gaia Collaboration (Brown, A. G. A., et al.) 2018, A&A, 616, A1 [NASA ADS] [CrossRef] [EDP Sciences] [Google Scholar]
- Gaia Collaboration (Brown, A. G. A., et al.) 2021, A&A, 649, A1 [NASA ADS] [CrossRef] [EDP Sciences] [Google Scholar]
- Gaia Collaboration (Vallenari, A., et al.) 2023, A&A, 674, A1 [NASA ADS] [CrossRef] [EDP Sciences] [Google Scholar]
- He, Z., Li, C., Zhong, J., et al. 2022, ApJS, 260, 8 [NASA ADS] [CrossRef] [Google Scholar]
- Heyer, M., & Dame, T. M. 2015, ARA&A, 53, 583 [Google Scholar]
- Hoag, A. A., Johnson, H. L., Iriarte, B., et al. 1961, Publications of the U.S. Naval Observatory Second Series, 17, 344 [NASA ADS] [Google Scholar]
- Hunt, E. L., & Reffert, S. 2021, A&A, 646, A104 [NASA ADS] [CrossRef] [EDP Sciences] [Google Scholar]
- Hunt, E. L., & Reffert, S. 2023, A&A, 673, A114 [NASA ADS] [CrossRef] [EDP Sciences] [Google Scholar]
- Hurley, J. R., Pols, O. R., & Tout, C. A. 2000, MNRAS, 315, 543 [Google Scholar]
- Hurley, J. R., Tout, C. A., & Pols, O. R. 2002, MNRAS, 329, 897 [Google Scholar]
- Jerabkova, T., Boffin, H. M. J., Beccari, G., et al. 2021, A&A, 647, A137 [NASA ADS] [CrossRef] [EDP Sciences] [Google Scholar]
- Jiang, Y., Zhong, J., Qin, S., et al. 2024, ApJ, 971, 71 [NASA ADS] [CrossRef] [Google Scholar]
- Kalirai, J. S., Fahlman, G. G., Richer, H. B., & Ventura, P. 2003, AJ, 126, 1402 [NASA ADS] [CrossRef] [Google Scholar]
- Kalos, M. H. 1986, Monte Carlo Methods: 1, Basics (New York: Wiley) [CrossRef] [Google Scholar]
- Katz, D., Sartoretti, P., Cropper, M., et al. 2019, A&A, 622, A205 [NASA ADS] [CrossRef] [EDP Sciences] [Google Scholar]
- Katz, D., Sartoretti, P., Guerrier, A., et al. 2023, A&A, 674, A5 [NASA ADS] [CrossRef] [EDP Sciences] [Google Scholar]
- Kharchenko, N. V., Piskunov, A. E., Schilbach, E., Röser, S., & Scholz, R. D. 2013, A&A, 558, A53 [NASA ADS] [CrossRef] [EDP Sciences] [Google Scholar]
- King, I. 1962, AJ, 67, 471 [Google Scholar]
- King, I. R. 1966, AJ, 71, 64 [Google Scholar]
- Krause, M. G. H., Offner, S. S. R., Charbonnel, C., et al. 2020, Space Sci. Rev., 216, 64 [CrossRef] [Google Scholar]
- Kroupa, P., Jerabkova, T., Thies, I., et al. 2022, MNRAS, 517, 3613 [CrossRef] [Google Scholar]
- Küpper, A. H. W., Maschberger, T., Kroupa, P., & Baumgardt, H. 2011, MNRAS, 417, 2300 [Google Scholar]
- Lada, C. J., & Lada, E. A. 2003, ARA&A, 41, 57 [Google Scholar]
- Larson, R. B. 1981, MNRAS, 194, 809 [Google Scholar]
- Li, L., & Shao, Z. 2022, ApJ, 930, 44 [NASA ADS] [CrossRef] [Google Scholar]
- Lindegren, L., Bastian, U., Biermann, M., et al. 2021, A&A, 649, A4 [EDP Sciences] [Google Scholar]
- Liu, L., & Pang, X. 2019, ApJS, 245, 32 [NASA ADS] [CrossRef] [Google Scholar]
- Marigo, P., Girardi, L., Bressan, A., et al. 2017, ApJ, 835, 77 [Google Scholar]
- McInnes, L., Healy, J., & Astels, S. 2017, J. Open Source Softw., 2, 205 [NASA ADS] [CrossRef] [Google Scholar]
- Oralhan, I. A., Michel, R., Schuster, W. J., et al. 2019, J. Astrophys. Astron., 40, 33 [NASA ADS] [CrossRef] [Google Scholar]
- Pang, X., Tang, S.-Y., Li, Y., et al. 2022, ApJ, 931, 156 [NASA ADS] [CrossRef] [Google Scholar]
- Piatti, A. E., & Malhan, K. 2022, MNRAS, 511, L1 [NASA ADS] [CrossRef] [Google Scholar]
- Pizzolato, N., Maggio, A., Micela, G., Sciortino, S., & Ventura, P. 2003, A&A, 397, 147 [NASA ADS] [CrossRef] [EDP Sciences] [Google Scholar]
- Qin, S.-M., Li, J., Chen, L., & Zhong, J. 2021, Res. Astron. Astrophys., 21, 045 [Google Scholar]
- Qin, S., Zhong, J., Tang, T., & Chen, L. 2023, ApJS, 265, 12 [NASA ADS] [CrossRef] [Google Scholar]
- Riello, M., De Angeli, F., Evans, D. W., et al. 2021, A&A, 649, A3 [NASA ADS] [CrossRef] [EDP Sciences] [Google Scholar]
- Röser, S., Schilbach, E., & Goldman, B. 2019, A&A, 621, L2 [NASA ADS] [CrossRef] [EDP Sciences] [Google Scholar]
- Shapley, H. 1930, Flights from chaos; a survey of material systems from atoms to galaxies, adapted from lectures at the College of the city of New York, Class of 1872 foundation (New York, Whittlesey house, McGraw-Hill book company, inc.) [Google Scholar]
- Sim, G., Lee, S. H., Ann, H. B., & Kim, S. 2019, J. Korean Astron. Soc., 52, 145 [NASA ADS] [Google Scholar]
- Slesnick, C. L., Hillenbrand, L. A., & Massey, P. 2002, ApJ, 576, 880 [NASA ADS] [CrossRef] [Google Scholar]
- Song, F., Esamdin, A., Hu, Q., & Zhang, M. 2022, A&A, 666, A75 [NASA ADS] [CrossRef] [EDP Sciences] [Google Scholar]
- Soubiran, C., Cantat-Gaudin, T., Romero-Gómez, M., et al. 2018, A&A, 619, A155 [NASA ADS] [CrossRef] [EDP Sciences] [Google Scholar]
- Soubiran, C., Cantat-Gaudin, T., Romero-Gómez, M., et al. 2019, A&A, 623, C2 [EDP Sciences] [Google Scholar]
- Subramaniam, A., Gorti, U., Sagar, R., & Bhatt, H. C. 1995, A&A, 302, 86 [NASA ADS] [Google Scholar]
- Tierney, L. 1994, Ann. Statist., 22, 1701 [Google Scholar]
- Trumpler, R. J. 1930, Lick Observ. Bull., 420, 154 [CrossRef] [Google Scholar]
- Wang, L., & Jerabkova, T. 2021, A&A, 655, A71 [NASA ADS] [CrossRef] [EDP Sciences] [Google Scholar]
- Wang, L., Iwasawa, M., Nitadori, K., & Makino, J. 2020, MNRAS, 497, 536 [NASA ADS] [CrossRef] [Google Scholar]
- Žerjal, M., Martín, E. L., & Pérez-Garrido, A. 2024, A&A, 686, A161 [NASA ADS] [CrossRef] [EDP Sciences] [Google Scholar]
- Zhang, Y., Tang, S.-Y., Chen, W. P., Pang, X., & Liu, J. Z. 2020, ApJ, 889, 99 [Google Scholar]
- Zhong, J., Chen, L., Kouwenhoven, M. B. N., et al. 2019, A&A, 624, A34 [NASA ADS] [CrossRef] [EDP Sciences] [Google Scholar]
The Open Cluster Database: https://webda.physics.muni.cz/
The New Optically Visible Open Clusters and Candidates catalog: https://cdsarc.cds.unistra.fr/viz-bin/qcat?J/A+A/389/871
All the cluster property parameters are from Hunt & Reffert (2023): (α, δ) and Rtot refer to the cluster central position and total radius; ( , µδ) and (
 ,
,  ) refer to the mean and standard deviation values of proper motion; ϖ and sϖ are the mean and standard deviation values of parallax
Leaving out the faint stars would bias the half-mass radius of the two clusters.
All Tables
All Figures
|
Fig. 1 2D histogram of proper motion ( |
| In the text | |
|
Fig. 2 Proper motion ( |
| In the text | |
|
Fig. 3 Spatial (α, δ), proper motion ( |
| In the text | |
|
Fig. 4 Isochrone fitting of the two components in NGC 2323. The blue and pink dots refer to NGC 2323-a and NGC 2323-b members identified in this work respectively. The black solid lines indicate the best-fitting isochrone, while the gray and green dashed lines denote the isochrones with the lower and upper limits of visually fitted age. |
| In the text | |
|
Fig. 5 Backward (black line), forward (green dashed line), and future orbital separation (blue line with mass segregation degree S = 0 and red dashed line with mass segregation degree S = 1) simulated by using PETAR with mean property parameters for the binary cluster. The light shaded curves correspond to the orbits simulated with MCMC sampling over the measured uncertainties in 3D positions and velocities. |
| In the text | |
|
Fig. 6 Histogram of orbital separation at birth time and at 200 Myr (cluster with mass segregation S = 0 and 1). The black line, blue line, and red dashed line represent the orbital separation for the two clusters with mean property parameters (corresponding to the lines in Fig. 5), and the dash-dotted lines refer to the mode values of orbital separations for clusters fitted with a gamma function. The dotted lines refer to the median values of orbital separations for clusters with MCMC sampling parameters. The dash-dotted lines represent the mode values from the gamma fitting of the density distributions. |
| In the text | |
|
Fig. 7 Future evolution of the two clusters (blue line in Fig. 5): snapshots at the present day (cluster age = Ta = 158 Myr), 100 Myr (cluster age = Ta + 100 Myr), 200 Myr (cluster age = Ta + 200 Myr) in the X–Y plane (top) and the X–Z plane (bottom) for the binary clusters with mass segregation degree S = 0. The blue and pink points refer to the members of NGC 2323-a and NGC 2323-b, respectively; the blue and red arrows indicate the relative velocities. Here the relative velocities are the velocities relative to the average velocity of the two clusters. The size of the points represents the stellar mass. The dotted and dashed circles represent the tidal radius of NGC 2323-a and NGC 2323-b. The orange dashed lines represent the line-of-sight direction. |
| In the text | |
|
Fig. 8 Distributions (∆X-∆Y, ∆X-∆Z, ∆Y-∆Z) of the members for the simulated single cluster NGC 2323 at the present day in Galactic coordinates. The green and blue points refer to the stars inside and outside the cluster tidal radius (rtid = R(Moc/3MMW)1/3 (King 1962; Kroupa et al. 2022), where Moc and MMW refer to the masses of the cluster and the Milky Way, and R represents the distance of the cluster from the Galactic center. The black dashed lines are the line-of-sight direction; ∆X, ∆Y, and ∆Z are calculated relative to the cluster center. |
| In the text | |
|
Fig. 9 Spatial (∆α, ∆δ) and proper motion ( |
| In the text | |
Current usage metrics show cumulative count of Article Views (full-text article views including HTML views, PDF and ePub downloads, according to the available data) and Abstracts Views on Vision4Press platform.
Data correspond to usage on the plateform after 2015. The current usage metrics is available 48-96 hours after online publication and is updated daily on week days.
Initial download of the metrics may take a while.