Fig. 5
Download original image
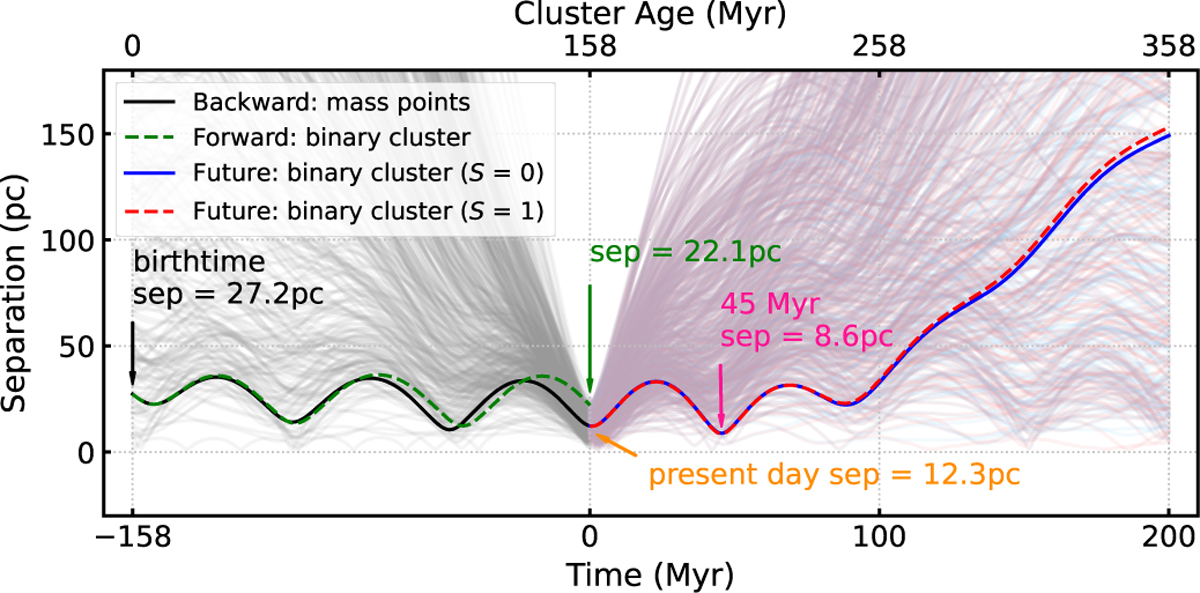
Backward (black line), forward (green dashed line), and future orbital separation (blue line with mass segregation degree S = 0 and red dashed line with mass segregation degree S = 1) simulated by using PETAR with mean property parameters for the binary cluster. The light shaded curves correspond to the orbits simulated with MCMC sampling over the measured uncertainties in 3D positions and velocities.
Current usage metrics show cumulative count of Article Views (full-text article views including HTML views, PDF and ePub downloads, according to the available data) and Abstracts Views on Vision4Press platform.
Data correspond to usage on the plateform after 2015. The current usage metrics is available 48-96 hours after online publication and is updated daily on week days.
Initial download of the metrics may take a while.