| Issue |
A&A
Volume 693, January 2025
|
|
|---|---|---|
| Article Number | A218 | |
| Number of page(s) | 8 | |
| Section | Catalogs and data | |
| DOI | https://doi.org/10.1051/0004-6361/202452672 | |
| Published online | 17 January 2025 | |
Binary and grouped open clusters: A new catalogue
1
Observatorio Astronómico, Universidad Nacional de Córdoba,
Laprida 854,
X5000BGR,
Córdoba,
Argentina
2
Consejo Nacional de Investigaciones Científicas y Técnicas de la República (CONICET),
Godoy Cruz 2290,
C1425FQB,
CABA,
Argentina
3
Instituto de Astronomía Teórica y Experimental (IATE), CONICET, Universidad Nacional de Córdoba,
Laprida 854,
X5000BGR,
Córdoba,
Argentina
4
Facultad de Ciencias Astronómicas y Geofísicas, Universidad Nacional de La Plata,
Argentina
5
Instituto de Astrofísica de La Plata (IALP), CONICET, Universidad Nacional de La Plata,
Av. Centenario S/N, Paseo del Bosque,
La Plata,
Argentina
★ Corresponding author; This email address is being protected from spambots. You need JavaScript enabled to view it.
Received:
19
October
2024
Accepted:
5
December
2024
Abstract
Context. Understanding the formation and evolution of star clusters in the Milky Way requires precise identification of clusters that form binary or multiple systems. Such systems offer valuable insight into the dynamical processes and interactions that influence cluster evolution.
Aims. This study aims to detect and classify star clusters in the Milky Way that are part of double or multiple systems. Specifically, we seek to detect clusters that form gravitationally bound pairs or groups of clusters and distinguish between different types of interactions based on their physical properties and spatial distributions.
Methods. We used an extensive star cluster database which includes 7167 clusters. By estimating the tidal forces acting on each cluster through the tidal factor and considering only close neighbours (within 50 pc), we identified a total of 2170 star clusters forming part of double or multiple systems. Pairs were classified as binaries, capture pairs, or optical pairs based on proper motion distributions, cluster ages, and colour-magnitude diagrams.
Results. Our analysis identified 617 paired systems, and they were successfully classified using our scheme. Additionally, we found 261 groups of star clusters with three or more members, providing further evidence of the presence of multiple systems within the Milky Way that exhibit significant tidal interactions.
Conclusions. The method we present provides an improved approach for identifying star clusters that share the same spatial volume and experience notable tidal interactions.
Key words: catalogs / open clusters and associations: general
© The Authors 2025
 Open Access article, published by EDP Sciences, under the terms of the Creative Commons Attribution License (https://creativecommons.org/licenses/by/4.0), which permits unrestricted use, distribution, and reproduction in any medium, provided the original work is properly cited.
This article is published in open access under the Subscribe to Open model. This email address is being protected from spambots. You need JavaScript enabled to view it. to support open access publication.
1 Introduction
Star clusters are fundamental tools for studying the formation and evolution histories of the galaxy to which they belong. In particular, star clusters forming binary (or multiple) systems are of great interest on a global scale, constituting about 10–15% of the total cluster population (Priyatikanto et al. 2019; Casado 2021b). These clumps become part of a system linked by different pathways. In some cases, the components of the system have been formed at the same time from the same primordial cloud (Priyatikanto et al. 2016). Consequently, the system components share similar characteristics, such as age, chemical composition, and distance. In other cases, sequential formation may occur when the stellar evolution of one of the clusters induces the collapse of a nearby cloud, either by stellar winds or supernova shocks, and thus generates the formation of a companion cluster (Goodwin 1997). Another possibility is the dynamical capture of a cluster through tidal forces (van den Bergh 1996) or resonant capture (de La Fuente Marcos & de La Fuente Marcos 2009). In such cases, the clusters form independently and may have significantly different properties.
The detection of multiple systems has been an area of interest since the 1990s, with significant advancements occurring in the past decade. This effort has led to the development of several catalogues, with each covering specific subsets of clusters based on particular selection criteria (e.g. de La Fuente Marcos & de La Fuente Marcos 2009; Soubiran et al. 2019; Piecka & Paunzen 2021; Casado 2021a; Song et al. 2022). Table 1 provides a comprehensive compilation of the published catalogues, documenting the discoveries of binary and multiple-cluster systems to date, the various methods and techniques used, and the 3D (or 6D) phase-space information. The catalogues in the table encompass diverse datasets and reflect the evolving approaches to identifying and analysing these systems. Recent studies have focused on creating a homogeneous sample of Galactic star clusters with consistent membership criteria. Notably, many of these endeavours rely on data from the Gaia mission (Gaia Collaboration 2018), which offers high-precision photometric and astrometric measurements and facilitates more accurate identification and analysis of these systems (e.g. see Cantat-Gaudin et al. 2020; Hunt & Reffert 2023, 2024).
In this study, we independently identify new star cluster pairs and groups by employing a method that considers the tidal forces exerted on each cluster by its closest neighbouring cluster. This approach allowed us to discern potential gravitational interactions and connections between clusters that may not be apparent through traditional methods, especially in populated regions. By focusing on these tidal influences, we are able to more accurately identify clusters that are likely part of a binary or multiple system.
The structure of this paper is as follows: Section 2 describes the sample used in this study. Next, in Section 3, we present the newly identified candidate binary and multiple systems. Finally, Section 4 summarises our conclusions.
Compilation of multiple systems detection found in the literature.
2 Sample of star clusters
2.1 The sample
Our study is based on the catalogues created by Hunt & Reffert (2023, HR23 hereafter) and Hunt & Reffert (2024, HR24 hereafter). In these articles, the authors undertook an extensive all-sky search for open clusters (OCs) using data from the third Gaia Data Release1 (Gaia Collaboration 2023). This resulted in a homogeneous catalogue containing 7167 clusters, of which 4782 are known from the literature and 2387 are newly identified candidates. To recover and detect these clusters, they employed the hierarchical density-based spatial clustering of applications with noise (HDBSCAN) algorithm, which is adept at identifying clusters of varying densities and separating them from noise. In addition to cluster identification, these studies provided detailed inferences on a range of fundamental parameters for each cluster. These include basic astrometric parameters, such as proper motions and parallaxes, as well as astrophysical properties, including ages, extinctions, distances, and photometric masses. The authors also distinguish between bound and unbound clusters, offering insights into the dynamic states of these systems. They found that only 79% of the clusters in their catalogue were consistent with being bound OCs, while the rest were identified as moving groups (MGs). This rich dataset serves as a crucial foundation for our analysis, enabling a thorough exploration of the characteristics and dynamics of both known and newly discovered star clusters.
For our purpose, we made use of the physical properties derived by Hunt and Reffert (HR23; HR24) for their entire sample, focusing specifically on total mass, size, and age. Briefly, the total cluster mass, M, was estimated by determining the photometric masses of member stars using PARSEC isochrone fits in the G-band (Bressan et al. 2012), followed by corrections for selection effects and unresolved binaries. Then, they fitted a mass function to each cluster and integrated it in order to estimate the total mass, adopting a Kroupa (2001) initial mass function (IMF) and employing the IMF Python package2. The size R50 used in this paper corresponds to the radius that encloses 50% of the cluster members, while the ages of the star clusters were determined by the authors using a neural network.
2.2 Systems identification
We first used the 3D Cartesian heliocentric Galactic coordinates of the star clusters to identify each cluster’s corresponding closest neighbour. In this process, we used the Sklearn.neighbors.NearestNeighbors3 Python package to efficiently determine the nearest neighbour of each cluster. The star clusters with reciprocity were therefore identified as closest neighbours. As a second step, we estimated the tidal force exerted on each cluster by considering only the influence of its closest neighbour. The tidal force estimation was calculated using the following tidal factor (TF):
 (1)
(1)
where d is the distance to the closest neighbour in parsecs; Mb is the total mass, in solar masses, of the neighbour cluster; and R50 is the radius, in parsecs, containing 50% of members within the tidal radius. The two last parameters are given by HR24. We note that TF is the reciprocal of the tidal force, therefore a low TF value corresponds to a high tidal force, and vice versa. This procedure classified the clusters as belonging to pairs or groups. The remaining clusters were considered as a mixture of singles and unclassified (Unclass).
To define our selection and boundaries criteria, we cross-referenced the HR24 catalogue with various other catalogues of double and multiple-cluster systems, as listed in Table 1. With this new compilation, we analysed the distributions of 3D distances to the closest neighbour, TF, and sizes for each star cluster category. Fig. 1 present these distributions and reveals that most star clusters considered part of a system (pairs or groups) predominantly have distances less than ~50–100 pc and TF values below ~250 without any notable differences among their size distributions. Taking into account these distributions, we categorised the star clusters according to the following classification rules:
Pairs (P): These are sets of two close (<50 pc) neighbour clusters where at least one of the clusters has a low TF value (<200) and without any third nearby cluster.
Groups (G): These are sets of three or more clusters. They were identified originally as pairs but have at least one additional close cluster (<50 pc) with a low TF value (<200).
Singles (S): These are star clusters located beyond 100 pc from their nearest neighbour.
Unclass: Remaining clusters not included in previous cases.
We analysed the newly obtained distributions of the closest neighbour distances, TFs, and sizes for each star cluster category, following our new classification criteria (Fig. 2). We identified a total of 2170 candidate star clusters (OCs and MGs) within pairs or groups. A summary of the stellar systems we found is given in Fig. 3. For each category (singles, pairs, groups, Unclass), we distinguish among the OCs and MGs.
3 New binary and multiple system candidates
Based on our identification and classification criteria, we compiled new catalogues of binary and multiple-cluster candidates. We included the fundamental and relevant parameters for a total of 2170 OCs and MGs, as determined by the HR23; HR24 catalogues and our analysis. The classification process involved careful analysis of cluster properties, such as position, parallax, proper motions, and colour-magnitude diagrams based on these catalogues. Our compilation and study were conducted homogeneously, as we applied the same procedures and criteria across all datasets. This consistency ensures that our results are directly comparable with previous studies and that any newly identified cluster systems are reliably classified.
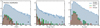 |
Fig. 1 Distribution of distances, computed TFs, and sizes of catalogued star clusters considering different classifications. |
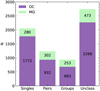 |
Fig. 3 OC (violet) and MG (lightgreen) distribution into cluster systems based on our TF classification method. |
3.1 Pair star clusters
Out of the 617 binary system candidates identified using the TF criteria, 52 pairs have previously been catalogued as being part of a binary or multiple-cluster system. Notably, our method successfully rediscovered seven binary systems that were already documented in earlier catalogues, validating the reliability of our approach. The remaining 45 pairs are analysed and discussed in Section 3.3. This cross-verification not only reinforces the accuracy of our methodology but also highlights its effectiveness in identifying genuine binary cluster systems. In addition to confirming known systems, our analysis revealed 610 new candidate pair clusters that have not been identified previously. For each cluster, we carefully selected stars with a membership probability greater than 70% to ensure the accuracy and reliability of our identifications. This threshold was chosen to minimise contamination from field stars and to provide a clearer understanding of the true members of the clusters. Fig. 4 shows, in a Venn diagram, the number of pair systems in the different compositions, where both members are OCs, MGs, or a combination of both.
To evaluate the potential physical interactions within these candidate binary systems, we analysed the distributions of their member stars in a multidimensional space, which included coordinates, parallax, and proper motions as well as their corresponding colour-magnitude diagrams. This comprehensive assessment allowed us to consider multiple aspects of the clusters’ physical properties simultaneously and to better understand whether they constitute physically interacting systems. Based on these analyses, we classified the pair system (P) candidates into the following categories:
Genetic pairs or binaries (B): These are clusters that form simultaneously, sharing common properties such as distance (parallax), kinematics (compatibility in proper motions), and age. They likely originated from the same molecular cloud and have similar evolutionary histories.
Tidal capture or resonant trapping pairs (C): These systems consist of clusters that occupy a limited volume of space, and they share common kinematics but do not necessarily have similar ages. The shared kinematics suggest that these clusters are gravitationally influenced by each other, possibly due to tidal capture or resonant trapping mechanisms. This indicates a dynamic interaction without a common origin in time.
Optical pairs (O): These clusters appear close together in the sky but are not gravitationally bound. They result from gravitational (hyperbolic) encounters (de La Fuente Marcos & de La Fuente Marcos 2009) and may not share common kinematics. Optical binaries are further divided into two types: clusters that occupy a limited space and have similar ages, suggesting they pass near each other but are not dynamically associated (Oa), and clusters that occupy a limited volume of space but do not have similar ages, indicating a chance alignment in the sky without any significant gravitational interaction (O).
An example of each category is given in Fig. A.1 for OC pairs. This classification framework allowed us to distinguish between various types of binary systems ranging from those with strong physical associations to merely coincidental alignments. The following physical features were used to characterise the clusters in pairs: (a) the relative age difference  and (b) a virial factor (VF) defined as

where  , and
, and  are the mean size (in pc) and the mean mass (in solar masses), respectively, of both clusters and vT = 4.74 Δµ D50 is the relative tangential velocity between the clusters (in kilometres per second). The corresponding distribution of star clusters in pairs is presented in Fig. 5. The plot in the figure reveals that the previously suggested categories are easily separated using the limiting values
  and
and  .
.
Table 2 summarises the relevant properties of our newly detected pair systems. The column labelled ‘kind’ distinguishes between OCs (o) and MGs (m). The mass ratio is given as MA/MB, and ΔAge50 represents the median age pair difference. We considered that differences in Ageso below 10%, in logarithmic scale, indicate coeval clusters. The term PMcompat denotes the compatibility of the clusters’ proper motions within 3σ, and BCO refers to the pair classification.
Fig. 6 summarises the number of stellar systems in each pair category, distinguishing among OCs and MGs. As can be observed (and as is expected), genetic binary systems are the minority. By examining these different categories, one can better understand the formation and evolution of these stellar systems.
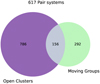 |
Fig. 4 Number of star clusters of pair systems composed of OCs (violet), MGs (light green), or a combination of both. |
Binary system candidates.
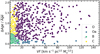 |
Fig. 5 Ages and virial state for star clusters in pair systems. |
3.2 Group star cluster candidates
The TF criteria identified 936 star clusters, forming 261 multiple systems (i.e. groups with three or more components). Table 3 summarises the relevant properties of these newly detected multiple systems. Fig. 7 illustrates the configurations of these groups, which consist entirely of OCs, MGs, or a combination of both. Fig. 8 presents the number of star clusters, composed of OCs and/or MGs, within each system as a function of the number of members. Most of the systems are made up of groups with three star clusters, followed by groups with four and five members. There is only one system with eight star clusters. Applying the same procedure as for binary systems, we selected stars for each cluster with a membership probability greater than 70%. We then analysed their distributions across spatial coordinates, proper motions, and parallax planes as well as their colour-magnitude diagrams to assess the systems’ physical properties. An example of our analysis, along with the results for a selected multiple-cluster system, is given in Fig. A.2.
The cluster members within each group exhibit different degrees of association with their respective group members. Some share common proper motions and/or ages, while others are coincidentally aligned and share the same spatial volume. To quantify these characteristics, we computed their parameters  and VF. Then, we adopted similar limit values to those obtained from Fig. 5 for clusters in pairs, and we estimated that about 7% of the identified clusters in groups could be considered part of coeval systems.
Multiple system candidates.
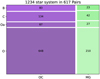 |
Fig. 6 Distribution of OCs in pair systems across each type and category. |
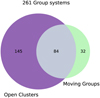 |
Fig. 7 Composition of new multiple-cluster systems. The diagram shows the number of systems formed entirely of OCs (violet), MGs (light green), or a combination of both. |
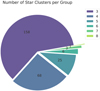 |
Fig. 8 Pie chart showing the number of star clusters in each group. Most of the systems consist of groups with three star clusters. |
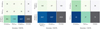 |
Fig. 9 Confusion matrices comparing star cluster classifications from previous studies (‘Cat’ items) with our systematic method, which uses the TF, distances, and pair identification (see Sect. 2). The left matrix categorizes star clusters into groups, pairs, singles, and unclassified (‘Unclass’). The central matrix combines the groups and pairs categories, while the right matrix considers only the groups and pairs classifications. The corresponding accuracy for each matrix is also provided. |
3.3 Analysis of catalogued binary and multiple clusters
The cross-correlation of the HR24 catalogue with other catalogues of double and multiple-cluster systems not only helped us define our selection criteria but also enabled us to validate and expand existing data. That is, we were able to verify the presence of known binary and multiple systems while also identifying new candidates. To compare classification criteria, we constructed confusion matrices, as shown in Fig. 9. The results demonstrate an overall accuracy of about 70% (left and central matrices) in distinguishing between the different categories and when combining single and Unclass star clusters according to our criteria. On the other hand, the specific discrimination between groups and pairs shows an accuracy of approximately 50% (right matrix). In particular, our classification rules revealed the following:
We identified 2021 star clusters as pairs or groups that were previously unclassified or considered singles;
We identified 45 star clusters as being part of groups that were previously considered as part of pairs;
We found 27 star clusters previously identified as being part of groups or pairs that are now identified as singles;
We identified 31 star clusters previously considered as being part of groups but are now classified as pairs.
4 Conclusions
In this work, we employed a new method to identify star clusters in the Milky Way that are part of double or multiple systems. For this purpose, we used the Hunt & Reffert (2023, 2024) database, which comprises 7167 star clusters. By estimating the tidal force through the TF, we identified 1234 star clusters forming 617 paired systems. These systems consist of OCs, MGs, or a combination of both. Taking into account star membership probabilities within each cluster, we further classified the systems into three categories: binaries (B), capture pairs (C), and optical pairs (O/Oa). This classification was determined using proper motion distributions, cluster ages, and colour-magnitude diagrams. Additionally, we identified 936 star clusters forming 261 groups, each with three or more members. Our work increases the currently known sample of double and multiple systems in the Milky Way by a factor of approximately 2.7 and 4.5, respectively. Our method offers a more accurate approach to identifying clusters within the same spatial volume that exhibit significant tidal interactions with their neighbours.
Data availability
Full Tables 2 and 3 are available at the CDS via anonymous ftp to cdsarc.cds.unistra.fr (130.79.128.5) or via https://cdsarc.cds.unistra.fr/viz-bin/cat/J/A+A/693/A218
Acknowledgements
We gratefully acknowledge financial support from the Argentinian institutions: Consejo Nacional de Investigaciones Científicas y Técnicas (CONICET; PIP-2022-11220210100064CO and PIP-2022-11220210100714CO), Agencia Nacional de Promoción de la Investigatión, el Desarrollo Tecnológico y la Innovación (PICT-2020-3690), Secretaría de Cien-cia y Tecnología de la Universidad Nacional de Córdoba (SECYT-UNC, Res. 258/53) and from the Universidad Nacional de La Plata (project: 11/G182).
Appendix A Additional figures
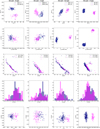 |
Fig. A.1 Distributions in a multidimensional space (positions, proper motions, and parallaxes) of member stars with at least 70% of membership probability of different types of selected pairs. All the clusters are identified as OCs. The light blue crosses mark the central cluster coordinates or cluster proper motions. |
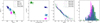 |
Fig. A.2 Distributions in a multidimensional space (positions, proper motions, and parallaxes) of member stars with at least 70% of membership probability of a selected group. All the clusters involved are OCs. |
References
- Angelo, M. S., Santos, J. F. C., Maia, F. F. S., & Corradi, W. J. B. 2022, MNRAS, 510, 5695 [CrossRef] [Google Scholar]
- Bressan, A., Marigo, P., Girardi, L., et al. 2012, MNRAS, 427, 127 [NASA ADS] [CrossRef] [Google Scholar]
- Cantat-Gaudin, T., Anders, F., Castro-Ginard, A., et al. 2020, A&A, 640, A1 [NASA ADS] [CrossRef] [EDP Sciences] [Google Scholar]
- Casado, J. 2021a, Res. Astron. Astrophys., 21, 117 [CrossRef] [Google Scholar]
- Casado, J. 2021b, Astron. Rep., 65, 755 [NASA ADS] [CrossRef] [Google Scholar]
- Conrad, C., Scholz, R. D., Kharchenko, N. V., et al. 2017, A&A, 600, A106 [NASA ADS] [CrossRef] [EDP Sciences] [Google Scholar]
- de La Fuente Marcos, R., & de La Fuente Marcos, C. 2009, A&A, 500, L13 [NASA ADS] [CrossRef] [EDP Sciences] [Google Scholar]
- Gaia Collaboration (Brown, A. G. A., et al.) 2018, A&A, 616, A1 [NASA ADS] [CrossRef] [EDP Sciences] [Google Scholar]
- Gaia Collaboration (Vallenari, A., et al.) 2023, A&A, 674, A1 [NASA ADS] [CrossRef] [EDP Sciences] [Google Scholar]
- Goodwin, S. P. 1997, MNRAS, 284, 785 [Google Scholar]
- Hunt, E. L., & Reffert, S. 2023, A&A, 673, A114 [NASA ADS] [CrossRef] [EDP Sciences] [Google Scholar]
- Hunt, E. L., & Reffert, S. 2024, A&A, 686, A42 [NASA ADS] [CrossRef] [EDP Sciences] [Google Scholar]
- Kroupa, P. 2001, MNRAS, 322, 231 [NASA ADS] [CrossRef] [Google Scholar]
- Liu, L., & Pang, X. 2019, ApJS, 245, 32 [NASA ADS] [CrossRef] [Google Scholar]
- Pavlovskaya, E. D., & Filippova, A. A. 1989, Soviet Ast., 33, 6 [NASA ADS] [Google Scholar]
- Piecka, M., & Paunzen, E. 2021, A&A, 649, A54 [NASA ADS] [CrossRef] [EDP Sciences] [Google Scholar]
- Priyatikanto, R., Kouwenhoven, M. B. N., Arifyanto, M. I., Wulandari, H. R. T., & Siregar, S. 2016, MNRAS, 457, 1339 [Google Scholar]
- Priyatikanto, R., Arifyanto, M. I., Darma, R., Aprilia, & Hakim, M. I. 2019, in Dwarf Galaxies: From the Deep Universe to the Present, 344, eds. K. B. W. McQuinn & S. Stierwalt, 118 [NASA ADS] [Google Scholar]
- Song, F., Esamdin, A., Hu, Q., & Zhang, M. 2022, A&A, 666, A75 [NASA ADS] [CrossRef] [EDP Sciences] [Google Scholar]
- Soubiran, C., Cantat-Gaudin, T., Romero-Gómez, M., et al. 2019, A&A, 623, C2 [EDP Sciences] [Google Scholar]
- Subramaniam, A., Gorti, U., Sagar, R., & Bhatt, H. C. 1995, A&A, 302, 86 [NASA ADS] [Google Scholar]
- van den Bergh, S. 1996, ApJ, 471, L31 [Google Scholar]
- Zhong, J., Chen, L., Kouwenhoven, M. B. N., et al. 2019, A&A, 624, A34 [NASA ADS] [CrossRef] [EDP Sciences] [Google Scholar]
All Tables
All Figures
|
Fig. 1 Distribution of distances, computed TFs, and sizes of catalogued star clusters considering different classifications. |
| In the text | |
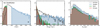 |
Fig. 2 Same as Fig. 2 but based on our classification criteria (see text). |
| In the text | |
|
Fig. 3 OC (violet) and MG (lightgreen) distribution into cluster systems based on our TF classification method. |
| In the text | |
|
Fig. 4 Number of star clusters of pair systems composed of OCs (violet), MGs (light green), or a combination of both. |
| In the text | |
|
Fig. 5 Ages and virial state for star clusters in pair systems. |
| In the text | |
|
Fig. 6 Distribution of OCs in pair systems across each type and category. |
| In the text | |
|
Fig. 7 Composition of new multiple-cluster systems. The diagram shows the number of systems formed entirely of OCs (violet), MGs (light green), or a combination of both. |
| In the text | |
|
Fig. 8 Pie chart showing the number of star clusters in each group. Most of the systems consist of groups with three star clusters. |
| In the text | |
|
Fig. 9 Confusion matrices comparing star cluster classifications from previous studies (‘Cat’ items) with our systematic method, which uses the TF, distances, and pair identification (see Sect. 2). The left matrix categorizes star clusters into groups, pairs, singles, and unclassified (‘Unclass’). The central matrix combines the groups and pairs categories, while the right matrix considers only the groups and pairs classifications. The corresponding accuracy for each matrix is also provided. |
| In the text | |
|
Fig. A.1 Distributions in a multidimensional space (positions, proper motions, and parallaxes) of member stars with at least 70% of membership probability of different types of selected pairs. All the clusters are identified as OCs. The light blue crosses mark the central cluster coordinates or cluster proper motions. |
| In the text | |
|
Fig. A.2 Distributions in a multidimensional space (positions, proper motions, and parallaxes) of member stars with at least 70% of membership probability of a selected group. All the clusters involved are OCs. |
| In the text | |
Current usage metrics show cumulative count of Article Views (full-text article views including HTML views, PDF and ePub downloads, according to the available data) and Abstracts Views on Vision4Press platform.
Data correspond to usage on the plateform after 2015. The current usage metrics is available 48-96 hours after online publication and is updated daily on week days.
Initial download of the metrics may take a while.