Open Access
Fig. 2
Download original image
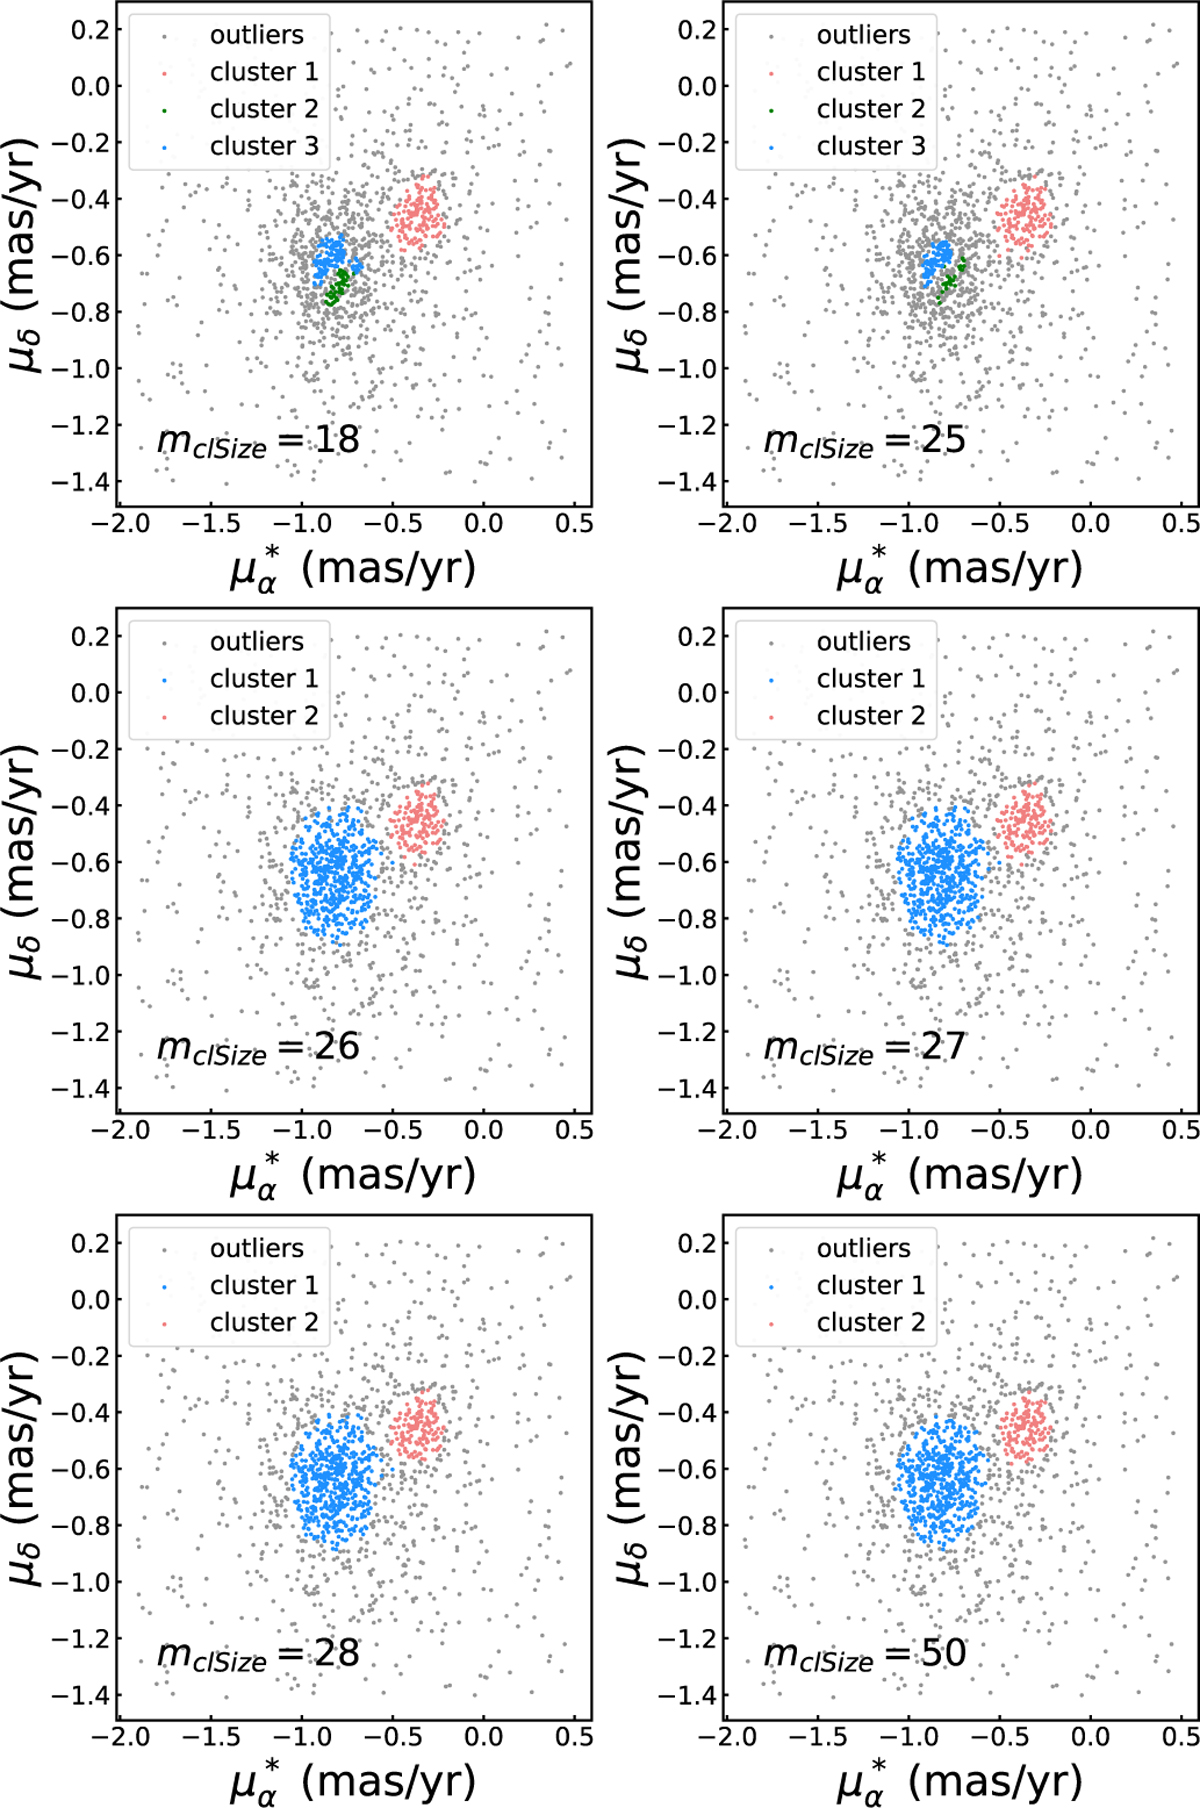
Proper motion (![]() , µδ) distributions of the clustering results by using HDBSCAN with different min_cluster_size (mclS iɀe) parameters. The gray dots represent the outliers or field stars, and other color-coded dots are the cluster members identified by HDBSCAN.
, µδ) distributions of the clustering results by using HDBSCAN with different min_cluster_size (mclS iɀe) parameters. The gray dots represent the outliers or field stars, and other color-coded dots are the cluster members identified by HDBSCAN.
Current usage metrics show cumulative count of Article Views (full-text article views including HTML views, PDF and ePub downloads, according to the available data) and Abstracts Views on Vision4Press platform.
Data correspond to usage on the plateform after 2015. The current usage metrics is available 48-96 hours after online publication and is updated daily on week days.
Initial download of the metrics may take a while.