Fig. 6
Download original image
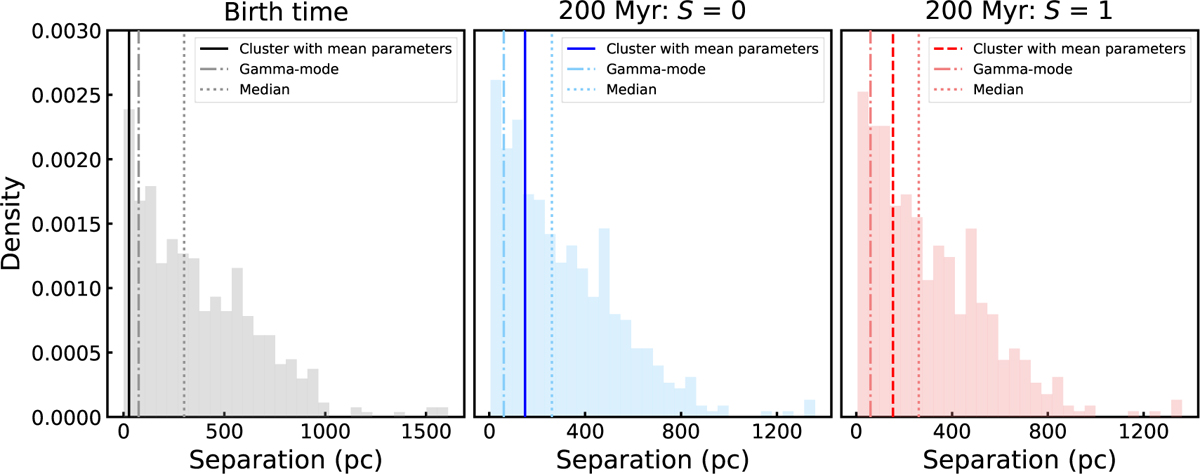
Histogram of orbital separation at birth time and at 200 Myr (cluster with mass segregation S = 0 and 1). The black line, blue line, and red dashed line represent the orbital separation for the two clusters with mean property parameters (corresponding to the lines in Fig. 5), and the dash-dotted lines refer to the mode values of orbital separations for clusters fitted with a gamma function. The dotted lines refer to the median values of orbital separations for clusters with MCMC sampling parameters. The dash-dotted lines represent the mode values from the gamma fitting of the density distributions.
Current usage metrics show cumulative count of Article Views (full-text article views including HTML views, PDF and ePub downloads, according to the available data) and Abstracts Views on Vision4Press platform.
Data correspond to usage on the plateform after 2015. The current usage metrics is available 48-96 hours after online publication and is updated daily on week days.
Initial download of the metrics may take a while.