| Issue |
A&A
Volume 693, January 2025
|
|
|---|---|---|
| Article Number | A204 | |
| Number of page(s) | 14 | |
| Section | Extragalactic astronomy | |
| DOI | https://doi.org/10.1051/0004-6361/202452759 | |
| Published online | 17 January 2025 | |
Not just PAH3.3: Why galaxies turn red in the near-infrared
1
INAF – Osservatorio astronomico di Padova, Vicolo Osservatorio 5, I-35122 Padova, Italy
2
Department of Physics and Astronomy, University of California, Los Angeles, 430 Portola Plaza, Los Angeles, CA 90095, USA
3
IPAC, California Institute of Technology, 1200 East California Boulevard, Pasadena, CA 91125, USA
4
INAF – Osservatorio Astronomico di Roma, via Frascati 33, 00078 Monteporzio Catone, Italy
5
Dipartimento di Fisica, Università di Roma Sapienza, Città Universitaria di Roma – Sapienza, Piazzale Aldo Moro 2, 00185 Roma, Italy
6
Dipartimento di Fisica, Università di Roma Tor Vergata, Via della Ricerca Scientifica 1, 00133 Roma, Italy
7
Instituto de Radioastronomia y Astrofisica, UNAM, Campus Morelia, AP 3-72, CP 58089, Mexico
8
School of Physics, The University of Melbourne, VIC 3010, Australia
9
Australian Research Council Centre of Excellence for All-Sky Astrophysics in 3-Dimensions, Melbourne, VIC 3000, Australia
10
National Radio Astronomy Observatory, 520 Edgemont Road, Charlottesville, VA 22903, USA
11
School of Astronomy and Space Science, University of Chinese Academy of Sciences (UCAS), Beijing 100049, China
12
National Astronomical Observatories, Chinese Academy of Sciences, Beijing 100101, China
13
Institute for Frontiers in Astronomy and Astrophysics, Beijing Normal University, Beijing 102206, China
⋆ Corresponding author; This email address is being protected from spambots. You need JavaScript enabled to view it.
Received:
25
October
2024
Accepted:
6
December
2024
Abstract
We measured the spectral properties of a sample of 20 galaxies at z ∼ 0.35 selected for having surprisingly red JWST/NIRCAM F200W-F444W colors. Of these, 19 galaxies were observed with JWST/NIRSpec in the PRISM configuration, while the remaining galaxy was observed with the high-resolution gratings. Of the 20 galaxies in our sample, 17 exhibit strong 3.3 μm polycyclic aromatic hydrocarbon (PAH) emission (equivalent width (EW) (PAH3.3) ≥ 0.03 μm). In these galaxies, the strength of the color excess does not depend on environment and correlates with EW(PAH3.3). Nonetheless, the presence of the PAH3.3 alone cannot fully explain the color excess, as an EW of ∼0.1 μm is able to increase the color of galaxies by only 0.13 mag. A contribution from a hot dust component is required to explain the excess. Both the PAH3.3 EW and flux correlate with the Hα EW and flux, suggesting that they are produced by the same mechanism. Five of the galaxies of our sample showing PAH3.3 would be classified as passive based on broadband rest frame colors ((B-V) and/or UVJ diagrams) and are hence “faux passive”. Of these, three galaxies have a significantly lower EW(PAH3.3) given their color and also have low EW(Hα), and we tentatively conclude that this behavior is due to the presence of an active galactic nucleus. The three galaxies with no PAH3.3 in emission have passive spectra, as do the eight galaxies in our sample with normal F200W-F444W colors. We therefore conclude that the PAH3.3 feature is linked to dust-enshrouded star formation. The dust-corrected star formation rate (SFR) from PAH3.3 is a factor of 3.5 higher than the SFR obtained from Hα, suggesting that these galaxies are characterized by significant amounts of dust.
Key words: dust / extinction / ISM: general / galaxies: evolution / galaxies: general / galaxies: ISM
© The Authors 2025
 Open Access article, published by EDP Sciences, under the terms of the Creative Commons Attribution License (https://creativecommons.org/licenses/by/4.0), which permits unrestricted use, distribution, and reproduction in any medium, provided the original work is properly cited.
This article is published in open access under the Subscribe to Open model. This email address is being protected from spambots. You need JavaScript enabled to view it. to support open access publication.
1. Introduction
Over recent decades, dusty galaxies have been detected by observations in the mid- (MIR) and far-infrared (FIR) as well as at submillimeter wavelengths. Several studies have shown that they are present throughout cosmic history and up to a very high redshift (Smail et al. 1997; Hughes et al. 1998; Aussel et al. 1999; Chary & Elbaz 2001; Blain et al. 2002; Floc’h et al. 2004; Marleau et al. 2004; Coppin et al. 2008; Capak et al. 2011; Reuter et al. 2023). Their infrared luminosity mainly originates from intense dust-enshrouded bursts of star formation, but they can also host a powerful active nucleus triggered by nuclear accretion onto their central black hole (Yan et al. 2005; Pope et al. 2008; Menéndez-Delmestre et al. 2009; Hainline et al. 2009; Desai et al. 2009; Fadda et al. 2010).
Several works have proposed that, at least at z < 1, the amount of dust obscuration correlates with the density of the surrounding environment (Duc et al. 2002; Geach et al. 2006; Marcillac et al. 2007; Bai et al. 2007; Saintonge et al. 2008; Koyama et al. 2008; Krick et al. 2009). In the field, dust-enshrouded star formation episodes are commonly found in interacting luminous infrared galaxies (Sanders et al. 1996). In clusters, ram pressure (Gunn & Gott 1972) and harassment (Moore et al. 1996) contribute to stripping the outer gas reservoir of gas-rich infalling galaxies. As a consequence, star activity is quenched in the disks, while it is maintained for longer in the central regions, which are less influenced by the environment but are more affected by internal extinction (e.g., Fritz et al. 2017). Koyama et al. (2008) detected an environmental dependence in the fraction of dusty star-forming galaxies at z ∼ 0.8, and suggested that the star formation activity detected in the MIR is enhanced in “medium-density” environments, such as cluster outskirts, groups, and filaments, where galaxy optical colors sharply change from blue to red due to the truncation of star-forming activity. The most likely physical mechanisms at work in these medium-density regions are still debated: some works (Hopkins et al. 2008; Martig & Bournaud 2008; Koyama et al. 2010) point to galaxy-galaxy interaction or mergers, while others (Jáchym et al. 2007; Cen et al. 2014) point to hydrodynamical effects – which are expected to impact only the gas component, leaving the stars unaltered – as responsible for the alteration of the star formation activity in these regions. However, Murata et al. (2015) did not find a clear environmental dependence of the ratio of the luminosity at 8 μm to the IR luminosity, supporting the idea that the relation between the physical parameters of star-forming galaxies is not affected by the environment.
JWST, with its unprecedented resolution and sensitivity at near-infrared (NIR) and MIR wavelengths, is opening a new window onto dusty galaxies, enabling us to observe galaxies that were beyond the reach of previous space telescopes, such as AKARI and Spitzer (e.g., Evans et al. 2022; Dale et al. 2023; Belfiore et al. 2023; Lai et al. 2022, 2023; Lin et al. 2024; Pearson et al. 2024). One of the best fields studied so far with JWST is that containing the galaxy cluster Abell 2744 (A2744) at a redshift of z = 0.3, and right ascension (RA) = 00:14:20.952 and declination (Dec) = –30:23:53.88. The cluster benefits from the deepest imaging available. Its central part and extended regions have been targeted by three different programs: GLASS-JWST (Treu et al. 2022), UNCOVER (PID 2561, Bezanson et al. 2024), and the Director’s Discretionary Time Program 2756, which was designed to follow-up on a supernova discovered in GLASS-JWST NIRISS imaging (PI: Chen). Observations with a NIRCAM medium band have also been taken in Cycle 2 (GO-4111). Taken together, these surveys provide contiguous coverage in eight bands (F090W, F115W, F150W, F200W, F277W, F356W, F410M, and F444W) from 0.8 to 4.5 μm over 46.5 square arcmin (Paris et al. 2023). Considering the existing Hubble space Telescope (HST) imaging (Lotz et al. 2016; Steinhardt et al. 2020), the wavelength coverage is even more comprehensive. This exceptional dataset also benefits from extended spectroscopic coverage, including JWST/NIRISS slitless spectroscopy (Roberts-Borsani et al. 2022), JWST/NIRCAM slitless spectroscopy (GO-3516), JWST/NIRSpec multi-object spectroscopy (Morishita et al. 2023; Mascia et al. 2024; Price et al. 2024), HST grism (Treu et al. 2015), and ground-based spectroscopy (Owers et al. 2011; Braglia et al. 2009; Mahler et al. 2018; Richard et al. 2021; Bergamini et al. 2023). X-ray observations (Owers et al. 2011) further enrich this dataset, making A2744 one of the best-characterized structures beyond the local Universe.
Vulcani et al. (2023) characterized, for the first time, the NIR and MIR colors of cluster member galaxies in A2744 and galaxies in the coeval field (0.15 < z < 0.55), unveiling the existence of a puzzling galaxy population with a surprisingly red F200W-F444W color, which these authors refer to as red outliers. Importantly, this population does not clearly stand out with regard to any other integrated galaxy property. These red outliers are found both in the cluster and in the field, with a relative excess in the cluster outskirts, suggesting that environmental conditions may play a role. Spectrophotometric models developed to derive the properties of the stellar populations (Fritz et al. 2007, 2017) are not able to reproduce the observed excess in F444W, requiring additional emission from hot dust that can be simply heated by young stars.
This red excess, which is distributed across the entire galaxy disk, resembles the Infrared Array Camera (IRAC) excess observed by Magnelli et al. (2008) in six galaxies at z > 0.6, and could have multiple explanations: (1) hot dust emission, which could originate from an obscured active galactic nucleus (AGN); (2) free-free and hydrogen recombination line emission from ionized gas; (3) a possible continuum observed in the diffuse medium of our Galaxy (Flagey et al. 2006; Lu 2004) and in some local star-forming galaxies (Lu et al. 2003); and (4) emission from the 3.3 μm polycyclic aromatic hydrocarbon (PAH3.3) feature due to dust-enshrouded star formation. The latter possibility is currently the most accredited explanation of the IRAC excess (Magnelli et al. 2008; Mentuch et al. 2009).
Prior to the present study, only one red outlier has been observed by JWST/NIRSpec, within the GLASS-JWST program (Vulcani et al. 2023). Its NIRSpec 3–4 μm spectrum, centered on the galaxy disk, is dominated by the presence of a strong PAH3.3 line (equivalent width of 590 ± 30 Å, Vulcani et al. 2023) that could be the source of the color excess. However, only one object is not sufficient to reconstruct the general picture.
PAHs are found in a wide range of astrophysical sources and environments. They are prominent emission features excited by ultraviolet (UV) photons mostly from hot stars in star forming regions, while they are destroyed by hard photons from an AGN central engine (Voit 1992). They can be used as a powerful diagnostic of the physical conditions in galaxies (Peeters et al. 2004a), and their strength depends on the characteristics of the emitting particles (size, geometry, composition, charge state, etc.; Allamandola et al. 1989; Bauschlicher et al. 2008, 2009; Draine & Li 2001; Schutte et al. 1993; Tielens 2008) and can be used to disentangle the relative contributions of starburst and AGN in galaxies (Genzel et al. 1998; Rigopoulou et al. 1999; Tran et al. 2001) and as star formation tracers (Peeters et al. 2004b; Tacconi-Garman et al. 2005; Tommasin et al. 2008; Kim et al. 2012; Riechers et al. 2014).
The PAH3.3 feature is weak compared to the well-studied PAH features observed at longer wavelengths, and is typically prominent in IR-luminous starburst galaxies (Murakami et al. 2007; Imanishi et al. 2008, 2010; Kim et al. 2012; Lai et al. 2020) and obscured AGN associated with star formation activity (Moorwood 1986; Imanishi & Dudley 2000; Rodriguéz-Ardila & Viegas 2003). This particular feature is attributed to the smallest PAH population, which has a small heat capacity. Its luminosity has a greater dependency on the radiation environment than the other PAH emission features, in the sense that the grains producing it are more easily destroyed by strong radiation fields (Draine & Li 2007).
Building upon the Vulcani et al. (2023) results, in this study we further explore the origin of the red excess, and investigate the role, origin, and contribution of the PAH3.3 feature in greater detail. We present new observations of the red outliers taken with JWST/NIRSpec. In Sect. 2, we describe the sample selection, observations, and data reduction; in Sect. 3 we discuss the photometric properties of the sample, while in Sect. 4 we investigate its spectroscopic properties, mainly focusing on the Hα and PAH3.3 emissions. In Sect. 5, we discuss the origin of the red excess and present our conclusions in Sect. 6. A standard cosmology with Ωm = 0.3 ΩΛ = 0.7 and H0 = 70 km s−1 Mpc−1 and a Chabrier (2003) initial mass function are adopted.
2. Sample selection, observations, and data reduction
Vulcani et al. (2023) provided a detailed characterization of the NIR properties of the galaxies which are members of Abell 2744 and of a coeval field (0.15 < z < 0.55), exploiting the JWST/NIRCAM observations (Merlin et al. 2022; Paris et al. 2023) taken as part of the GLASS-JWST survey (Treu et al. 2022). As mentioned in Sect. 1, Vulcani et al. (2023) coined the term red outliers, distinguishing galaxies whose F200W-F444W color is redder than three times the width of the red sequence of the entire population. In contrast, these galaxies have typical F115W-F150W colors and rather blue rest-frame B-V colors. We refer to Vulcani et al. (2023) for further details on the sample selection and results.
The sample of cluster and field galaxies studied in Vulcani et al. (2023) was included as filler candidates in the parent catalogs used by two distinct JWST/NIRSpec programs to plan their multi-object spectroscopy observations, with a higher priority given to red outliers.
The JWST NIRSpec Program GO-3073 (PI M. Castellano) was designed to carry out extensive follow-up spectroscopy of the z ≥ 10 candidates selected in the GLASS-JWST region, and also observed 14 galaxies from Vulcani et al. (2023), including 11 red outliers. The same observations also observed additional nine galaxies in the redshift range of interest (0.15 < z < 0.55), and with spectral coverage necessary to perform the present analysis. Some of them have the same characteristics as the red outliers, while others lie on the main sequence. All of them are useful for investigating the nature of the red outlier population, and so they are all included in the present analysis. Further details of observations and data reduction are given by Castellano et al. (2024) and Napolitano et al. (2025). The data were reduced with the STScI Calibration Pipeline version 1.13.4, and the Calibration Reference Data System (CRDS) mapping 1197.
The JWST/NIRSpec observations taken in the context of the UNCOVER program (Bezanson et al. 2024) observed four additional galaxies, all of them in the red outlier region. Further details of the observations can be found in Price et al. (2024). For this paper, data were taken from the catalogs published in Roberts-Borsani et al. (2024) and were corrected for wavelength-dependent slitloss using the NIRCam photometry and a polynomial fit to the residuals. In both programs, the PRISM dispersive element was adopted, and so spectra have continuous coverage in the observed wavelength range 0.6–5.3 μm, with a resolving power of ∼100.
We also include in our sample the red outlier with a previously existing JWST/NIRSpec spectrum, which was already presented by Vulcani et al. (2023). This galaxy (41908 in Vulcani et al. 2023, GLASSID 7622) was observed as part of the GLASS-JWST survey (ERS-1324, PI Treu; Treu et al. 2022), with JWST/NIRSpec in multi-object spectroscopy (MOS), with three spectral configurations (G140H/F100LP, G235H/F170LP, and G395H/F290LP), covering a wavelength range from 1 to 5.14 μm with a spectral resolution of approximately 2700. We refer to Morishita et al. (2023) and Mascia et al. (2024) for details of the observations and data reduction. In total, our sample includes 28 galaxies, 20 of which are red outliers and 8 are galaxies with color within three times the width of the red sequence identified in the F200W-F444W versus F200W plane, which we refer to as “normal” galaxies.
3. Photometric properties of the sample of red outliers
Figure 1 shows the positions of the 28 target galaxies on the F200W-F444W versus F200W plane; the targets are color-coded based on the environment in which they lie1. Observations covered most of the red outliers, and also eight galaxies located on the red sequence. These red sequence galaxies can act as a useful comparison, enabling us to understand the origin of the observed red colors.
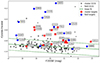 |
Fig. 1. Observed color-magnitude diagram (F200W-F444W vs. F200W). Stars represent galaxies in the cluster, while circles represent galaxies in the field. Small symbols and gray colors show galaxies from Vulcani et al. (2023) not specifically targeted here. Larger symbols and red/blue colors indicate the galaxies analyzed in the present paper. The green solid line represents the best fit of the relation, obtained with an iterative 3σ clipping procedure. The dashed line shows the 3σ error. Galaxies deviating by more than 3σ from the best fit in the F200W-F444W vs. F200W plane are defined as red outliers. Here and throughout the paper, IDs are from Paris et al. (2023). |
Even though it seems the red outliers are equally distributed between the two environments, there is a hint that the amount of red excess is more significant in field galaxies. Given the selection function of our targets (see Sect. 2), we avoid drawing solid conclusions from these statistics.
Figure 2 further characterizes the spectroscopic sample in the context of the entire photometric sample (Vulcani et al. 2023) by showing the rest-frame B-V color as a function of stellar mass and the UVJ diagram (Labbé et al. 2005; Williams et al. 2009). As described in detail by Vulcani et al. (2023), we obtained rest-frame colors and stellar masses by fitting synthetic stellar templates to the available NIRCam photometry with ZPHOT (Fontana et al. 2000), following the same procedure described by Santini et al. (2023). Focusing on the color–mass diagram, three red outliers lie above the red sequence (17275, 23903, and 20646) – which is defined by fitting the entire cluster relation adopting a 3σ clipping method–, four are on the red sequence (22207, 4634, 15448, and 11984), and the rest are in the blue cloud. Object 23903 is the only galaxy in the sample that has broad lines indicative of AGNs in the MUSE spectra (Vulcani et al. 2023). Considering the non-red outliers, three are above (11580, 18066, and 13250), three are on (22197, 17429, and 21466), and two are below (14869 and 13453) the red sequence. Considering the UVJ diagram, four red outliers (5149, 11984, 22207, 20646) and six normal galaxies (17429, 13453, 11580, 21466, 13250, and 18066) are located in the passive region, while the rest are in the star forming or dusty region. While the two diagnostic tools – which have different sensitivity to the presence of dust – present a coherent view for the non-red outliers, they depict a different picture for the red outliers, highlighting the peculiarity of this population.
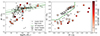 |
Fig. 2. Rest-frame colors of the galaxies. Stars and circles represent galaxies in the cluster and the field, respectively. Small symbols and gray colors show galaxies from Vulcani et al. (2023) not specifically targeted here. Larger symbols indicate the galaxies analyzed in the present paper and are color coded according to their Δ(F200W-F444W), which is measured as the difference between their measured color and the color they would have if they were on the red sequence given their F200W magnitude. The horizontal black line in the color bar shows the adopted threshold between normal galaxies and red outliers. Left: Rest-frame B-V vs. stellar mass diagram. The green line represents the best fit of the red sequence, along with the 3σ scatter. Right: Rest-frame U-V vs. V-J diagram. The green line represents the separation between star forming and passive galaxies from Labbé et al. (2005). |
Vulcani et al. (2023) underlined that almost half of the red outliers have a disturbed morphology, with field galaxies showing disturbances suggestive of ongoing or past interactions, and cluster galaxies showing tentative signs of gas stripping, that is, they have one-sided tails and no clear companion able to induce tidal interactions. Figure A.1 shows the color-composite images for the cluster and field targets. Half of the cluster red outliers, and also the reddest ones, show morphology consistent with ram-pressure stripping (7622, 7423, 6436) and two of these have already been the subject of extended analysis at optical wavelengths that indeed confirm ram-pressure stripping in action (Moretti et al. 2022; Vulcani et al. 2024; Khoram et al. 2024). Field galaxies instead show rather regular morphology, except for a few cases in which galaxies have close companions and might be undergoing some tidal effects (16695, 17019). In contrast, galaxies 13250 and 13453 have a close companion but present normal colors. Red colors are especially evident in the ram-pressure-stripped galaxies and in the edge-on field galaxies. None of the images reveal the presence of clear dust lanes.
4. Spectral analysis and results
4.1. Spectral features
Figures 3 and 4 show the NIRSpec rest-frame spectra for all cluster and field galaxies in our sample sorted by decreasing color excess, which is obtained as the difference between the galaxy color and the color it would have on the red sequence given its F200W magnitude. The spectra of all red outliers but three (11984, 5149 and 22207) are dominated by a strong feature at 3.3 μm, which is one of the PAHs. The three galaxies in which this feature is lacking are either on the red sequence or in the UVJ passive region in Fig. 2 and have passive spectra(see below). However, it is interesting to note that not all red sequence/UVJ passive red outliers lack the PAH feature. All the spectra of the three galaxies above the red sequence (17275, 23903, and 20646) have a clear PAH3.3 feature, but no other significant emission lines (e.g., lines of the Balmer, Paschen, or Bracket series); the spectra of the remaining two galaxies on the red sequence (4634 and 15448) are characterized by both PAH3.3 in emission and other emission lines. One passive galaxy according to the UVJ diagram (20646) has clear PAH3.3 in emission. There are therefore five galaxies that one would consider passive based on broad band color but show evidence of activity, and can be called “faux-passive”. In contrast, normal (i.e., non-red outlier) galaxies have no significant PAH3.3 emission. We return to this subject and quantify the emission-line measurements in the following section.
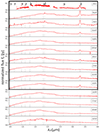 |
Fig. 3. JWST/NIRSpec rest-frame spectra for the cluster galaxies in our sample, sorted by decreasing red excess. Highlighted within the black box are the red outliers. Spectra are normalized so that the flux in the rest frame range 2.9 < λ[μm]< 3.1 is equal to one. |
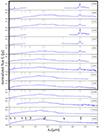 |
Fig. 4. JWST/NIRSpec rest-frame spectra for the field galaxies in our sample, sorted by decreasing red excess. Highlighted within the black box are the red outliers. Spectra are normalized so that the flux in the rest frame range 2.9 < λ[μm]< 3.1 is equal to one. |
For the galaxies whose spectrum shows a strong PAH3.3 feature, we show in Fig. 5 a zoom-in on the rest frame spectral region 3.2 < λ/μm < 3.6. Spectra are all normalized so that the area under the portion of the plotted spectra is equal to one. In this wavelength range, the spectrum is dominated by the PAH3.3 band and 3.4 μm aliphatic feature. In some cases, the two bands sit on top of a broad plateau that can extend up to ∼3.8 μm (Allamandola et al. 1989; Joblin et al. 1995).
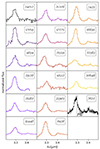 |
Fig. 5. JWST/NIRSpec rest-frame spectra for the galaxies in our sample, zoomed-in on the PAH feature. Spectra are normalized so that the shown area is equal to one. |
There is a variety of PAH3.3 profiles. At least in nearby sources and in our Milky Way, the peak position and width of this band have been found to be sensitive to the emission temperature (i.e., absorbed UV photon), charge, and size of the emitting molecules, with positive charges and smaller molecules shifting the peak to redder wavelengths (Joblin et al. 1995; Peeters et al. 2002; van Diedenhoven et al. 2004). A detailed characterization of the chemical composition and modes of the PAH3.3 is beyond the scope of this work, but it is interesting to stress the variety of profiles in our sample, which is indicative of a range of ongoing processes and elements.
Two features are worth highlighting: first of all, the galaxy with the broadest and shallowest feature is 23903, which is the one most likely hosting an AGN, although no X-ray detection is associated to this source in the archival data. This is in agreement with previous results, showing that if the equivalent width (EW) of the PAH3.3 emission is substantially smaller than that of starburst-dominated galaxies, then the most natural explanations for the PAH3.3 suppression are a significant contribution from an AGN to the observed 3–4 μm continuum or that those small grains are destroyed by the AGN (Imanishi & Dudley 2000; Imanishi 2001, 2006; Imanishi & Maloney 2003; Imanishi et al. 2006). Second, the only high-resolution spectrum we have at our disposal shows evidence of Pfδ emission in addition to PAH3.3 emission. In the same spectrum, sub-peaks can also be detected in the 3.4 μm band, and these are consistent with the existence of different C-H-stretch-emitting particles (Geballe et al. 1994).
The relative importance of the 3.4 μm aliphatic feature and the 3.3 μm aromatic feature changes from galaxy to galaxy. The variation of the 3.4 μm/3.3 μm ratio is indicative of the processing of dust particles in the ISM. The band intensity ratio decreases for positions closer to the star (Geballe et al. 1989; Joblin et al. 1995). In the following section, we quantify the ratio between the two.
4.2. Emission-line measurements
Of the 28 galaxies analyzed here, 22 have a spectroscopic redshift available in the literature (Vulcani et al. 2023). We determined the NIRSpec redshift of each spectrum through emission-line measurements by comparing the observed emission lines with their corresponding theoretical vacuum transitions. We give priority to the Hα line, followed by the Paα line. For galaxies with no emission lines, we adopt the previously determined redshift. In all cases, the agreement between the measured and literature redshift is of the order of 1%. For the remaining six galaxies, we use the redshifts measured from the spectra.
We then measured the emission-line fluxes and EW for all the visible lines using the Python package LIME (Fernández et al. 2024). We consider as reliable only those lines measured with a minimum signal-to-noise ratio of 3, assuming a Gaussian profile. At the resolution of the PRISM spectra, Hα and [NII] cannot be deblended, and so we fit them together.
To correct for the contamination by the [NII] line doublet, we applied the locally calibrated correction factor given by James et al. (2005): Hα/(Hα + [N II]) = 0.823. Given that all the galaxies but one are star forming based on the Baldwin et al. (1981) diagram (Vulcani et al. 2023), we assume this approach is appropriate.
We fit the NIRSpec 3 μm regime using CAFE2, a spectral decomposition tool that simultaneously fits the PAH features, dust continuum, and various atomic and molecular gas emission lines. This fit was conducted systematically throughout our sample. We focused on the 2.0–3.7 μm range, which includes the 3.3 μm PAH feature, the 3.4 aliphatic feature, the broad plateau feature that resides at the redder end of the PAH feature, and the water-ice absorption centered at 3.05 μm (as shown in Fig. 6).
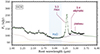 |
Fig. 6. Example of our spectral decomposition result using CAFE on source 6436, which has strong PAH emission together with relatively high ice opacity among the sample. Features of interest are labeled, including the 3.3 μm PAH feature, the 3.4 aliphatic feature, the broad plateau feature, and the water ice absorption at 3.05 μm. Yellow and red lines represent stellar and non-stellar continuum sources. Note that the adopted spectral coverage and simplified treatment do not allow us to obtain a physical significance to individual continuum components. |
Table A.1 reports the extinction-corrected measurements of the most important lines.
We confirm that the normal galaxies and three red outliers (11984, 5149, and 22207) have no detected emission lines (S/N of the Hα line < 5) and we consider them to be passive. We remind the reader that these three red outliers are also passive according to the UVJ diagram (see Sect. 3). While two of them are relatively close to the adopted separation between normal and red outliers, 11984 is particularly red. In the following analysis, we exclude all the non-emission-line galaxies. We discuss the origin of the red excess in these excluded galaxies in Sect. 5.1.3.
The ratio of the 3.4–3.3 μm fluxes ranges from 0 to 0.25 (see Table A.1), indicating that the 3.4 μm aliphatic feature is relatively weak in our sample. Similar results were obtained by Lai et al. (2020). In contrast, the ratio of the 3.45–3.3 μm fluxes ranges from 0.15 to 0.5, suggesting that the 3.45 μm might make a larger contribution to the total flux. The origin of this feature is still under debate, and it is not clear whether an aliphatic or aromatic feature contributes more to this broad plateau feature. In both cases, no correlation with the PAH3.3 EW nor the color excess emerges (plot not shown).
Figure 7 correlates the rest frame EW of the PAH3.3 with the galaxy F200W-F444W color. A correlation is seen, with redder galaxies showing a tendency to also have higher EW values. A Spearman correlation test confirms this result, with a correlation coefficient of 0.62 and a significance of p = 0.008. Most likely due to the small sample, no clear differences emerge between cluster and field galaxies. Symbols are color coded according to red excess. Galaxies with higher excess tend to have higher EW values. One of the galaxies that clearly stands out as having a lower EW than expected from its color is hosting an AGN, and the PAH3.3 emission might be altered by its presence. No information about the presence of AGNs is available for the other two galaxies (17275 and 20646).
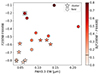 |
Fig. 7. F200W-F444W as a function of the rest frame equivalent width of the PAH, for cluster (stars) and field (circle) galaxies. Galaxies are color coded by their Δ(F200W-F444W), which is measured as the difference between their measured color and the color they should have if they were on the red sequence, given their F200W magnitude. The squared symbol indicates 23903, the only galaxy most likely hosting an AGN. |
We further compared the PAH3.3 EW with the Hα EW (for the galaxies for which this measurement is available) and with the galaxy stellar mass in Fig. 8. Overall, the strengths of the EWs show a correlation, even though the increase in the EW of PAH3.3 is faster than the increase in the EW of Hα. A Spearman correlation test supports this correlation, with a correlation coefficient of 0.6 and a significance of p = 0.001. The EW of PAH3.3 does not correlate with stellar mass (p = 0.88), even though it seems that only low-mass galaxies have high values of EW. Interestingly, the low-mass cluster galaxies with very high EW values (7622, 22043, 18708) are all ram-pressure-stripped galaxies (Moretti et al. 2022; Vulcani et al. 2024), suggesting a connection between ram-pressure stripping and strength of the PAH3.3. Indeed, when RPS is at play, the compression of the gas by the ISM induces an enhancement in star formation (Vulcani et al. 2018, 2020), which can appear as an increase in the PAH3.3 EW.
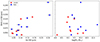 |
Fig. 8. Rest-frame EW of the PAH as a function of rest-frame EW of Hα (left) and stellar mass (right), for cluster (red) and field (blue) star forming galaxies. |
4.3. Star formation rate from PAH
Finally, we measured star formation rates (SFRs) from both the Hα and PAH3.3 fluxes and compare their values in Fig. 9. We obtained luminosities from fluxes, taking into account the redshift of the sources. We then correct the Hα luminosity for the presence of dust using the Paα luminosity. The intrinsic Hα/Paα decrement remains roughly constant for typical gas conditions in star-forming galaxies (Osterbrock 1989). In our analysis, we assume the intrinsic value of (Hα/Paα)int = 8.46, corresponding to a temperature of T = 104 K and an electron density of ne = 102 cm−3 for Case B recombination (Osterbrock 1989). This is a standard choice for star-forming galaxies in the literature. We then assumed a Cardelli et al. (1989) reddening curve and obtained the extinction at the Hα wavelength. The left panel of Fig. 9 shows the comparison between the observed Hα and Paα for the galaxies with both measurements. Galaxies are characterized by a wide range of extinction (see Table A.1), with a maximum AV of 3.1 (6436). The observed flux ratio is consistent with a mean of AV = 1.29.
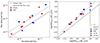 |
Fig. 9. Comparison between Hα properties and other emission lines. Left panel: Observed Paα vs. Hα fluxes for the subset of galaxies with both measurements. The dashed line shows the intrinsic ratio, corresponding to a temperature of T = 104 K and an electron density of ne = 102 cm−3 for Case B recombination (Osterbrock 1989). The dotted line corresponds to the ratio obtained assuming an E(B-V) = 0.41, which is the best fit to our data. Right panel: Comparison between the dust-corrected SFRs obtained from Hα and PAH3.3. In both panels, cluster galaxies are shown in red, and field galaxies are shown in blue. |
We measured Hα-based SFRs from Kennicutt (1998) for a Chabrier (2003) IMF: SFR = 4.6 × 10−42 × L(Hαint), with L(Hαint) dust-corrected luminosity measured in erg/s. To obtain SFRs from the PAH3.3 feature, we used the intrinsic PAH3.3 fluxes obtained by CAFE3 and then used the relation found in Lai et al. (2020) converted to a Chabrier (2003) IMF: logSFR = −(6.80 ± 0.18)+log[L(PAH3.3)/L⊙]–0.05. This relation has been calibrated against the [Ne II] (at 12.8 μm) and [Ne III] (at 15.6 μm) luminosities, which in turn have been calibrated by Ho & Keto (2007) against the Brα. The timescales for star formation are hence similar to those of the Hα, < 107 yr.
The right panel of Fig. 9 shows a tight correlation between the SFRs obtained from Hα and those obtained from the PAH3.3. Nonetheless, the values obtained from the PAH3.3 are systematically larger, by a factor of 3.5, on average. In Sect. 5.2, we discuss the possible origin and meaning of this discrepancy.
We note that for one galaxy (7622), we do not have the Hα line. We therefore used the Paα luminosity corrected for dust assuming AV = 1.29 found using the other galaxies. On the contrary, for three galaxies (16695, 17019, and 23128), we do not have the Paα line to correct for dust the SFR from Hα. The reported value in the plot is therefore corrected for dust assuming the average of AV = 1.29.
Finally, the 3.4/3.3 ratio seems to decrease with increasing SFR (plot not shown). This is in line with previous results: Yamagishi et al. (2012) found that the ratio decreases toward the center of the starburst galaxy M82, suggesting that the relative abundance of the aliphatic band carriers drops toward regions with more intense star formation. The decline of the 3.4/3.3 ratio in photodissociation regions is consistent with this picture, suggesting that an efficient photochemical process leads to the destruction of the aliphatic subgroups present on the periphery of PAHs (Joblin et al. 1996; Pilleri et al. 2015).
5. Discussion
5.1. Explaining the red excess
In the previous sections, we present a characterization of the spectral properties of the red outliers, mainly focusing on the PAH3.3 emission feature. Overall, we have identified three populations of red outliers: (i) 14 emission-line galaxies with also a clear PAH3.3 in emission, which are mostly located below the optical red sequence; (ii) three galaxies with PAH3.3 in emission, but rather weak emission lines (S/N of the Hα line of between 5 and 10), mostly located above the optical red sequence; and (iii) three passive galaxies. As a comparison, all the non-red outliers, regardless of their position on the rest-frame(B-V)–stellar-mass plane, are passive with no PAH3.3 in emission. In this section, we connect these results, proposing a scenario able to explain our findings.
5.1.1. Emission-line galaxies
In galaxies of the first group, the PAH3.3 EW is of the order of 0.04–0.25 μm, its strength increases with increasing color excess, the dust extinction is moderate (average E(B-V) = 0.32), and SFRs range from 0.1 to 10 M⊙/yr. The SFR from PAH3.3 is about a factor of three higher than that inferred from Hα. This group most likely includes normal star forming galaxies, where H II regions, molecular gas, and photodissociation regions are spatially well mixed (Imanishi et al. 2008). Moorwood (1986) showed that the PAH3.3 EW values in starbursts have an average value of 0.1 μm, with some scatter, but never fall below 0.04 μm. Based on Spitzer/IRS spectra, Inami et al. (2018) proposed a revised starburst/AGN diagnostic diagram, pushing the limit to PAH3.3 EW > 0.06 for starbursts. According to this new definition, 22383 and 10512 might host an AGN. Both galaxies are close to the red sequence separation and do not show any particular behavior, and so we can conclude that the evidence for AGNs is not particularly compelling. The detection of the PAH3.3 suggests the presence of the neutral, smallest PAH population in the interstellar medium (ISM), typically with a radius of ∼5 Å or NC ∼ 50 carbon atoms (Schutte et al. 1993; Draine & Li 2007).
We investigated whether or not the measured values of the PAH3.3 EW are sufficient to explain the observed color excess. We can estimate the maximum contribution of the PAH3.3 EW to the F444W flux given the measured observed values. We assume that FF444W = FPAH3.3, cont × ΔFF444W + FPAH3.3, obs, with FF444W being measured NIRCam flux in the F444W filter, FPAH3.3, cont the observed continuum flux measured on the NIRSpec spectrum at the PAH3.3 wavelength, ΔFF444W being the width of the NIRCAM F444W filter, and FPAH3.3, obs being the observed PAH3.3 measured flux. Considering that we can express the PAH3.3 flux as PAH3.3 EW × FPAH3.3, cont, for a PAH3.3 EW = 0.1 μm at the cluster redshift z = 0.3068, corresponding to an observed value of 0.1307 μm, and ΔFF444W = 1.024 μm, the contribution of the line to the total F444W flux is 12.7%, which translates to a variation in galaxy color of 0.13 mag. This simple calculation indicates that while the PAH line is certainly non-negligible, its presence alone cannot explain the color excess, which can be as high as 0.6 mag. A contribution from the dust component is hence needed to explain the colors.
5.1.2. Weak-emission-line galaxies
As mentioned above, 17275, 23903, and 20646 are the three red excess galaxies that, despite having PAH3.3 in emission, have other, rather weak emission lines (S/N of the Hα line between 5 and 10). The same three galaxies are the only ones above the red sequence in Fig. 1 and two of them are also outliers in the F200W-F444W versus PAH3.3 EW plane (Fig. 7). One of these galaxies hosts an AGN according to the MUSE spectra (Vulcani et al. 2023), while no optical spectra are available for the other two galaxies. Even though their PAH3.3 EW is > 0.06 μm, our results might suggest they are all obscured AGN–starburst composite galaxies. Indeed, if a highly dust-obscured AGN is present, then absorption features at 3.1 and 3.4 μm produced by ice-covered dust and bare carbonaceous dust, respectively, should be found (Imanishi & Dudley 2000; Imanishi & Maloney 2003; Risaliti et al. 2003, 2006; Imanishi et al. 2006). According to the CAFE fit, Fig. 10 shows that these three weak emission-line galaxies have relatively strong ice absorption, although are not the strongest of the whole sample. We can therefore not firmly establish the presence of AGNs. It is interesting to mention that the galaxy with the strongest absorption feature is 6436, which is a ram-pressure stripped galaxy and also the galaxy with the strongest AV value.
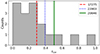 |
Fig. 10. Distribution of the water absorption feature τice for the emission line and weak emission-line galaxies as measured from the CAFE fit. The values of the three weak emission-line galaxies are highlighted. |
5.1.3. Passive galaxies
Eleven galaxies in our sample have no significant emission lines (S/N of the Hα line < 5). This group includes all eight of the galaxies that are not red outliers. These non-red outliers were selected for lying in various regions of the color–mass and UVJ diagrams, but are also the galaxies that had blue colors or were supposed to be star forming but turned out to be passive. Nevertheless, we remind the reader that this sample is not representative of all galaxies on the color–mass diagram. As explained in Sect. 2, our targets were used as fillers in different programs, and therefore did not have high priority in the preparation of the NIRSpec/MSA masks. As a result, we have no cases in our sample of star forming galaxies with blue rest-frame optical colors and normal F200W-F444W color. From our sample, we can conclude that galaxies with normal F200W-F444W color have no strong PAH3.3 emission.
On the other hand, we found three galaxies (11984, 22207, and 5149) that despite having red F200W-F444W color, do not have PAH3.3 or any other lines in emission. While it is true that these galaxies lie close to the adopted separation between normal and red outliers and could be simply misclassified, other galaxies with similar red excess do show PAH3.3 in emission. In these cases, red colors are simply related to the red colors of the evolved stellar populations, and indeed they are consistent with the colors expected from pure stellar models. We calculated the observed F200W-F444W color for a single stellar population (SSP) model at various metallicities (Charlot and Bruzual, priv. comm.) and found that colors above –0.8 can be easily achieved for both relatively low metallicity and even for solar values (Z = 0.017).
We also exploited the spectral synthesis code SImulatiNg OPtical Spectra wIth Stellar populations models (SINOPSIS; Fritz et al. 2007, 2011, 2017) to look for differences in the stellar age properties between these three galaxies and the other normal red sequence galaxies. We found no clear differences in terms of age or star formation history between the two groups. Given the small sample sizes and the resolution of the spectra, it is hard to establish whether this lack of difference is real or due to statistics or data quality, and we refrain from drawing solid conclusions.
5.2. The discrepancy between Hα- and PAH3.3-based SFRs
In Sect. 4.3, we demonstrate the existence of a clear correlation between the SFRs obtained from Hα and corrected for dust based on the hydrogen line ratio, and those obtained from the PAH3.3. Nonetheless, the values obtained from the PAH3.3 are systematically larger by a factor of 3.5 on average.
One possible explanation for this discrepancy is that the dust correction is insufficient, causing Hα-based values to be underestimated. This can happen if the intrinsic Paschen/Balmer ratio is not sufficient to capture all the dust enshrouding the star formation or if the geometry of the dust is different at the Hα and PAH3.3 wavelengths.
As discussed in Lai et al. (2020), different geometries can be explored in the modeling for the MIR spectral decomposition. Two reliable examples are the “fully mixed” and “obscured continuum” geometries, which should bracket realistic scenarios of PAH emission and silicate absorption in galaxies. Briefly, in the fully mixed case, stars and dust are spatially well mixed, with both PAH+line and continuum emission subject to a similar range of attenuation. In contrast, the obscured continuum scheme consists of a concentrated continuum-emitting source plus unobscured PAH emitters on top of the continuum. In such cases, PAH band strengths are measured with their local continua, and their emission sources are presumed to lie in the “foreground” of the extinction-impact continuum sources. Thus, PAH emission remains free from extinction correction. The former case typically holds for normal star forming regions, while the latter is typically invoked when galaxies are powered by a buried AGN or compact central starburst with only H II regions, because in these cases the obscuration comes predominantly from the central part of the system, while the PAH/line emissions excited by stars in the outer part are mostly not attenuated (Imanishi et al. 2007, 2008). To identify the most probable scenario, following Calabrò et al. (2018), in Fig. 11 we consider only the galaxies with reliable Hα and Paα measurements and compare the ratio of Hα and Paα (Paschen-Balmer decrement) to the ratio of SFRs derived from the observed Paα and the PAH (APaα, IRX = 2.5 × log(1 + SFRPAH, tot/SFRPaα, obs)), assuming it traces the total SFR. These two ratios, which are both independent measures of attenuation, do not generally scale as predicted by the Calzetti et al. (2000) and Cardelli et al. (1989) attenuation curves, suggesting those models are not a good representation of the dust distribution in these galaxies. The value of Paα/Hα, on the other hand, saturates around –0.1, which is qualitatively consistent with an optically thick “mixed model” in which different lines probe different optical depths. A more thorough analysis is beyond the scope of this paper and will be addressed in a forthcoming study.
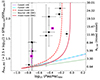 |
Fig. 11. Diagram comparing the ratio of Hα and Paα and APaα, IRX, that is the ratio of SFRs derived from the observed Paα and the PAH (APaα, IRX = 2.5 × log(1 + SFRPAH, tot/SFRPaα, obs)). Purple squares represent weighted average values in bins of Paα/Hα ratios. Expected values obtained considering different attenuation laws are also overplotted, as explained in the key. |
Alternatively, there could be a bias in the star formation traced by the PAH3.3. PAH emission can indeed be used as a star formation tracer in galaxies, but only when the excitation of PAH molecules is mostly due to UV photons from the massive young stars (e.g., Peeters et al. 2004a; Xie & Ho 2019). However, the nature and the properties of the PAH molecules remain poorly understood and this could affect the use of PAH emission as an indicator of star formation activity.
Studies have explored the effect of star formation on the properties of the associated PAH molecules. For example, Riener et al. (2018) investigated the impact of high-energy photons on the dust particles associated with HII regions that are linked to star formation. Chastenet et al. (2023) used JWST observations to explore the properties of PAHs associated with HII regions, finding evidence for heating and/or changes in PAH size in regions with higher molecular gas content, and increased ionization in regions with higher Hα intensity.
Ujjwal et al. (2024) combined JWST and UVIT observations and analyzed how the star formation influences the properties of PAH molecules that are spatially associated with the regions undergoing active star formation. These authors concluded that the PAH molecules excited by the photons from star-forming regions with higher SFR surface density are significantly smaller and ionized molecules. UV photons from the star-forming regions could be the reason for the higher fraction of the ionized PAHs. These authors suggested that the effect of the high temperature combined with the formation of smaller PAH molecules in the star-forming regions might also result in the higher emission at 3.3 μm.
Finally, JWST observations also show diffuse extended PAH emission not spatially associated with the star-forming regions, suggesting that the PAH can be heated by interstellar radiation field (e.g., Evans et al. 2022). Therefore, the observed total PAH3.3 may also include the contribution from interstellar radiation field, which, if not correctly taken into account, would bias the SFR estimates.
6. Summary
Vulcani et al. (2023) unveiled the existence of a population of galaxies with surprisingly red F200W-F444W color that do not stand out with regard to any other integrated property. This population exists in both the cluster A2744 and the surrounding field. In the present paper, we further characterized this population thanks to new spectroscopic observations taken with JWST/NIRSpec. Our main results can be summarized as follows:
-
Red outliers – defined as galaxies whose F200W-F444W color is redder than three times the width of the red sequence of the entire population – can be subdivided into three groups: (i) emission-line galaxies with also a clear PAH3.3 in emission, which are mostly located below (i.e., bluer than) the optical red sequence; (ii) galaxies with PAH3.3 in emission but with rather weak emission lines (S/N of the Hα line of between 5 and 10), mostly located above (i.e., redder than) the optical red sequence; and (iii) passive galaxies. The first group is the most common.
-
In the emission-line galaxies, the F200W-F444W color excess correlates with the EW of the PAH3.3: the higher the excess, the higher the strength of the EW. Nonetheless, the presence of the PAH cannot fully account for the color excess, as an EW of ∼0.1 μm is expected to increase the color by only 0.13 mag.
-
The weak emission-line galaxies are also outliers in the F200W-F444W versus EW(PAH3.3) plane and are located above the red sequence. Spectral fitting identifies strong ice absorption features. This evidence points to the presence of an AGN.
-
The passive galaxies have no PAH3.3. Their red color is due to ageing of the stellar population.
-
The non-red-outlier galaxies in our sample are all passive and have no PAH3.3 in emission, confirming that the PAH3.3 feature is linked to star formation activity.
-
Even within our small sample, a variety of PAH3.3 profiles emerges, suggesting a variety of emitting molecules with a range of sizes. Also, the relative importance of the 3.4 and 3.45 μm features and the 3.3 μm aromatic feature changes from galaxy to galaxy, indicating that the dust particles have a different chemical composition.
-
In the star forming galaxies, both the intrinsic PAH3.3 EW and flux correlate with the intrinsic Hα EW and flux, suggesting that they are produced by the same mechanism. Nonetheless, the dust-corrected SFR from PAH3.3 is a factor of three higher than the SFR obtained from Hα, suggesting red outliers are characterized by a significant amount of dust that is not captured by the ratio of hydrogen lines.
-
Overall, no clear differences are detected between cluster and field galaxies in terms of the occurrence and properties of the PAH3.3 emission lines and of the galaxies. However, this result is most likely due to the small size of our sample and the way targets were selected, and so a larger sample will be needed to explore this aspect further.
Our analysis reveals that the objects we refer to as red outliers are actually a mixture of normal dusty star forming galaxies, AGNs, and passive systems. Combining the color selection in the NIR, as done in Fig. 1, with more traditional color–mass and UVJ diagrams could provide a cleaner sample of star forming systems.
We note that 23983, 21319, 21466, and 20646 have no F200W values. The F200W values are hence extrapolated using the F150W flux. Results are robust against this choice and remain valid whether we select galaxies in the F150W-F444W plane or exclude those galaxies from the analysis.
Using the observed fluxes and correcting them using a Cardelli et al. (1989) law give consistent results.
Acknowledgments
We thank the referee for their useful suggestions that helped us improving the manuscript. We thank Guido Roberts-Borsani for his help on data reduction and calibration and Sedona Price and the UNCOVER team for sharing their spectra with us. B.V. thanks the Department of Physics and Astronomy, University of California, Los Angeles, for a very pleasant and productive stay during which most of the work presented in this paper was carried out. The data were obtained from the Mikulski Archive for Space Telescopes at the Space Telescope Science Institute, which is operated by the Association of Universities for Research in Astronomy, Inc., under NASA contract NAS 5-03127 for JWST. These observations are associated with programs JWST-ERS-1324, JWST-GO-3073, and JWST-GO-2561. The specific observations associated with program JWST-GO-3073 can be accessed via https://doi.org/10.17909/4r6b-bx96. We acknowledge financial support from NASA through grants JWST-ERS-1324 and JWST-GO-3073. This project has received funding from the European Research Council (ERC) under the Horizon 2020 research and innovation programme (grant agreement N. 833824). We also acknowledge support from the INAF Large Grant 2022 ‘Extragalactic Surveys with JWST’ (PI Pentericci), from PRIN 2022 MUR project 2022CB3PJ3 – First Light And Galaxy aSsembly (FLAGS) funded by the European Union – Next Generation EU, and from INAF Mini-grant “Reionization and Fundamental Cosmology with High-Redshift Galaxies”. B.V. is supported by the European Union – NextGenerationEU RFF M4C2 1.1 PRIN 2022 project 2022ZSL4BL INSIGHT. PS acknowledges INAF Mini Grant 2022 “The evolution of passive galaxies through cosmic time”.
References
- Allamandola, L. J., Tielens, G. G. M., & Barker, J. R. 1989, ApJSS, 71, 733 [NASA ADS] [CrossRef] [Google Scholar]
- Aussel, H., Cesarsky, C. J., Elbaz, D., et al. 1999, A&A, 342, 313 [NASA ADS] [Google Scholar]
- Bai, L., Marcillac, D., Rieke, G. H., et al. 2007, ApJ, 664, 181 [NASA ADS] [CrossRef] [Google Scholar]
- Baldwin, J. A., Phillips, M. M., & Terlevich, R. 1981, PASP, 93, 5 [Google Scholar]
- Bauschlicher, C. W., Jr., Peeters, E., & Allamandola, L. J. 2008, ApJ, 678, 316 [NASA ADS] [CrossRef] [Google Scholar]
- Bauschlicher, C. W., Peeters, E., & Allamandola, L. J. 2009, ApJ, 697, 311 [NASA ADS] [CrossRef] [Google Scholar]
- Belfiore, F., Leroy, A. K., Williams, T. G., et al. 2023, A&A, 678, A129 [NASA ADS] [CrossRef] [EDP Sciences] [Google Scholar]
- Bergamini, P., Acebron, A., Grillo, C., et al. 2023, A&A, 670, A60 [NASA ADS] [CrossRef] [EDP Sciences] [Google Scholar]
- Bezanson, R., Labbe, I., Whitaker, K. E., et al. 2024, ApJ, 974, 92 [NASA ADS] [CrossRef] [Google Scholar]
- Blain, A. W., Smail, I., Ivison, R. J., Kneib, J. P., & Frayer, D. T. 2002, Phys. Rep., 369, 111 [Google Scholar]
- Braglia, F. G., Pierini, D., Biviano, A., & Böhringer, H. 2009, A&A, 500, 947 [NASA ADS] [CrossRef] [EDP Sciences] [Google Scholar]
- Calabrò, A., Daddi, E., Cassata, P., et al. 2018, ApJ, 862, L22 [Google Scholar]
- Calzetti, D., Armus, L., Bohlin, R. C., et al. 2000, ApJ, 533, 682 [NASA ADS] [CrossRef] [Google Scholar]
- Capak, P. L., Riechers, D., Scoville, N. Z., et al. 2011, Nature, 470, 233 [Google Scholar]
- Cardelli, J. A., Clayton, G. C., & Mathis, J. S. 1989, ApJ, 345, 245 [Google Scholar]
- Castellano, M., Napolitano, L., Fontana, A., et al. 2024, ApJ, 972, 143 [Google Scholar]
- Cen, R., Pop, A. R., & Bahcall, N. A. 2014, Proc. Natl. Acad. Sci. USA, 111, 7914 [NASA ADS] [CrossRef] [Google Scholar]
- Chabrier, G. 2003, PASP, 115, 763 [Google Scholar]
- Chary, R., & Elbaz, D. 2001, ApJ, 556, 562 [Google Scholar]
- Chastenet, J., Sutter, J., Sandstrom, K., et al. 2023, ApJ, 944, L12 [NASA ADS] [CrossRef] [Google Scholar]
- Coppin, K., Swinbank, M., Neri, R., et al. 2008, MNRAS, 389, 45 [CrossRef] [Google Scholar]
- Dale, D. A., Boquien, M., Barnes, A. T., et al. 2023, ApJ, 944, L23 [NASA ADS] [CrossRef] [Google Scholar]
- Desai, V., Soifer, B. T., Dey, A., et al. 2009, ApJ, 700, 1190 [NASA ADS] [CrossRef] [Google Scholar]
- Draine, B. T., & Li, A. 2001, ApJ, 551, 807 [NASA ADS] [CrossRef] [Google Scholar]
- Draine, B. T., & Li, A. 2007, ApJ, 657, 810 [CrossRef] [Google Scholar]
- Duc, P. A., Poggianti, B., Elbaz, D. F. D., et al. 2002, A&A, 382, 60 [NASA ADS] [CrossRef] [EDP Sciences] [Google Scholar]
- Evans, A. S., Frayer, D. T., Charmandaris, V., et al. 2022, ApJ, 940, L8 [NASA ADS] [CrossRef] [Google Scholar]
- Fadda, D., Yan, L., Lagache, G., et al. 2010, ApJ, 719, 425 [NASA ADS] [CrossRef] [Google Scholar]
- Fernández, V., Amorín, R., Firpo, V., & Morisset, C. 2024, A&A, 688, A69 [NASA ADS] [CrossRef] [EDP Sciences] [Google Scholar]
- Flagey, N., Boulanger, F., Verstraete, L., et al. 2006, A&A, 453, 969 [NASA ADS] [CrossRef] [EDP Sciences] [Google Scholar]
- Floc’h, E. L., Perez-Gonzalez, P. G., Rieke, G. H., et al. 2004, ApJS, 154, 170 [CrossRef] [Google Scholar]
- Fontana, A., D’Odorico, S., Poli, F., et al. 2000, AJ, 120, 2206 [NASA ADS] [CrossRef] [Google Scholar]
- Fritz, J., Poggianti, B. M., Bettoni, D., et al. 2007, A&A, 470, 137 [NASA ADS] [CrossRef] [EDP Sciences] [Google Scholar]
- Fritz, J., Poggianti, B. M., Cava, A., et al. 2011, A&A, 526, A45 [NASA ADS] [CrossRef] [EDP Sciences] [Google Scholar]
- Fritz, J., Moretti, A., Gullieuszik, M., et al. 2017, ApJ, 848, 132 [NASA ADS] [CrossRef] [Google Scholar]
- Geach, J. E., Smail, I., Ellis, R. S., et al. 2006, ApJ, 649, 661 [NASA ADS] [CrossRef] [Google Scholar]
- Geballe, T. R., Tielens, A. G. G. M., Allamandola, L. J., Moorhouse, A., & Brand, P. W. J. L. 1989, ApJ, 341, 278 [NASA ADS] [CrossRef] [Google Scholar]
- Geballe, T. R., Joblin, C., D’Hendecourt, L. B., et al. 1994, ApJ, 434, L15 [NASA ADS] [CrossRef] [Google Scholar]
- Genzel, R., Lutz, D., Sturm, E., et al. 1998, ApJ, 498, 579 [Google Scholar]
- Gunn, J. E., & Gott, J. R. 1972, ApJ, 176, 1 [NASA ADS] [CrossRef] [Google Scholar]
- Hainline, L. J., Blain, A. W., Smail, I., et al. 2009, ApJ, 699, 1610 [Google Scholar]
- Ho, L. C., & Keto, E. 2007, ApJ, 658, 314 [Google Scholar]
- Hopkins, P. F., Hernquist, L., Cox, T. J., & Kereš, D. 2008, ApJSS, 175, 356 [NASA ADS] [CrossRef] [Google Scholar]
- Hughes, D., Serjeant, S., Dunlop, J., et al. 1998, Nature, 394, 241 [NASA ADS] [CrossRef] [Google Scholar]
- Imanishi, M. 2001, AJ, 121, 1927 [NASA ADS] [CrossRef] [Google Scholar]
- Imanishi, M. 2006, AJ, 131, 2406 [NASA ADS] [CrossRef] [Google Scholar]
- Imanishi, M., & Dudley, C. C. 2000, ApJ, 545, 701 [NASA ADS] [CrossRef] [Google Scholar]
- Imanishi, M., & Maloney, P. R. 2003, ApJ, 588, 165 [NASA ADS] [CrossRef] [Google Scholar]
- Imanishi, M., Dudley, C. C., & Maloney, P. R. 2006, ApJ, 637, 114 [NASA ADS] [CrossRef] [Google Scholar]
- Imanishi, M., Dudley, C. C., Maiolino, R., et al. 2007, ApJSS, 171, 72 [NASA ADS] [CrossRef] [Google Scholar]
- Imanishi, M., Nakagawa, T., Ohyama, Y., et al. 2008, PASJ, 60, 489 [Google Scholar]
- Imanishi, M., Nakagawa, T., Shirahata, M., Ohyama, Y., & Onaka, T. 2010, ApJ, 721, 1233 [CrossRef] [Google Scholar]
- Inami, H., Armus, L., Matsuhara, H., et al. 2018, A&A, 617, A130 [NASA ADS] [CrossRef] [EDP Sciences] [Google Scholar]
- Jáchym, P., Palouš, J., Köppen, J., & Combes, F. 2007, A&A, 472, 5 [NASA ADS] [CrossRef] [EDP Sciences] [Google Scholar]
- James, P. A., Shane, N. S., Knapen, J. H., Etherton, J., & Percival, S. M. 2005, A&A, 429, 851 [NASA ADS] [CrossRef] [EDP Sciences] [Google Scholar]
- Joblin, C., Tielens, A. G., Allamandola, L. J., et al. 1995, Planet. Space Sci., 43, 1189 [Google Scholar]
- Joblin, C., Tielens, A. G. G. M., Allamandola, L. J., & Geballe, T. R. 1996, ApJ, 458, 610 [NASA ADS] [CrossRef] [Google Scholar]
- Kennicutt, R. C. 1998, ApJ, 498, 541 [NASA ADS] [CrossRef] [Google Scholar]
- Khoram, A., Poggianti, B., Moretti, A., et al. 2024, A&A, 686, A261 [NASA ADS] [CrossRef] [EDP Sciences] [Google Scholar]
- Kim, J. H., Im, M., Lee, H. M., et al. 2012, ApJ, 760, 120 [NASA ADS] [CrossRef] [Google Scholar]
- Koyama, Y., Kodama, T., Shimasaku, K., et al. 2008, MNRAS, 391, 1758 [Google Scholar]
- Koyama, Y., Kodama, T., Shimasaku, K., et al. 2010, MNRAS, 403, 1611 [NASA ADS] [CrossRef] [Google Scholar]
- Krick, J. E., Surace, J. A., Thompson, D., et al. 2009, ApJ, 700, 123 [NASA ADS] [CrossRef] [Google Scholar]
- Labbé, I., Huang, J., Franx, M., et al. 2005, ApJ, 624, L81 [Google Scholar]
- Lai, T. S.-Y., Smith, J. D. T., Baba, S., Spoon, H. W. W., & Imanishi, M. 2020, ApJ, 905, 55 [NASA ADS] [CrossRef] [Google Scholar]
- Lai, T. S. Y., Armus, L., U, V., et al. 2022, ApJ, 941, L36 [NASA ADS] [CrossRef] [Google Scholar]
- Lai, T. S.-Y., Armus, L., Bianchin, M., et al. 2023, ApJ, 957, L26 [NASA ADS] [CrossRef] [Google Scholar]
- Lin, Y. W., Wu, C. K., Ling, C. T., et al. 2024, MNRAS, 527, 11882 [Google Scholar]
- Lotz, J. M., Koekemoer, A., Coe, D., et al. 2016, ApJ, 837, 97 [Google Scholar]
- Lu, N. 2004, ApJSS, 154, 286 [NASA ADS] [CrossRef] [Google Scholar]
- Lu, N., Helou, G., Werner, M. W., et al. 2003, ApJ, 588, 199 [NASA ADS] [CrossRef] [Google Scholar]
- Magnelli, B., Chary, R. R., Pope, A., et al. 2008, ApJ, 681, 258 [NASA ADS] [CrossRef] [Google Scholar]
- Mahler, G., Richard, J., Clément, B., et al. 2018, MNRAS, 473, 663 [Google Scholar]
- Marcillac, D., Rigby, J. R., Rieke, G. H., & Kelly, D. M. 2007, ApJ, 654, 825 [NASA ADS] [CrossRef] [Google Scholar]
- Marleau, F. R., Fadda, D., Storrie-Lombardi, L. J., et al. 2004, ApJS, 154, 66 [NASA ADS] [CrossRef] [Google Scholar]
- Martig, M., & Bournaud, F. 2008, MNRAS, 385, L38 [NASA ADS] [Google Scholar]
- Mascia, S., Roberts-Borsani, G., Treu, T., et al. 2024, A&A, 690, A2 [NASA ADS] [CrossRef] [EDP Sciences] [Google Scholar]
- Menéndez-Delmestre, K., Blain, A. W., Smail, I., et al. 2009, ApJ, 699, 667 [CrossRef] [Google Scholar]
- Mentuch, E., Abraham, R. G., Glazebrook, K., et al. 2009, ApJ, 706, 1020 [NASA ADS] [CrossRef] [Google Scholar]
- Merlin, E., Bonchi, A., Paris, D., et al. 2022, ApJ, 938, L14 [NASA ADS] [CrossRef] [Google Scholar]
- Moore, B., Katz, N., Lake, G., Dressler, A., & Oemler, A. 1996, Nature, 379, 613 [Google Scholar]
- Moorwood, A. F. M. 1986, A&A, 166, 4 [NASA ADS] [Google Scholar]
- Moretti, A., Radovich, M., Poggianti, B. M., et al. 2022, ApJ, 925, 4 [NASA ADS] [CrossRef] [Google Scholar]
- Morishita, T., Roberts-Borsani, G., Treu, T., et al. 2023, ApJ, 947, L24 [NASA ADS] [CrossRef] [Google Scholar]
- Murakami, H., Baba, H., Barthel, P., et al. 2007, PASJ, 59, 369 [Google Scholar]
- Murata, K., Koyama, Y., Tanaka, M., Matsuhara, H., & Kodama, T. 2015, A&A, 581, A114 [NASA ADS] [CrossRef] [EDP Sciences] [Google Scholar]
- Napolitano, L., Castellano, M., Pentericci, L., et al. 2025, A&A, 693, A50 [NASA ADS] [CrossRef] [EDP Sciences] [Google Scholar]
- Osterbrock, D. E. 1989, Astrophysics of Gaseous Nebulae and Active Galactic Nuclei (University Science Books), 408 [Google Scholar]
- Owers, M. S., Randall, S. W., Nulsen, P. E., et al. 2011, ApJ, 728, 27 [NASA ADS] [CrossRef] [Google Scholar]
- Paris, D., Merlin, E., Fontana, A., et al. 2023, ApJ, 952, 20 [CrossRef] [Google Scholar]
- Pearson, J., Serjeant, S., Wang, W. H., et al. 2024, MNRAS, 527, 12044 [Google Scholar]
- Peeters, E., Tielens, A. G. G. M., van Kerckhoven, C., et al. 2002, in Astronomical Society of the Pacific Conference Series, ed. P. Crowther, Hot Star Workshop III: The Earliest Phases of Massive Star Birth, 267, 403 [NASA ADS] [Google Scholar]
- Peeters, E., Spoon, H. W. W., & Tielens, A. G. G. M. 2004a, ApJ, 613, 986 [NASA ADS] [CrossRef] [Google Scholar]
- Peeters, E., Mattioda, A. L., Hudgins, D. M., & Allamandola, L. J. 2004b, ApJ, 617, L65 [NASA ADS] [CrossRef] [Google Scholar]
- Pilleri, P., Joblin, C., Boulanger, F., & Onaka, T. 2015, A&A, 577, A16 [NASA ADS] [CrossRef] [EDP Sciences] [Google Scholar]
- Pope, A., Chary, R., Alexander, D. M., et al. 2008, ApJ, 675, 1171 [NASA ADS] [CrossRef] [Google Scholar]
- Price, S. H., Bezanson, R., Labbe, I., et al. 2024, ApJ, submitted [arXiv:2408.03920] [Google Scholar]
- Reuter, C., Spilker, J. S., Vieira, J. D., et al. 2023, ApJ, 948, 44 [NASA ADS] [CrossRef] [Google Scholar]
- Richard, J., Claeyssens, A., Lagattuta, D., et al. 2021, A&A, 646, A83 [EDP Sciences] [Google Scholar]
- Riechers, D. A., Pope, A., Daddi, E., et al. 2014, ApJ, 786, 31 [NASA ADS] [CrossRef] [Google Scholar]
- Riener, M., Faesi, C. M., Forbrich, J., & Lada, C. J. 2018, A&A, 612, A81 [NASA ADS] [CrossRef] [EDP Sciences] [Google Scholar]
- Rigopoulou, D., Spoon, H. W. W., Genzel, R., et al. 1999, AJ, 118, 2625 [Google Scholar]
- Risaliti, G., Maiolino, R., Marconi, A., et al. 2003, ApJ, 595, L17 [NASA ADS] [CrossRef] [Google Scholar]
- Risaliti, G., Maiolino, R., Marconi, A., et al. 2006, MNRAS, 365, 303 [NASA ADS] [CrossRef] [Google Scholar]
- Roberts-Borsani, G., Morishita, T., Treu, T., et al. 2022, ApJ, 938, L13 [NASA ADS] [CrossRef] [Google Scholar]
- Roberts-Borsani, G., Treu, T., Shapley, A., et al. 2024, ApJ, 976, 193 [NASA ADS] [CrossRef] [Google Scholar]
- Rodriguéz-Ardila, A., & Viegas, S. M. 2003, MNRAS, 340, L33 [CrossRef] [Google Scholar]
- Saintonge, A., Tran, K.-V. H., & Holden, B. P. 2008, ApJ, 685, L113 [NASA ADS] [CrossRef] [Google Scholar]
- Sanders, D. B., Mirabel, I. F., Sanders, D. B., & Mirabel, I. F. 1996, ARA&A, 34, 749 [NASA ADS] [CrossRef] [Google Scholar]
- Santini, P., Fontana, A., Castellano, M., et al. 2023, ApJ, 942, L27 [NASA ADS] [CrossRef] [Google Scholar]
- Schutte, W. A., Tielens, A. G. G. M., & Allamandola, L. J. 1993, ApJ, 415, 397 [NASA ADS] [CrossRef] [Google Scholar]
- Smail, I., Ivison, R. J., & Blain, A. W. 1997, ApJ, 490, L5 [NASA ADS] [CrossRef] [Google Scholar]
- Steinhardt, C. L., Jauzac, M., Acebron, A., et al. 2020, ApJSS, 247, 64 [NASA ADS] [CrossRef] [Google Scholar]
- Tacconi-Garman, L. E., Sturm, E., Lehnert, M., et al. 2005, A&A, 432, 91 [NASA ADS] [CrossRef] [EDP Sciences] [Google Scholar]
- Tielens, A. G. 2008, ARAA, 46, 289 [NASA ADS] [CrossRef] [Google Scholar]
- Tommasin, S., Spinoglio, L., Malkan, M. A., et al. 2008, ApJ, 676, 836 [NASA ADS] [CrossRef] [Google Scholar]
- Tran, Q. D., Lutz, D., Genzel, R., et al. 2001, ApJ, 552, 527 [NASA ADS] [CrossRef] [Google Scholar]
- Treu, T., Schmidt, K. B., Brammer, G. B., et al. 2015, ApJ, 812, 114 [Google Scholar]
- Treu, T., Roberts-Borsani, G., Bradac, M., et al. 2022, ApJ, 935, 110 [NASA ADS] [CrossRef] [Google Scholar]
- Ujjwal, K., Kartha, S. S., Akhil, K. R., et al. 2024, A&A, 684, A71 [NASA ADS] [CrossRef] [EDP Sciences] [Google Scholar]
- van Diedenhoven, B., Peeters, E., Van Kerckhoven, C., et al. 2004, ApJ, 611, 928 [NASA ADS] [CrossRef] [Google Scholar]
- Voit, G. M. 1992, MNRAS, 258, 841 [NASA ADS] [CrossRef] [Google Scholar]
- Vulcani, B., Poggianti, B. M., Gullieuszik, M., et al. 2018, ApJ, 866, L25 [Google Scholar]
- Vulcani, B., Poggianti, B. M., Tonnesen, S., et al. 2020, ApJ, 899, 98 [Google Scholar]
- Vulcani, B., Treu, T., Calabrò, A., et al. 2023, ApJ, 948, L15 [NASA ADS] [CrossRef] [Google Scholar]
- Vulcani, B., Moretti, A., Poggianti, B. M., et al. 2024, A&A, 682, A117 [NASA ADS] [CrossRef] [EDP Sciences] [Google Scholar]
- Williams, R. J., Quadri, R. F., Franx, M., van Dokkum, P., & Labbé, I. 2009, ApJ, 691, 1879 [NASA ADS] [CrossRef] [Google Scholar]
- Xie, Y., & Ho, L. C. 2019, ApJ, 884, 136 [CrossRef] [Google Scholar]
- Yamagishi, M., Kaneda, H., Ishihara, D., et al. 2012, A&A, 541, A10 [NASA ADS] [CrossRef] [EDP Sciences] [Google Scholar]
- Yan, L., Chary, R., Armus, L., et al. 2005, ApJ, 628, 604 [NASA ADS] [CrossRef] [Google Scholar]
Appendix A: Additional table and figure
Table A.1 presents the sample and reports the extinction corrected measurements of the most important lines.
Spectral properties of the sample. ID and coordinates are from Paris et al. (2023). Spectroscopic redshfits are from Vulcani et al. (2023) and from this work. Env is the environment in which galaxies are located (cl = cluster, fi = field). Dust corrected fluxes and equivalent widths are computed as described in the text. AV is measured from the Hα/Paα decrement and using the Cardelli et al. (1989) law. Asterisks indicate that the reported AV is a mean value, due to the lack of one of the two lines.
Figure A.1 shows the color-composite images for the cluster and field targets.
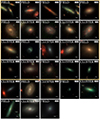 |
Fig. A.1. (F115W+F200W (or F150W if F200W is not reliable)+F444W images of the galaxies analyzed in this paper. The physical scale is reported in the lower right corners. Galaxies are sorted by decreasing red excess (see Sect. 4). The gold rectangle highlights the red outliers. |
All Tables
Spectral properties of the sample. ID and coordinates are from Paris et al. (2023). Spectroscopic redshfits are from Vulcani et al. (2023) and from this work. Env is the environment in which galaxies are located (cl = cluster, fi = field). Dust corrected fluxes and equivalent widths are computed as described in the text. AV is measured from the Hα/Paα decrement and using the Cardelli et al. (1989) law. Asterisks indicate that the reported AV is a mean value, due to the lack of one of the two lines.
All Figures
|
Fig. 1. Observed color-magnitude diagram (F200W-F444W vs. F200W). Stars represent galaxies in the cluster, while circles represent galaxies in the field. Small symbols and gray colors show galaxies from Vulcani et al. (2023) not specifically targeted here. Larger symbols and red/blue colors indicate the galaxies analyzed in the present paper. The green solid line represents the best fit of the relation, obtained with an iterative 3σ clipping procedure. The dashed line shows the 3σ error. Galaxies deviating by more than 3σ from the best fit in the F200W-F444W vs. F200W plane are defined as red outliers. Here and throughout the paper, IDs are from Paris et al. (2023). |
| In the text | |
|
Fig. 2. Rest-frame colors of the galaxies. Stars and circles represent galaxies in the cluster and the field, respectively. Small symbols and gray colors show galaxies from Vulcani et al. (2023) not specifically targeted here. Larger symbols indicate the galaxies analyzed in the present paper and are color coded according to their Δ(F200W-F444W), which is measured as the difference between their measured color and the color they would have if they were on the red sequence given their F200W magnitude. The horizontal black line in the color bar shows the adopted threshold between normal galaxies and red outliers. Left: Rest-frame B-V vs. stellar mass diagram. The green line represents the best fit of the red sequence, along with the 3σ scatter. Right: Rest-frame U-V vs. V-J diagram. The green line represents the separation between star forming and passive galaxies from Labbé et al. (2005). |
| In the text | |
|
Fig. 3. JWST/NIRSpec rest-frame spectra for the cluster galaxies in our sample, sorted by decreasing red excess. Highlighted within the black box are the red outliers. Spectra are normalized so that the flux in the rest frame range 2.9 < λ[μm]< 3.1 is equal to one. |
| In the text | |
|
Fig. 4. JWST/NIRSpec rest-frame spectra for the field galaxies in our sample, sorted by decreasing red excess. Highlighted within the black box are the red outliers. Spectra are normalized so that the flux in the rest frame range 2.9 < λ[μm]< 3.1 is equal to one. |
| In the text | |
|
Fig. 5. JWST/NIRSpec rest-frame spectra for the galaxies in our sample, zoomed-in on the PAH feature. Spectra are normalized so that the shown area is equal to one. |
| In the text | |
|
Fig. 6. Example of our spectral decomposition result using CAFE on source 6436, which has strong PAH emission together with relatively high ice opacity among the sample. Features of interest are labeled, including the 3.3 μm PAH feature, the 3.4 aliphatic feature, the broad plateau feature, and the water ice absorption at 3.05 μm. Yellow and red lines represent stellar and non-stellar continuum sources. Note that the adopted spectral coverage and simplified treatment do not allow us to obtain a physical significance to individual continuum components. |
| In the text | |
|
Fig. 7. F200W-F444W as a function of the rest frame equivalent width of the PAH, for cluster (stars) and field (circle) galaxies. Galaxies are color coded by their Δ(F200W-F444W), which is measured as the difference between their measured color and the color they should have if they were on the red sequence, given their F200W magnitude. The squared symbol indicates 23903, the only galaxy most likely hosting an AGN. |
| In the text | |
|
Fig. 8. Rest-frame EW of the PAH as a function of rest-frame EW of Hα (left) and stellar mass (right), for cluster (red) and field (blue) star forming galaxies. |
| In the text | |
|
Fig. 9. Comparison between Hα properties and other emission lines. Left panel: Observed Paα vs. Hα fluxes for the subset of galaxies with both measurements. The dashed line shows the intrinsic ratio, corresponding to a temperature of T = 104 K and an electron density of ne = 102 cm−3 for Case B recombination (Osterbrock 1989). The dotted line corresponds to the ratio obtained assuming an E(B-V) = 0.41, which is the best fit to our data. Right panel: Comparison between the dust-corrected SFRs obtained from Hα and PAH3.3. In both panels, cluster galaxies are shown in red, and field galaxies are shown in blue. |
| In the text | |
|
Fig. 10. Distribution of the water absorption feature τice for the emission line and weak emission-line galaxies as measured from the CAFE fit. The values of the three weak emission-line galaxies are highlighted. |
| In the text | |
|
Fig. 11. Diagram comparing the ratio of Hα and Paα and APaα, IRX, that is the ratio of SFRs derived from the observed Paα and the PAH (APaα, IRX = 2.5 × log(1 + SFRPAH, tot/SFRPaα, obs)). Purple squares represent weighted average values in bins of Paα/Hα ratios. Expected values obtained considering different attenuation laws are also overplotted, as explained in the key. |
| In the text | |
|
Fig. A.1. (F115W+F200W (or F150W if F200W is not reliable)+F444W images of the galaxies analyzed in this paper. The physical scale is reported in the lower right corners. Galaxies are sorted by decreasing red excess (see Sect. 4). The gold rectangle highlights the red outliers. |
| In the text | |
Current usage metrics show cumulative count of Article Views (full-text article views including HTML views, PDF and ePub downloads, according to the available data) and Abstracts Views on Vision4Press platform.
Data correspond to usage on the plateform after 2015. The current usage metrics is available 48-96 hours after online publication and is updated daily on week days.
Initial download of the metrics may take a while.