| Issue |
A&A
Volume 696, April 2025
|
|
|---|---|---|
| Article Number | A135 | |
| Number of page(s) | 8 | |
| Section | Extragalactic astronomy | |
| DOI | https://doi.org/10.1051/0004-6361/202452455 | |
| Published online | 10 April 2025 | |
On unveiling buried nuclei with JWST: A technique for hunting the most obscured galaxy nuclei from local to high redshift
1
Centro de Astrobiología (CAB), CSIC-INTA, Camino Bajo del Castillo s/n, E-28692 Villanueva de la Cañada, Madrid, Spain
2
Department of Physics, University of Oxford, Keble Road, Oxford, OX1 3RH
UK
3
School of Sciences, European University Cyprus, Diogenes street, Engomi, 1516 Nicosia, Cyprus
4
Instituto de Física Fundamental, CSIC, Calle Serrano 123, E-28006 Madrid, Spain
5
Universidad de Alcalá, Departamento de Física y Matemáticas, Campus Universitario, E-28871 Alcalá de Henares, Madrid, Spain
6
Department of Space, Earth and Environment, Osala Space Observatory, Chalmers University of Technology, SE-439 92 Onsala, Sweden
7
School of Physics, H.H. Wills Physics Laboratory, Tyndall Avenue, University of Bristol, Bristol, BS8 1TL
UK
8
Department of Physics, Oliver Lodge Building, University of Liverpool, Oxford Street, Liverpool, L69 7ZE
UK
9
Chinese Academy of Sciences South America Center for Astronomy, National Astronomical Observatories, CAS, Beijing, 100101
People’s Republic of China
10
Cosmic Dawn Center (DAWN), Copenhagen, Denmark
⋆ Corresponding author; igbernete@gmail.com
Received:
1
October
2024
Accepted:
17
February
2025
We analyze JWST NIRSpec+MIRI/MRS observations of the infrared (IR) polycyclic aromatic hydrocarbon (PAH) features in the central regions (∼0.26″ at 6 μm; ∼50–440 pc depending on the source) of local luminous IR galaxies. In this work, we examine the effect of nuclear obscuration on the PAH features of deeply obscured nuclei, predominantly found in local luminous IR galaxies, and we compare these nuclei with “normal” star-forming regions. We extend previous work to include shorter wavelength PAH ratios now available with the NIRSpec+MIRI/MRS spectral range. We introduce a new diagnostic diagram for selecting deeply obscured nuclei based on the 3.3 and 6.2 μm PAH features and/or mid-IR continuum ratios at ∼3 and 5 μm. We find that the PAH equivalent width ratio of the brightest PAH features at shorter wavelengths (at 3.3 and 6.2 μm) is impacted by nuclear obscuration. Although the sample of luminous IR galaxies used in this analysis is relatively small, we find that sources exhibiting a high silicate absorption feature cluster tightly in a specific region of the diagram, whereas star-forming regions experiencing lower extinction levels occupy a different area in the diagram. This demonstrates the potential of this technique to identify buried nuclei. To leverage the excellent sensitivity of the MIRI imager on board JWST, we extend our method of identifying deeply obscured nuclei at higher redshifts using a selection of MIRI filters. Specifically, the combination of various MIRI JWST filters enables the identification of buried sources beyond the local Universe and up to z ∼ 3, where other commonly used obscuration tracers such as the 9.7 μm silicate band, are out of the spectral range of MRS. Our results pave the way for identifying distant deeply obscured nuclei with JWST.
Key words: techniques: high angular resolution / techniques: photometric / techniques: spectroscopic / galaxies: ISM / galaxies: nuclei / infrared: galaxies
© The Authors 2025
 Open Access article, published by EDP Sciences, under the terms of the Creative Commons Attribution License (https://creativecommons.org/licenses/by/4.0), which permits unrestricted use, distribution, and reproduction in any medium, provided the original work is properly cited.
This article is published in open access under the Subscribe to Open model. Subscribe to A&A to support open access publication.
1. Introduction
Most galaxies contain supermassive black holes (SMBHs) in their central regions (e.g., Hopkins et al. 2005), and thus undergo an active phase in their evolution (depending on the gas supply; e.g., Hickox et al. 2014). There is evidence that a significant fraction of cosmic SMBH growth may be taking place in heavily obscured but intrinsically luminous active galactic nuclei (AGNs; e.g., Ueda et al. 2014; Mateos et al. 2017). In the local Universe, a substantial fraction of ultraluminous infrared galaxies (U/LIRGs) harbour deeply obscured nuclei (AV≫1000; e.g., Falstad et al. 2021; García-Bernete et al. 2022a; Donnan et al. 2023a). In these extremely dusty environments, the high extinction associated with the large column densities of gas and dust generally impedes their detection at many wavelengths (e.g., optical/X-ray). In deeply obscured nuclei, a mixture of a compact starburst (SB) and AGN activity might power the infrared (IR) emission but the dominant power source is still under debate (e.g., Falstad et al. 2021; Pereira-Santaella et al. 2021; García-Bernete et al. 2024a). Moreover, these buried nuclei are considered to be an important phase of galaxy evolution (e.g., Aalto et al. 2015).
The dust surrounding the central engine absorbs a significant part of the AGN and/or SB radiation, and then reprocesses it to emerge in the IR (e.g., Pier & Krolik 1992). Dust silicate grains, which are an important component of interstellar dust (Mathis et al. 1977), produce features in the IR at ∼9.7 and 18 μm (e.g., Ossenkopf et al. 1992). Buried sources show strong absorption features produced by icy material (e.g., H2O, CO, CO2; at ∼3 and 6 μm; see Boogert et al. 2015 for a review). In particular, the dirty H2O ice absorption features (i.e., a mix of water and other molecules such as CO and CO2) are detected in the IR spectra of obscured intermediate-luminosity AGNs (García-Bernete et al. 2024b), buried nuclei in U/LIRGs (e.g., Spoon et al. 2007, 2022; Alonso Herrero et al. 2024; Perna et al. 2024; Hermosa Muñoz et al. 2025), and embedded massive protostars (e.g., Boogert et al. 2015).
Recent works using the unprecedented combination of high angular and spectral resolution (R ∼ 1500–3500) in the 1.0–28.1 μm range provided by the JWST Near-Infrared Spectrograph (NIRSpec; Jakobsen et al. 2022; Böker et al. 2022) and the JWST Mid-Infrared Instrument (MIRI; Rieke et al. 2015; Wells et al. 2015; Wright et al. 2015) are transforming our understanding of deeply obscured nuclei. These capabilities have been key to investigating polycyclic aromatic hydrocarbons (PAHs) and the inner dusty structures of these regions (e.g., Alonso Herrero et al. 2024; García-Bernete et al. 2024c; Buiten et al. 2024; Donnan et al. 2024a; González-Alfonso et al. 2024; Pereira-Santaella et al. 2024; Rigopoulou et al. 2024; Hermosa Muñoz et al. 2025, for some of the latest publications).
Polycyclic aromatic hydrocarbons are ubiquitous in local sources (e.g., Tielens 2008 for a review), but also in high-redshift galaxies (e.g., Spilker et al. 2023). These molecules are at the smaller size end of the interstellar (ISM) dust distribution. Emission features of PAHs (e.g., Tielens 2008) are very prominent in the mid-IR spectra of U/LIRGs (e.g., Lutz et al. 1998; Rigopoulou et al. 1999), and have also been detected in the IR spectra of deeply obscured sources using the relatively large aperture offered by AKARI and Spitzer (e.g., Spoon et al. 2007, 2022; Imanishi et al. 2007; Falstad et al. 2021; García-Bernete et al. 2022a; Donnan et al. 2023b) and high angular JWST observations (e.g., Donnan et al. 2023a, 2024a; Rich et al. 2023; García-Bernete et al. 2024a,b; Bohn et al. 2024; González-Alfonso et al. 2024; Pereira-Santaella et al. 2024; Hermosa Muñoz et al. 2025). Polycyclic aromatic hydrocarbons absorb a significant fraction of UV and optical photons (e.g., Peeters et al. 2004), and are therefore good tracers of the star formation activity in galaxies near and far (e.g., Rigopoulou et al. 1999; Peeters et al. 2004; Shipley et al. 2016).
In García-Bernete et al. (2022a), a technique was introduced to identify deeply obscured nuclei based on the impact of the silicate feature on the equivalent width (EW) of the 11.3 μm PAH feature. Using Spitzer/IRS data, we demonstrated that the presence of a deeply embedded nucleus can be inferred using PAH EW(6.2 μm)/EW(11.3 μm) and PAH EW(12.7 μm)/EW(11.3 μm) ratios. Here, we extend the technique using shorter wavelength PAH features (3.3 and 6.2 μm) and the 3-to-5 μm continuum emission. We also explore the use of broadband JWST filters to unveil embedded nuclei. The advantage of this new diagnostic is that it enables us to search for deeply obscured sources at higher redshifts up to z ∼ 3.
Hereafter, we refer to deeply obscured nuclei as those sources that have log NH (cm−2) > 24.0 and that lack emission lines with ionization potential (> 40 eV) in their nuclear IR spectrum (e.g., II Zw 096-D1; see García-Bernete et al. 2024a). It is also worth pointing out that the 2–6 μm mid-infrared (MIR) continuum of these deeply obscured nuclei rises more steeply compared to typical star-forming galaxies. Such a steep rise in the (MIR) continuum has also been noted in the spectral energy distributions (SEDs) of the galaxies termed little red dots (LRDs; Pérez-González et al. 2024). Little red dots have been uncovered by recent JWST surveys as a significant population of compact, possibly deeply obscured galaxies at redshifts of 4 < z < 9 whose nature is yet unclear (e.g., Williams et al. 2024; Stepney et al. 2024).
2. Targets and observations
This study aims to extend the PAH EW diagnostic diagram for identifying deeply obscured nuclei presented in García-Bernete et al. 2022a to shorter-wavelength PAH features, which enables the search for these sources at higher redshift with JWST.
We use NIRSpec IFU and MIRI MRS data of local luminous IR galaxies from the Director’s Discretionary Early Release Science Program #1328 (PI: L. Armus & A. Evans), the Guaranteed Time Observations Program #1267 (PI: D. Dicken; Program lead: T. Böker), and the GO Cycle 2 Large Program #3368 (PI: L. Armus & A. Evans). We refer to Pereira-Santaella et al. (2024) for further details on the sample (see also Table 1).
Properties of the targets.
3. JWST data reduction
We retrieved near-IR to mid-IR (2.87–5.27 μm) data observed using integral-field spectrographs MIRI MRS with a spectral resolution of R ∼ 3700–1300 (Labiano et al. 2021) and NIRSpec with the grating-filter pairs G140H (0.97–1.89 μm), G235H (1.66–3.17 μm), and G395H (2.87–5.27 μm) with R ∼ 2700 (Jakobsen et al. 2022; Böker et al. 2022). The NIRSpec and MRS data of these sources have already been presented in previous works (e.g., García-Bernete et al. 2024a; Bianchin et al. 2024; Bohn et al. 2024; Buiten et al. 2024; Donnan et al. 2024a,b; Pereira-Santaella et al. 2024; Rigopoulou et al. 2024, and references therein for some recent works).
For data reduction, we used the JWST calibration pipeline (version 1.12.4; Bushouse et al. 2023) and the Calibration Reference Data System (CRDS) context 1253. We primarily followed the standard MRS pipeline procedure (e.g., Labiano et al. 2016, and references therein) and the same configuration of the pipeline stages described in García-Bernete et al. (2022b) and Pereira-Santaella et al. (2022) to reduce the data. Some hot and cold pixels are not identified by the current pipeline, so we added some extra steps, as is described in Pereira-Santaella et al. (2024) and García-Bernete et al. (2024b) for NIRSpec and MRS, respectively.
We extracted the central spectra by applying a 2D Gaussian model, as is described in García-Bernete et al. (2024a,b). To do so, we employed observations of calibration point sources (MRS HD-163466 and IRAS 05248−7007, Programme IDs 1050 and 1049) to measure the width and position angle of a 2D Gaussian for each spectral channel. To obtain the point source flux, we used the models of the calibration PSF stars from Bohlin et al. (2020), which is equivalent to applying aperture correction factors. We refer the reader to García-Bernete et al. (2024a,b,c) for further details. We extracted the circumnuclear spectrum of NGC 3256-N by using an annulus with an inner radius of 0.7″ and an outer radius of 1.0″. For the star-forming regions of NGC 7469, we used the apertures from Donnan et al. (2024a), excluding those located along the AGN-outflow direction (e.g., Rigopoulou et al. 2024), as they are affected by it.
4. The 2-to-8 μm emission of deeply obscured galaxy nuclei
The emerging IR spectrum of galaxies containing a buried nuclei is the superposition of two main components (see e.g., Fig. 1 of García-Bernete et al. 2022a): the star-forming circumnuclear regions, which are the primary sources of PAH emission; and b) the obscured nucleus, which is dominated by nuclear dust emission and deep absorption features (e.g., Marshall et al. 2018; García-Bernete et al. 2022a). Due to the extinction law (e.g., Ossenkopf et al. 1992), the continuum slope becomes increasingly pronounced at shorter wavelengths when extinction is high, as in deeply obscured nuclei (see Fig. 1). Dusty molecular features such as silicates (at 9.7 and 18 μm) and dirty H2O ice (at 3 and 6 μm) are also generally present in buried nuclei (e.g., Spoon et al. 2007, 2022; Imanishi et al. 2007; García-Bernete et al. 2022a, 2024b). Therefore, the specific shape of the nuclear continuum of the deeply obscured nuclei has a different impact on the EW of the various PAH features distributed across the IR waveband (main features at 3.3, 6.2, 7.7, 8.6, 11.3, 12.7, and 17 μm; see e.g., Armus et al. 2007; Desai et al. 2007; Spoon et al. 2007; Imanishi et al. 2007; Marshall et al. 2018; Hernán-Caballero et al. 2020; García-Bernete et al. 2022a).
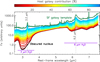 |
Fig. 1. Expected 2-to-8 μm spectra of galaxies containing a deeply obscured nucleus with a varying specific fraction relative to the host star-forming galaxy. These spectra were generated using different fractions of the host galaxy (represented by the host star-forming galaxy using the JWST spectrum of NGC 3256-N; solid green line) superimposed on the continuum of the buried nucleus NGC 3256-S (solid black line). Solid dark red to blue lines correspond to increasing fractions of the host galaxy contribution with respect to the nuclear source. The vertical dashed gray lines denote the location of the brightest PAH features (3.3 and 6.2 μm) within the 2-to-8 μm spectral region. |
Previous works found that the foreground extinction may dominante the measured silicate strength of edge-on galaxies (e.g., Goulding et al. 2012; González-Martín et al. 2013). Thus, the silicate strength alone is not necessarily a good indicator of nuclear obscuration (e.g., Alonso-Herrero et al. 2011; González-Martín et al. 2013; García-Bernete et al. 2019, 2022c, 2024b). However, for buried sources, García-Bernete et al. (2022a) demonstrate that the nuclear 9.7 μm silicate absorption band has a particularly pronounced effect on the 11.3 μm PAH feature. The low flux level in the nuclear silicate absorption feature enhances the 11.3 μm PAH band contrast (high 11.3 μm PAH EW) compared to that of the other PAH features. Indeed, a step forward in the identification of buried nuclei was attained with the PAH EW method, but this study was limited by the limited sensitivity of Spitzer/IRS. While this method, together with the unprecedented sensitivity afforded by JWST, enable the identification of buried nuclei in fainter galaxies, still, the highest redshift for which this method could be applied is z ∼ 1 due to the spectral coverage (5–28 μm) of JWST/MRS. Thus, it is imperative to explore alternatives for expending the mid-IR based method to higher redshifts where luminous IR galaxies are expected to be more numerous.
For this purpose, we investigate the diagnostic power of additional spectral features at shorter wavelengths using JWST/NIRSpec+MRS data. In Fig. 1, we generate the expected ∼2-to-8 μm spectra of galaxies containing deeply obscured nuclei by using a combination of two spectra: the continuum (emission line free) spectrum of a buried nucleus whose mid-IR continuum (from NGC 3256-S) is dominated by deep ∼3 and 6 μm H2O ice absorption features (solid black line), and a star-forming galaxy (from NGC 3256-N) that represents the circumnuclear star-forming regions, which are PAH-dominated (green solid line). The expected range of spectra was generated by varying the contribution of the host galaxy spectrum (from dark red to blue, corresponding to increasing values of the host galaxy contribution) with respect to the nuclear source1. This plot illustrates the variations in the ∼3-to-5 μm SED slope and the effect of the deep 3 μm H2O ice absorption feature on the 3.3 μm PAH feature. We refer the reader to Rigopoulou et al. (2024), in which the authors discuss the impact of the 3 μm H2O ice absorption feature on the 3.3 μm PAH emission. Given the shape of the continuum of a buried nucleus, when one is present in a galaxy, the 3.3 μm PAH will experience lower levels of dilution (i.e., the EW of the 3.3 μm PAH is high) compared to other PAH features such as the 6.2 μm one. This makes this region of the spectrum an ideal wavelength range for studying deeply obscured nuclei.
5. On the identification of deeply obscured nuclei
In this section, we investigate the relation between PAH emission and nuclear dust obscuration in our targets by plotting the 3.3/6.2 μm PAH EW ratio versus the underlying continuum ratio (Fig. 2). In Table 1, we present the PAH EW and continuum ratios of the sample; these values were estimated using local continuum, and we used the ∼3.2–3.35 μm and 6.0–6.5 μm ranges to measure the strengths and EWs of the 3.32 and 6.2 μm PAH features, respectively (see García-Bernete et al. 2022b for further details). We followed a similar methodology to the one presented in Hernán-Caballero & Hatziminaoglou (2011).
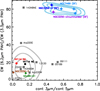 |
Fig. 2. Diagnostic diagrams for identifying deeply obscured nuclei: 6.2/3.3 μm PAH EW ratio vs. the continuum 3-to-5 μm flux ratio. Filled circles correspond to buried nuclei in local LIRGs, and filled gray squares correspond to local ULIRGs. Dark blue and purple stars represent the central and circumnuclear regions of the star-forming galaxy NGC 3256, respectively, while the light blue stars indicate star-forming regions in NGC 7469. Labeled sources correspond to the various nuclei used in this work. Solid gray and light blue lines denote the 1σ, 2σ, and 3σ contours for deeply obscured nuclei and star-forming regions, respectively. |
We find that deeply obscured nuclei (filled circles) show smaller 6.2/3.3 μm PAH EW ratios than those observed in star-forming regions (filled stars). In buried nuclei, the bulk of the PAH emission, which is located in the circumnuclear star-forming regions, and the majority of the continuum, which is coming from the nuclei, are likely to experience significantly different degrees of extinction. The EW indicates the strength of a feature compared to its underlying continuum. Thus, when a buried nucleus is present, the PAH EW ratios reflect differences in the continuum that is coming from the nuclear source (see e.g., García-Bernete et al. 2022a). As the extinction curve rises sharply from ∼5 μm to shorter IR wavelengths, a significantly higher extinction value is anticipated at 3 μm (e.g., Ossenkopf et al. 1992; Chiar & Tielens 2006; Donnan et al. 2024a). Thus, in dusty embedded nuclei, there is a very steep ∼3-to-5 μm continuum slope, together with deep H2O absorption features. Incidentally, the ∼3 and 6 μm dirty H2O ice absorption bands are within the wavelength range of the 3.3 and 6.2 μm PAH features. However, the nuclear 3 μm H2O ice feature band is expected to be much deeper than the 6 μm H2O (as was expected from lab works; see Rocha et al. 2022 and Figs. C.1. and C.2 in García-Bernete et al. 2024b), and thus the 6.2/3.3 μm PAH EW ratio should be smaller in buried nuclei. We also find that the 6.2/3.3 μm PAH EW values of star-forming regions are more concentrated around ∼75–85, suggesting that star-forming galaxies share similar intrinsic PAH flux ratios (see also Hernán-Caballero et al. 2020).
As is demonstrated in García-Bernete et al. 2022a, the PAH EW ratios filter out sources with deep absorption features due to foreground components, as these foreground absorbers equally impact both the continuum and PAH emission of the host galaxy. On the other hand, the continuum ratios are affected by the extinction coming from both the circumnuclear region and the nuclear region. This limitation might be present in Arp 220-E and IRAS 14348-1447-NE, which exhibit high PAH EW(6.2 μm)/EW(3.3 μm) ratios (similar to those of star-forming regions; see Fig. 2) but low 3 μm/5 μm continuum ratios. This suggests that foreground extinction could be playing a significant role in these sources, affecting the continuum ratio (see Appendix A for further details). However, when PAH spectroscopy is not available, the ratio of the 3-to-5 μm continuum can also be used to identify deeply obscured nuclei. Because of the large dust column density, buried nuclei show a pronounced bump due to the mid-IR emission being higher relative to the low near-IR continuum. Thus, we explore the ratio between the continuum at 3 and 5 μm, which appears markedly different in deeply obscured nuclei (see Fig. 3). Fig. 3 shows a nearly 2 dex variation in the 3-to-5 μm continuum ratio ranging from sources dominated by deeply obscured nuclei to star-forming regions.
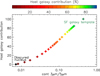 |
Fig. 3. Continuum 3-to-5 μm flux ratio (X axis on a log scale) as a function of the host galaxy contribution (Y axis on a linear scale). Color-coded stars correspond to the host galaxy contribution of the simulated spectra shown in Fig. 1. |
We find that ratios of PAH EW(6.2 μm)/EW(3.3 μm) ≲ 40 and 3 μm/5 μm continuum ratio ≲0.35 correspond with deeply obscured nuclei in a small sample of luminous IR galaxies (Fig. 2; see Appendix A for a comparison with the PAH EW(12.7 μm)/EW(11.3 μm) ratio method). It is worth noting that Fig. 2 also shows that the continuum ratio alone could potentially be used to identify deeply obscured nuclei. We note that upcoming new JWST observations of star-forming and luminous IR galaxies will be crucial for extending the sample of sources, helping to establish a firm limiting criteria on the observed ratios, and for precisely determining the position of star-forming regions within the diagram.
6. Application to higher-redshift sources with JWST
JWST/MIRI can observe the ∼3-to-5 μm continuum range up to a redshift of ∼3 depending on the brightness of the source. Although the continuum emission at ∼3-to-5 μm from buried nuclei may also include contributions from the host galaxy, which can even dominate in edge-on galaxies, it is of interest to explore methods to identify buried nuclei using the continuum. In particular, broadband JWST filters can be used to identify deeply obscured nuclei candidates in distant and faint sources where spectroscopic observations might not currently be possible due to sensitivity limitations. To do so, we used the synthetic spectra3 presented in Fig. 1 and combinations of the various JWST/MIRI filter transmission curves. We identified pairs of filters that allow us to use the continuum ratio described in Section 5.
In Fig. 4, we present a JWST color-color diagram based on ratios of the F1280W, F1800W, and F2100W filters at z = 3 (at rest-frame ∼3, 4.5 and 5 μm, respectively). As even in heavily obscured sources a non-negligible contribution of the host galaxy is expected, we plot the expected values of the predicted spectra from Fig. 1. This plot shows that using the following criteria, F1280W/F2100W < 0.17 and F1280W/F2100W < 0.27, we can isolate galaxies containing a buried nucleus with a contribution of more than ∼40% to the observed spectrum based on Fig. 3. We also examined the combination of additional JWST filters that will enable us to select deeply obscured nuclei at various redshifts (see Appendix B).
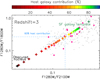 |
Fig. 4. Color-color diagram (using the continuum) for selecting deeply obscured nuclei at z = 3 using JWST/MIRI filters. Color-coded stars correspond to the host galaxy contribution of the simulated spectra shown in Fig. 1. The dashed blue lines denote the region where sources have a contribution of the buried nuclei greater than 40%. Gray circles correspond to CEERS sources with redshift measurements. Magenta squares represent those sources at redshift ∼2.75–3.25. |
As a “proof of concept” for our technique, we utilized observations from the Cosmic Evolution Early Release Science Survey (CEERS4), which is part of the Director’s Discretionary Early Release Science Program 1345 (PI: Steven L. Finkelstein). The CEERS survey, which targets the Extended Groth Strip (EGS) field, includes eight MIRI pointings with a field of view of ∼2 arcmin2. Two of the MIRI pointings have been observed with six MIRI filters (F770W, F1000W, F1280W, F1500W, F1800W, and F2100W). Incidentally, neither of those two MIRI pointings has NIRCAM observations (neither MIRI F560W). Although the surveyed area is relatively small (∼4 arcmin2), the deep imaging available makes this an ideal target area for identifying deeply obscured nuclei candidates. To do so, we used TOPCAT (Taylor 2005) to cross-match the CEERS sources from their public catalog (Yang et al. 2023) with a redshift catalog including both spectroscopic and photometric measurements from Kodra et al. (2023). The results are plotted in Fig. 4 (see also Appendix B). We identify a total of ten deeply obscured nuclei candidates within the redshift range of ∼1.5–3 in ∼4 arcmin2 (see Figs. 4 and B.1 for different plots at z ∼ 1.5, 2, and 3). Uncertainties in photometric redshifts is an issue in this selection, and further refinement including additional photometric data (e.g., those from future NIRcam observations) will allow for more accurate redshift determination. As was discussed above, strong foreground extinction may also mimic these continuum ratios, so spectroscopic follow-up of these candidates will be necessary to firmly confirm the deeply obscured nature of their nuclei.
We note that other mid-IR selected buried sources such as hot dust-obscured galaxies (hot DOGs) are found in an even lower number density (one for every ∼30 deg2; Assef et al. 2015) compared with the deeply obscured nuclei selected in this work (∼2–3 candidates per arcmin2). It is however, unclear what the link (evolutionary or otherwise) is between the deeply obscured sources identified through our technique and other deeply obscured populations such as hot DOGs and LRDs. Such an investigation will be presented in a forthcoming paper (Rigopoulou et al. in prep.).
In the near future, as additional JWST deep imaging observations become available, there will be a large amount of archival MIRI imaging data for studies such as the one presented here. This will allow us to uncover more deeply obscured nuclei at high redshifts.
7. Summary and conclusions
We present a JWST NIRSpec+MIRI/MRS study on the relation between the PAH emission and nuclear dust obscuration in local luminous IR galaxies. We extend the work presented in García-Bernete et al. (2022a) to include shorter-wavelength PAH ratios now available with the NIRSpec+MIRI/MRS spectral range. Our main results are as follows:
-
We find that the PAH EW ratio of the brightest PAH features at shorter wavelengths (i.e., 3.3 and 6.2 μm) is related to nuclear obscuration. For deeply obscured nuclei, we observe that the slope of the intrinsic continuum and the 3 μm water ice absorption band, which traces obscuration, have a significant impact on the EW of the 3.3 μm PAH feature. We find that the 3.3 μm PAH feature contrast (high EW) relative to other PAH features (e.g., 6.2 μm) traces the nuclear obscuration.
-
We have introduced a diagnostic diagram for selecting deeply obscured nuclei based on the 3.3 and 6.2 μm PAH features and mid-IR 3-to-5 μm continuum ratios. We find that highly obscured sources cluster tightly in a specific region of the diagram, whereas star-forming regions experiencing lower extinction levels occupy a different area.
-
We find that the use of mid-IR color–color diagrams might be an effective tool to select sources dominated by deeply obscured nuclei at higher redshifts. In particular, the combination of various MIRI JWST filters will enable the identification of buried sources up to z ∼ 3.
-
Using the Cosmic Evolution Early Release Science Survey (CEERS), we have successfully identified deeply obscured nuclei candidates within the redshift range of ∼1.5–3.
In summary, this work employs JWST/NIRSpec+MRS spectroscopy to demonstrate the potential of PAH features at 3.3 and 6.2 μm for identifying buried sources, especially at high redshift (z ∼ 3), where other commonly used tracers of obscuration in the local Universe (e.g., the 9.7 μm silicate absorption band) might not be available due to the IR spectral range covered by current facilities. New observations of luminous IR galaxies with JWST will be crucial for enhancing the statistical significance of the results presented here, helping to establish firm criteria in the diagram.
We note that we assume that the dust emission of these sources remains broadly similar at redshift 3. This assumption is consistent with recent JWST findings, which indicate that the nuclear dusty material of QSOs at ∼760 million years after the Big Bang is similar to that observed in local AGN (e.g., Bosman et al. 2024).
Acknowledgments
The authors acknowledge the GOALS DD-ERS team for developing their observing program. IGB is supported by the Programa Atracción de Talento Investigador “César Nombela” via grant 2023-T1/TEC-29030 funded by the Community of Madrid. MPS acknowledges support under grants RYC2021-033094-I and CNS2023-145506 funded by MCIN/AEI/10.13039/501100011033 and the European Union NextGenerationEU/PRTR. S. K. gratefully acknowledges funding from the European Research Council (ERC) under the European Union’s Horizon 2020 research and innovation programme (grant agreement No. 789410). This work is based on observations made with the NASA/ESA/CSA James Webb Space Telescope. The data were obtained from the Mikulski Archive for Space Telescopes at the Space Telescope Science Institute, which is operated by the Association of Universities for Research in Astronomy, Inc., under NASA contract NAS 5-03127 for JWST; and from the European JWST archive (eJWST) operated by the ESAC Science Data Centre (ESDC) of the European Space Agency. These observations are associated with the programs #1049, #1050, #1267, #1328 and #3368. The authors are extremely grateful the JWST helpdesk for their support. Finally, we thank the anonymous referee for their useful comments.
References
- Aalto, S., Martín, S., Costagliola, F., et al. 2015, A&A, 584, A42 [NASA ADS] [CrossRef] [EDP Sciences] [Google Scholar]
- Alonso Herrero, A., Hermosa Muñoz, L., Labiano, A., et al. 2024, A&A, 690, A95 [NASA ADS] [CrossRef] [EDP Sciences] [Google Scholar]
- Alonso-Herrero, A., Ramos Almeida, C., Mason, R., et al. 2011, ApJ, 736, 82 [NASA ADS] [CrossRef] [Google Scholar]
- Armus, L., Charmandaris, V., Bernard-Salas, J., et al. 2007, ApJ, 656, 148 [NASA ADS] [CrossRef] [Google Scholar]
- Assef, R. J., Eisenhardt, P. R. M., Stern, D., et al. 2015, ApJ, 804, 27 [Google Scholar]
- Bianchin, M., Vivian, U., Song, Y., et al. 2024, ApJ, 965, 103 [NASA ADS] [CrossRef] [Google Scholar]
- Bohlin, R. C., Hubeny, I., & Rauch, T. 2020, AJ, 160, 21 [Google Scholar]
- Bohn, T., Inami, H., Togi, A., et al. 2024, ApJ, 977, 36 [NASA ADS] [CrossRef] [Google Scholar]
- Böker, T., Arribas, S., Lützgendorf, N., et al. 2022, A&A, 661, A82 [NASA ADS] [CrossRef] [EDP Sciences] [Google Scholar]
- Boogert, A. C. A., Gerakines, P. A., & Whittet, D. C. B. 2015, ARA&A, 53, 541 [Google Scholar]
- Bosman, S. E. I., Álvarez-Márquez, J., Colina, L., et al. 2024, Nat. Astron., 8, 1054 [NASA ADS] [CrossRef] [Google Scholar]
- Buiten, V. A., van der Werf, P. P., Viti, S., et al. 2024, ApJ, 966, 166 [NASA ADS] [CrossRef] [Google Scholar]
- Bushouse, H., Eisenhamer, J., Dencheva, N., et al. 2023, https://doi.org/10.5281/zenodo.7577320 [Google Scholar]
- Chiar, J. E., & Tielens, A. G. G. M. 2006, ApJ, 637, 774 [NASA ADS] [CrossRef] [Google Scholar]
- Desai, V., Armus, L., Spoon, H. W. W., et al. 2007, ApJ, 669, 810 [NASA ADS] [CrossRef] [Google Scholar]
- Donnan, F. R., García-Bernete, I., Rigopoulou, D., et al. 2023a, MNRAS, 519, 3691 [CrossRef] [Google Scholar]
- Donnan, F. R., Rigopoulou, D., García-Bernete, I., et al. 2023b, A&A, 669, A87 [NASA ADS] [CrossRef] [EDP Sciences] [Google Scholar]
- Donnan, F. R., García-Bernete, I., Rigopoulou, D., et al. 2024a, MNRAS, 529, 1386 [NASA ADS] [CrossRef] [Google Scholar]
- Donnan, F. R., Rigopoulou, D., & García-Bernete, I. 2024b, MNRAS, 532, L75 [NASA ADS] [CrossRef] [Google Scholar]
- Efstathiou, A., & Rowan-Robinson, M. 1995, MNRAS, 273, 649 [Google Scholar]
- Falstad, N., Aalto, S., König, S., et al. 2021, A&A, 649, A105 [NASA ADS] [CrossRef] [EDP Sciences] [Google Scholar]
- García-Bernete, I., Ramos Almeida, C., Alonso-Herrero, A., et al. 2019, MNRAS, 486, 4917 [Google Scholar]
- García-Bernete, I., Rigopoulou, D., Aalto, S., et al. 2022a, A&A, 663, A46 [NASA ADS] [CrossRef] [EDP Sciences] [Google Scholar]
- García-Bernete, I., Rigopoulou, D., Alonso-Herrero, A., et al. 2022b, A&A, 666, L5 [NASA ADS] [CrossRef] [EDP Sciences] [Google Scholar]
- García-Bernete, I., González-Martín, O., Ramos Almeida, C., et al. 2022c, A&A, 667, A140 [NASA ADS] [CrossRef] [EDP Sciences] [Google Scholar]
- García-Bernete, I., Pereira-Santaella, M., González-Alfonso, E., et al. 2024a, A&A, 682, L5 [NASA ADS] [CrossRef] [EDP Sciences] [Google Scholar]
- García-Bernete, I., Alonso-Herrero, A., Rigopoulou, D., et al. 2024b, A&A, 681, L7 [NASA ADS] [CrossRef] [EDP Sciences] [Google Scholar]
- García-Bernete, I., Rigopoulou, D., Donnan, F. R., et al. 2024c, A&A, 691, A162 [NASA ADS] [CrossRef] [EDP Sciences] [Google Scholar]
- González-Alfonso, E., García-Bernete, I., Pereira-Santaella, M., et al. 2024, A&A, 682, A182 [NASA ADS] [CrossRef] [EDP Sciences] [Google Scholar]
- González-Martín, O., Rodríguez-Espinosa, J. M., Díaz-Santos, T., et al. 2013, A&A, 553, A35 [NASA ADS] [CrossRef] [EDP Sciences] [Google Scholar]
- Goulding, A. D., Alexander, D. M., Bauer, F. E., et al. 2012, ApJ, 755, 5 [Google Scholar]
- Hermosa Muñoz, L., Alonso-Herrero, A., Labiano, A., et al. 2025, A&A, 693, A321 [NASA ADS] [CrossRef] [EDP Sciences] [Google Scholar]
- Hernán-Caballero, A., & Hatziminaoglou, E. 2011, MNRAS, 414, 500 [CrossRef] [Google Scholar]
- Hernán-Caballero, A., Spoon, H. W. W., Alonso-Herrero, A., et al. 2020, MNRAS, 497, 4614 [CrossRef] [Google Scholar]
- Hickox, R. C., Mullaney, J. R., Alexander, D. M., et al. 2014, ApJ, 782, 9 [NASA ADS] [CrossRef] [Google Scholar]
- Hopkins, P. F., Hernquist, L., Cox, T. J., et al. 2005, ApJ, 630, 705 [NASA ADS] [CrossRef] [Google Scholar]
- Imanishi, M., Dudley, C. C., Maiolino, R., et al. 2007, ApJS, 171, 72 [Google Scholar]
- Jakobsen, P., Ferruit, P., Alves de Oliveira, C., et al. 2022, A&A, 661, A80 [NASA ADS] [CrossRef] [EDP Sciences] [Google Scholar]
- Kodra, D., Andrews, B. H., Newman, J. A., et al. 2023, ApJ, 942, 36 [NASA ADS] [CrossRef] [Google Scholar]
- Labiano, A., Azzollini, R., Bailey, J., et al. 2016, SPIE Conf. Ser., 9910, 99102W [NASA ADS] [Google Scholar]
- Labiano, A., Argyriou, I., Álvarez-Márquez, J., et al. 2021, A&A, 656, A57 [NASA ADS] [CrossRef] [EDP Sciences] [Google Scholar]
- Lutz, D., Spoon, H. W. W., Rigopoulou, D., Moorwood, A. F. M., & Genzel, R. 1998, ApJ, 505, L103 [NASA ADS] [CrossRef] [Google Scholar]
- Marshall, J. A., Elitzur, M., Armus, L., Diaz-Santos, T., & Charmandaris, V. 2018, ApJ, 858, 59 [Google Scholar]
- Mateos, S., Carrera, F., Barcons, X., et al. 2017, The X-ray Universe 2017, 142 [Google Scholar]
- Mathis, J. S., Rumpl, W., & Nordsieck, K. H. 1977, ApJ, 217, 425 [Google Scholar]
- Ossenkopf, V., Henning, T., & Mathis, J. S. 1992, A&A, 261, 567 [NASA ADS] [Google Scholar]
- Peeters, E., Spoon, H. W. W., & Tielens, A. G. G. M. 2004, ApJ, 613, 986 [NASA ADS] [CrossRef] [Google Scholar]
- Pereira-Santaella, M., Colina, L., García-Burillo, S., et al. 2021, A&A, 651, A42 [NASA ADS] [CrossRef] [EDP Sciences] [Google Scholar]
- Pereira-Santaella, M., Álvarez-Márquez, J., García-Bernete, I., et al. 2022, A&A, 665, L11 [NASA ADS] [CrossRef] [EDP Sciences] [Google Scholar]
- Pereira-Santaella, M., González-Alfonso, E., García-Bernete, I., García-Burillo, S., & Rigopoulou, D. 2024, A&A, 681, A117 [NASA ADS] [CrossRef] [EDP Sciences] [Google Scholar]
- Pérez-González, P. G., Barro, G., Rieke, G. H., et al. 2024, ApJ, 968, 4 [CrossRef] [Google Scholar]
- Perna, M., Arribas, S., Lamperti, I., et al. 2024, A&A, 690, A171 [NASA ADS] [CrossRef] [EDP Sciences] [Google Scholar]
- Pier, E. A., & Krolik, J. H. 1992, ApJ, 401, 99 [Google Scholar]
- Rich, J., Aalto, S., Evans, A. S., et al. 2023, ApJ, 944, L50 [CrossRef] [Google Scholar]
- Rieke, G. H., Wright, G. S., Böker, T., et al. 2015, PASP, 127, 584 [NASA ADS] [CrossRef] [Google Scholar]
- Rigopoulou, D., Spoon, H. W. W., Genzel, R., et al. 1999, AJ, 118, 2625 [Google Scholar]
- Rigopoulou, D., Donnan, F. R., García-Bernete, I., et al. 2024, MNRAS, 532, 1598 [NASA ADS] [CrossRef] [Google Scholar]
- Rocha, W. R. M., Rachid, M. G., Olsthoorn, B., et al. 2022, A&A, 668, A63 [NASA ADS] [CrossRef] [EDP Sciences] [Google Scholar]
- Shipley, H. V., Papovich, C., Rieke, G. H., Brown, M. J. I., & Moustakas, J. 2016, ApJ, 818, 60 [NASA ADS] [CrossRef] [Google Scholar]
- Spilker, J. S., Phadke, K. A., Aravena, M., et al. 2023, Nature, 618, 708 [NASA ADS] [CrossRef] [Google Scholar]
- Spoon, H. W. W., Marshall, J. A., Houck, J. R., et al. 2007, ApJ, 654, L49 [Google Scholar]
- Spoon, H. W. W., Hernán-Caballero, A., Rupke, D., et al. 2022, ApJS, 259, 37 [NASA ADS] [CrossRef] [Google Scholar]
- Stepney, M., Banerji, M., Tang, S., et al. 2024, MNRAS, 533, 2948 [CrossRef] [Google Scholar]
- Taylor, M. B. 2005, ASPC, 347, 29 [Google Scholar]
- Tielens, A. G. G. M. 2008, ARA&A, 46, 289 [NASA ADS] [CrossRef] [Google Scholar]
- Ueda, Y., Akiyama, M., Hasinger, G., Miyaji, T., & Watson, M. G. 2014, ApJ, 786, 104 [Google Scholar]
- Wells, M., Pel, J.-W., Glasse, A., et al. 2015, PASP, 127, 646 [NASA ADS] [CrossRef] [Google Scholar]
- Williams, C. C., Alberts, S., Ji, Z., et al. 2024, ApJ, 968, 34 [NASA ADS] [CrossRef] [Google Scholar]
- Wright, G. S., Wright, D., Goodson, G. B., et al. 2015, PASP, 127, 595 [NASA ADS] [CrossRef] [Google Scholar]
- Yang, G., Papovich, C., Bagley, M. B., et al. 2023, ApJ, 956, L12 [NASA ADS] [CrossRef] [Google Scholar]
Appendix A: Comparison with the PAH EW(12.7 μm)/EW(11.3 μm) ratio
In this Section, we compare the results from the PAH EW(6.2 μm)/EW(3.3 μm) ratio method presented in this work with the PAH EW(12.7 μm)/EW(11.3 μm) ratio used in García-Bernete et al. (2022a). In general, we find a good a agreement between both methods the only exceptions are Arp 220-E and IRAS 14348-1447-NE. However, these two sources exhibit relatively low HCN-vib emission compared to the other nuclei in their systems (Falstad et al. 2021), suggesting that their nature is less obscured compared to compact obscured nuclei.
 |
Fig. A.1. EW(6.2 μm)/EW(3.3 μm) vs EW(12.7 μm)/EW(11.3 μm) for the sample. |
Appendix B: JWST color-color diagrams for selecting deeply obscured nuclei at various redshifts
Here we investigate combination of different filters to those presented in Fig. 4 in Section 6 which will enable us to select deeply obscured nuclei at various redshifts below z = 3. In Fig. B.1 we present various combination of filters to identify deeply obscured nuclei at redshift 1.5 and 2.
Furthermore, at z∼0.9 the ratios between the F560W and F1000W, F1130W and/or F1280W are effective selecting deeply obscured nuclei. Locally at z∼0 buried nuclei could be selected using JWST/NIRCam filters (e.g., the ratio between F335M (or F356W) over F444W (or 480M)).
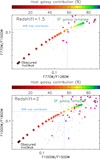 |
Fig. B.1. From top to bottom pannels: Color-color diagram (using the continuum) for selecting deeply obscured nuclei using JWST/MIRI filters z = 1.5 and z = 2. Color-coded stars correspond to the host galaxy contribution of the simulated spectra shown in Fig. 1. The blue dashed lines denotes the region where sources have a contribution of the buried nuclei greater than 40%. Gray circles correspond to CEERS sources with redshift measurements. Magenta squares represent those sources at redshift ∼1.25-1.75 (top panel) and 1.75-2.25 (bottom panel). |
All Tables
All Figures
|
Fig. 1. Expected 2-to-8 μm spectra of galaxies containing a deeply obscured nucleus with a varying specific fraction relative to the host star-forming galaxy. These spectra were generated using different fractions of the host galaxy (represented by the host star-forming galaxy using the JWST spectrum of NGC 3256-N; solid green line) superimposed on the continuum of the buried nucleus NGC 3256-S (solid black line). Solid dark red to blue lines correspond to increasing fractions of the host galaxy contribution with respect to the nuclear source. The vertical dashed gray lines denote the location of the brightest PAH features (3.3 and 6.2 μm) within the 2-to-8 μm spectral region. |
| In the text | |
|
Fig. 2. Diagnostic diagrams for identifying deeply obscured nuclei: 6.2/3.3 μm PAH EW ratio vs. the continuum 3-to-5 μm flux ratio. Filled circles correspond to buried nuclei in local LIRGs, and filled gray squares correspond to local ULIRGs. Dark blue and purple stars represent the central and circumnuclear regions of the star-forming galaxy NGC 3256, respectively, while the light blue stars indicate star-forming regions in NGC 7469. Labeled sources correspond to the various nuclei used in this work. Solid gray and light blue lines denote the 1σ, 2σ, and 3σ contours for deeply obscured nuclei and star-forming regions, respectively. |
| In the text | |
|
Fig. 3. Continuum 3-to-5 μm flux ratio (X axis on a log scale) as a function of the host galaxy contribution (Y axis on a linear scale). Color-coded stars correspond to the host galaxy contribution of the simulated spectra shown in Fig. 1. |
| In the text | |
|
Fig. 4. Color-color diagram (using the continuum) for selecting deeply obscured nuclei at z = 3 using JWST/MIRI filters. Color-coded stars correspond to the host galaxy contribution of the simulated spectra shown in Fig. 1. The dashed blue lines denote the region where sources have a contribution of the buried nuclei greater than 40%. Gray circles correspond to CEERS sources with redshift measurements. Magenta squares represent those sources at redshift ∼2.75–3.25. |
| In the text | |
|
Fig. A.1. EW(6.2 μm)/EW(3.3 μm) vs EW(12.7 μm)/EW(11.3 μm) for the sample. |
| In the text | |
|
Fig. B.1. From top to bottom pannels: Color-color diagram (using the continuum) for selecting deeply obscured nuclei using JWST/MIRI filters z = 1.5 and z = 2. Color-coded stars correspond to the host galaxy contribution of the simulated spectra shown in Fig. 1. The blue dashed lines denotes the region where sources have a contribution of the buried nuclei greater than 40%. Gray circles correspond to CEERS sources with redshift measurements. Magenta squares represent those sources at redshift ∼1.25-1.75 (top panel) and 1.75-2.25 (bottom panel). |
| In the text | |
Current usage metrics show cumulative count of Article Views (full-text article views including HTML views, PDF and ePub downloads, according to the available data) and Abstracts Views on Vision4Press platform.
Data correspond to usage on the plateform after 2015. The current usage metrics is available 48-96 hours after online publication and is updated daily on week days.
Initial download of the metrics may take a while.