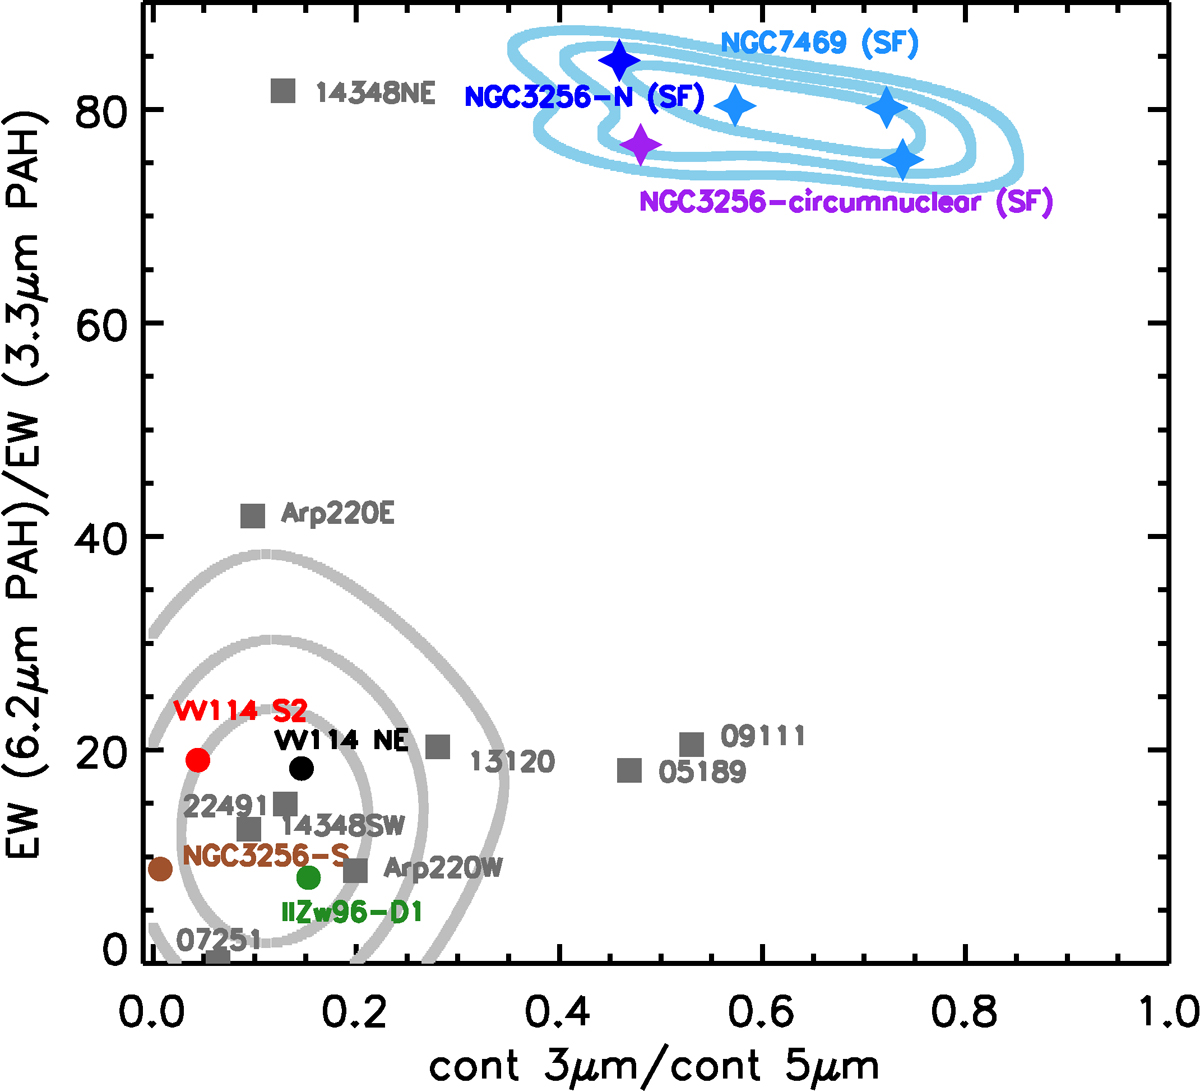
Fig. 2.
Download original image
Diagnostic diagrams for identifying deeply obscured nuclei: 6.2/3.3 μm PAH EW ratio vs. the continuum 3-to-5 μm flux ratio. Filled circles correspond to buried nuclei in local LIRGs, and filled gray squares correspond to local ULIRGs. Dark blue and purple stars represent the central and circumnuclear regions of the star-forming galaxy NGC 3256, respectively, while the light blue stars indicate star-forming regions in NGC 7469. Labeled sources correspond to the various nuclei used in this work. Solid gray and light blue lines denote the 1σ, 2σ, and 3σ contours for deeply obscured nuclei and star-forming regions, respectively.
Current usage metrics show cumulative count of Article Views (full-text article views including HTML views, PDF and ePub downloads, according to the available data) and Abstracts Views on Vision4Press platform.
Data correspond to usage on the plateform after 2015. The current usage metrics is available 48-96 hours after online publication and is updated daily on week days.
Initial download of the metrics may take a while.