| Issue |
A&A
Volume 682, February 2024
|
|
|---|---|---|
| Article Number | L5 | |
| Number of page(s) | 12 | |
| Section | Letters to the Editor | |
| DOI | https://doi.org/10.1051/0004-6361/202348744 | |
| Published online | 01 February 2024 | |
Letter to the Editor
Structures Of Dust and gAs (SODA): Constraining the innermost dust properties of II Zw96 with JWST observations of H2O and CO
1
Department of Physics, University of Oxford, Keble Road, Oxford OX1 3RH, UK
e-mail: This email address is being protected from spambots. You need JavaScript enabled to view it.
2
Instituto de Física Fundamental, CSIC, Calle Serrano 123, 28006 Madrid, Spain
3
Universidad de Alcalá, Departamento de Física y Matemáticas, Campus Universitario, 28871 Alcalá de Henares, Madrid, Spain
4
School of Sciences, European University Cyprus, Diogenes street, Engomi, 1516 Nicosia, Cyprus
Received:
27
November
2023
Accepted:
27
December
2023
Abstract
We analyze JWST NIRSpec+MIRI/MRS observations of the infrared (IR) gas-phase molecular bands of the most enshrouded source (D1) within the interacting system and luminous IR galaxy II Zw 096. We report the detection of rovibrational lines of H2O ν2 = 1 − 0 (∼5.3–7.2 μm) and 12CO ν = 1 − 0 (∼4.45–4.95 μm) in D1. The CO band shows the R- and P-branches in emission and the spectrum of the H2O band shows the P-branch in emission and the R-branch in absorption. The H2O R-branch in absorption unveils an IR-bright embedded compact source in D1 and the CO broad component features a highly turbulent environment. From both bands, we also identified extended intense star-forming (SF) activity associated with circumnuclear photodissociation regions (PDRs), consistent with the strong emission of the ionised 7.7 μm polycyclic aromatic hydrocarbon band in this source. By including the 4.5–7.0 μm continuum information derived from the H2O and CO analysis, we modelled the IR emission of D1 with a dusty torus and SF component. The torus is very compact (diameter of ∼3 pc at 5 μm) and characterised by warm dust (∼370 K), giving an IR surface brightness of ∼3.6 × 10⁸ L⊙ pc−2. This result suggests the presence of a dust-obscured active galactic nucleus (AGN) in D1, which has an exceptionally high covering factor that prevents the direct detection of AGN emission. Our results open a new way to investigate the physical conditions of inner dusty tori via modelling the observed IR molecular bands.
Key words: techniques: high angular resolution / techniques: spectroscopic / galaxies: active / galaxies: nuclei / infrared: galaxies
© The Authors 2024
 Open Access article, published by EDP Sciences, under the terms of the Creative Commons Attribution License (https://creativecommons.org/licenses/by/4.0), which permits unrestricted use, distribution, and reproduction in any medium, provided the original work is properly cited.
This article is published in open access under the Subscribe to Open model. This email address is being protected from spambots. You need JavaScript enabled to view it. to support open access publication.
1. Introduction
Most galaxies harbour supermassive black holes (SMBHs) in their centres, which indicates they which indicates they may be undergoing an active phase in their evolution (e.g. Hickox et al. 2014). A significant fraction of cosmic SMBH growth is taking place in a heavily obscured, but intrinsically luminous active galactic nucleus (AGN), which is generally weak or undetected in hard X-rays (e.g. Ueda et al. 2014). These deeply obscured nuclei are considered to be an important phase of galaxy evolution (e.g. Aalto et al. 2015), but the dominant power source is still under debate (e.g. Veilleux et al. 2009). The dusty cores absorb a significant fraction of the intrinsic AGN and starburst (SB) radiation, reprocessing it to emerge at longer wavelengths, peaking in the infrared (IR). In the Local Universe, a significant fraction (∼20–40%) of luminous IR galaxies (LIR > 1011 L⊙) harbour deeply obscured nuclei (e.g. Falstad et al. 2021; García-Bernete et al. 2022a; Donnan et al. 2023a). Unveiling their inner region is crucial to better understanding growth and evolution processes in luminous IR galaxies.
II Zw 096 is a complex interacting system and luminous IR galaxy located at a luminosity distance of 159 Mpc (z = 0.0362). This system consists of four main near-IR sources (A, B, C and D; e.g. Goldader et al. 1997, see also their Fig. 1). Goldader et al. (1997) classified sources A and B as galactic nuclei, whereas they found that the remaining two sources (C and D) are strongly reddened with prominent IR emission. Using HST/NICMOS 1.6 μm imaging observations, D was resolved into two sources: D0 and D1 (Inami et al. 2010), with the majority of the total IR luminosity coming from D1. Inami et al. (2022) demonstrated that D1 is indeed the dominant source of the system in the mid-IR as probed by James Webb Space Telescope and Mid-IR Instrument (JWST/MIRI). These authors also confirmed that the location of D1 coincides with the OH megamasers detected in II Zw 096 (Migenes et al. 2011; Wu et al. 2022). Migenes et al. (2011) estimated a lower limit for the enclosed mass of ∼109 M⊙ in D1, which is consistent with the presence of a SMBH. However, hard X-rays have not been detected from D1 (Ricci et al. 2021). Given its high hydrogen column density (Wu et al. 2022), a non-X-ray detection does not rule out a buried AGN.
These previous works have demonstrated the difficulty in providing definitive details regarding the nature of the nuclear-embedded source. II Zw 096 was selected as a JWST Early Release Science (ERS) target. The unprecedented combination of high angular and spectral resolution (R ∼ 1500 − 3500) in the 1.0–28.1 μm range afforded by the JWST Near-IR Spectrograph (NIRSpec; Jakobsen et al. 2022; Böker et al. 2022) and MIRI (Rieke et al. 2015; Wells et al. 2015; Wright et al. 2015) are key to investigating deeply embedded sources such as II Zw 096-D1.
JWST offers a unique advantage to probe warm molecular gas (rovibrational H2 lines) and a large number of ionic species covering a wide range of ionisation potentials (IPs), polycyclic aromatic hydrocarbon (PAH) bands, dust features (e.g. silicates), ices (e.g. H2O, CO, CO2), and gas-phase molecular bands (e.g. H2O, CO, CO2, C2H2, and HCN). All of them are excellent tracers to study the AGN-star-formation (SF) connection and the embedded nuclei. In this Letter, we report gas-phase rovibrational H2O and CO lines detection in D1, which we have used to characterise its dusty torus properties. To fit the CO and H2O molecular bands, we have taken all the spectroscopic parameters for CO and H2O from the HITRAN2020 database (Gordon et al. 2022).
2. The IR emission of II Zw 096
IR imaging and integral field spectroscopy of II Zw 096 was taken using JWST as part of the Director’s Discretionary Early Release Science (ERS) Program ID: 1328 (P. I. L. Armus and A. Evans). We refer to Appendix A for details on the data reduction. The NIRCam-F356W intensity map of Fig. 1 shows a larger level of detail than shown in previously published MIRI maps (Inami et al. 2022) due to the higher angular resolution at shorter wavelengths. Open stars in Fig. 1 correspond to the regions selected by Wu et al. (2022) for investigating the CO(3-2) molecular gas of the system. The NIRCam-F356W map mainly traces the hot dust and 3.3 μm PAH, with the latter beeing a good star formation (SF) activity indicator in SF galaxies (e.g. Rigopoulou et al. 1999) and AGN (e.g. Castro et al. 2014). Thus, the map reveals intense SF activity in those regions located in the C-D zone which also correspond with the brightest IR sources. D1 is the brightest source in the NIRCam-F356W intensity map (Fig. 1).
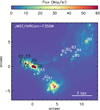 |
Fig. 1. IR intensity map of the interacting system II Zw 096. JWST/NIRCam F356W image (which mainly traces the hot dust and the 3.3 μm PAH band). White regions correspond to the A (A0, A1, A2, and A3) and B (B0, B1. B2, B3, B4, and B5) components of the system. Black regions (CO, C1, C2, C3, D0, D1, and D2) are the brightest IR sources in the system. Labeled regions are from Wu et al. (2022). All images are shown in linear colour scale. North is up and east is to the left, offsets are measured relative to D1. |
2.1. Molecular bands of II Zw 096-D1
To model the ro-vibrational H2O ν2 = 1 − 0 (∼5.3–7.2 μm; hereafter H2O band) and 12CO ν = 1 − 0 (∼4.45–4.95 μm; hereafter CO band), we removed a baseline continuum in the region of interest (see Appendix B for details). Figure 2 shows a large number of H2O and CO ro-vibrational lines in D1. The H2O band shows the P-branch in emission and the R-branch in absorption as was also found in the galactic Orion BN/KL (González-Alfonso et al. 1998). Conversely, both H2O ν2 = 1 − 0 branches are detected in absorption in VV 114 SW-s2 (González-Alfonso et al. 2024). The far-IR and submillimeter (submm) emission of H2O is well documented for luminous IR galaxies (e.g. González-Alfonso et al. 2010, 2014, 2022; Pereira-Santaella et al. 2017a). However, the limited sensitivity provided by previous instruments has prevented the detection of the mid-IR H2O lines in extragalactic sources. The CO band is also detected in D1, but with both the R- and P-branches in emission. This band has been also detected in emission in the outflow region of NGC 3256 (Pereira-Santaella et al. 2024) but appears in absorption toward its AGN nucleus, as well as towards the VV 114 SW-s2 core (González-Alfonso et al. 2024). Earlier studies have investigated the IR CO band using high spectral resolution ground observations in buried galaxy nuclei (e.g. Geballe et al. 2006; Shirahata et al. 2013; Onishi et al. 2021; Ohyama et al. 2023) and relatively low spectral resolution data using Spitzer and AKARI (Spoon et al. 2003; Baba et al. 2018). We also detect relatively weak Q-branch C2H2 (13.7 μm) and HCN (14.02 μm) molecular absorption in D1 (Appendix C).
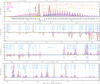 |
Fig. 2. Best-fit model for the CO and H2O gas-phase rovibrational bands in II Zw 096-D1. The first panel shows the CO band, while the rest of the panels show the H2O one. The JWST/NIRSpec and MIRI-MRS rest-frame continuum-subtracted spectra and model fits correspond to the black histograms (filled in gray) and red lines, respectively. We show the model for the torus (brown dashed line), outflow (magenta dashed line), SF-extended (blue dashed line), and cold-extended (green dashed line) components. The vertical lines correspond to the main H recombination, H2, and fine structure lines. Black, red and orange ticks indicate the position of the 12CO ν = 1 − 0, 13CO ν = 1 − 0 and C18O ν = 1 − 0 rovibrational lines. The blue ticks indicate the H2O ν2 = 1 − 0 rovibational lines that most contribute to the modelled spectrum. |
The H2O and CO bands in D1 show several components (see Fig. 2). The CO band exhibits a striking broad emission component covering both branches (i.e. the individual broad lines are blended forming a pseudo-continuum emission plateau). This can be explained with the presence of highly turbulent gas (outflow component). Given that the H2O lines are more separated in wavelength than those of the CO, this plateau is not observed in the H2O band. However, H2O broad components are detected in emission in the P-branch and in absorption in the R-branch. The H2O broad P-branch emission might be related to the outflow component, whereas the H2O absorption is produced against a strong IR continuum. The H2O absorption lines trace the dominant luminosity source (dusty torus component). The spectrum of D1 does not show the absorption component of the CO band. This is likely due to the CO broad plateau in emission, which is hiding the CO absorption related to the main luminosity source.
The CO band clearly also shows narrower emission lines in both branches (SF extended component). While these CO components are present up to the ∼P(18) transition, they are not detected for J > 5 in the R-branch. This indicates a P-R asymmetry in the CO-band (also e.g. González-Alfonso et al. 2002; Pereira-Santaella et al. 2024). The narrow emission component is detected on top of the highly turbulent H2O component in the P-branch described above. An extra narrow component is needed to explain the observed low-J CO transitions (up to J ∼ 6; cold extended component). The contribution of the cold extended component is not significant for the H2O band. The detected H2O and CO bands demonstrate a great potential for disentangling different components, specifically, four in the case of D1.
3. H2O and CO modelling
We analysed the rovibrational CO and H2O bands (including the 12CO ν = 1 − 0, 13CO ν = 1 − 0, and C18O ν = 1 − 0 bands) to characterise the properties of the various components present in the spectrum of II Zw 096-D1. We fit the CO and H2O molecular bands (∼4.5–7.3 μm) with a library of tailor-made models for D1. Our analysis also provides valuable predictions of the spectral energy distribution (SED) of the innermost source.
3.1. Library of tailor-made models and fitting strategy
Following the methodology presented in González-Alfonso et al. (2014; also González-Alfonso et al. 2021, 2024), we constructed a set of models for II Zw 096. The model components encompass diverse spherically symmetric gas and dust distributions. Statistical equilibrium computations were done by using collisional rate coefficients for the collisional excitation of CO and H2O with H2 (Yang et al. 2010; Daniel et al. 2011). The statistical equilibrium populations of H2O and CO were calculated using non-local and non-LTE radiative transfer computations including a careful treatment of blending among lines of the same or different species. In this way, we are able to calculate the fluxes and profiles associated with all relevant spectral lines and the dust continuum.
For fitting this source, we used four components (as identified in Sect. 2), with different physical properties (Tdust, Tgas, column density, gas density, and velocity dispersion). The library of models used for this fit are discussed in Appendix D. The components are: (1) the outflow component (turbulent gas) model needed to reproduce the broad plateau observed in both R- and P-branches of the CO band, and in the broad emission lines in the P-branch of H2O band; (2) the dusty torus component, which is mainly responsible for the H2O absorption lines of the R-branch; (3) the SF-extended warm gas component to explain the narrow line emission seen in the CO band, mainly in the P-branch; (4) a colder extended component to reproduce the narrow line excess detected in the low-J transitions of the CO band. We advance that the SF-extended component has an abundance ratio of [CO]/[H2O] ∼ 100 (Sect. 3.2), which is compatible with that of the Orion Bar1 (Habart et al. 2010), the prototypical Galactic photodissociation region (PDR). Therefore, the nature of this component is likely to be related to dense PDRs. Given the rotation pattern observed in the narrow 12CO ν = 1 − 0 P(13) transition (see Fig. E.1), rather than a compact source the SF-extended component is most likely related to an ensemble of PDRs distributed within the beam of JWST (∼195 pc). The presence of PDRs is also consistent with the large contribution of the ionised PAH to the mid-IR spectrum of D1. D1 exhibits a prominent 7.7 μm PAH band with an elevated 7.7 μm/11.3 μm PAH ratio (∼50; Donnan, in prep.), compared to values that are usually observed for SF galaxies (∼3.5; García-Bernete et al. 2022b,c).
To obtain the best-fit model, we minimised the χ2 in the fit to the entire CO and H2O bands. Given the large number of combinations ∼2 × 10⁹ and points to be evaluated, the fitting process was performed in three steps. First, we fixed the dusty torus models traced by the H2O absorption lines of the R-branch. Then, we considered all the possible combinations for the remaining components (∼4.7 × 10⁶ combinations). We then repeated the fitting process freezing all the components, except the torus component and started the fitting loop again. The fitting and masking of additional emission lines is described in Appendix D.
3.2. Best-fit model
In Fig. 2, we compare the observed and best-fit model profiles of the CO and H2O rovibrational lines. The residuals are discussed in Appendix F. The derived effective size of the nuclear dusty structure is very small (∼1.4 pc diameter at 5 μm) with a warm dust temperature (370 ± 20 K), as the typical torus around AGN (e.g. Pier & Krolik 1992). The detection of the C2H2 and HCN absorption bands provide further evidence of the presence of a compact buried nucleus (see Appendix C). The turbulent gas (potential nuclear outflow) has a gas temperature of 250 K and a relatively high velocity dispersion of ∼155 km s−1. The nature of this turbulent region is most likely connected to the inner dusty torus because both exhibit a relatively broad velocity dispersion and similar temperature for the gas. The SF extended component accounts for the observed asymmetry between the CO P- and R-branches. Finally, the cold component, which should be also extended, explains the low energy narrow lines observed in the CO band. This component shows the colder gas temperature (∼20 K). In Table 1, we list the physical parameters of each component. Figure 3 shows a sketch summarising all the components.
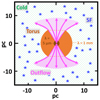 |
Fig. 3. Central region of II Zw 096-D1. The torus, outflow, SF-extended and cold-extended components correspond with the brown, magenta, blue and green colors as in Fig. 2. The orange component corresponds to the torus at 1 mm derived in Sect. 4, which is larger than that at ∼5 μm (brown component). This is expected since submm sizes correspond to the colder and, thus, more external material within the torus (e.g. García-Burillo et al. 2021). |
Main results from the H2O and CO modelling.
Our model shows the great potential of the H2O and CO bands to disentangle different components in the inner region of luminous IR galaxies. As mentioned above, we also derive the 4.5–7.0 μm dusty continuum associated with the fitted components. Interestingly, the continuum level associated with the torus is about ∼40–60% of the observed flux at 5–7 μm. This can provide important insights into the physical conditions of the nuclear warm dust in this source, as shown in continuation.
4. Inner dusty structure modelling: molecular bands as a tool for constraining the torus properties
Comparing torus models to the observed IR SEDs is an effective method for constraining the properties of the nuclear dusty structure. Torus models with a high covering factor and smooth dust distribution are better suited to reproduce the observed continuum of buried nuclei present in luminous IR galaxies (e.g. Levenson et al. 2007; Efstathiou et al. 2022; García-Bernete et al. 2022a). Here we combine these torus models with the constraints inferred from the models of the H2O and CO bands. High angular resolution IR data (∼1–20 μm) of local AGN (within ∼tens of Mpc) isolate most of the nuclear dust emission (inner ∼100 pc; e.g. García-Bernete et al. 2022d, and references therein). However, the properties of the extreme torus structure in more distant luminous IR systems are poorly understood, even using state-of-the-art IR instrumentation. Their central region consists of a combination of AGN and an intense SF activity component (e.g. Martínez-Paredes et al. 2015; Herrero-Illana et al. 2017; Efstathiou et al. 2022). Thus, best-fit solutions might be subject to multi-component fitting degeneracies.
Here, we use the radiative transfer CYprus models for Galaxies and their NUclear Spectra (CYGNUS) project (Efstathiou et al. 2022). We refer to this work and the references therein for further details on how the models are constructed. To fit the SED of D1, we used a Markov chain Monte Carlo (MCMC) fitting code (SED analysis through Markov chains; Johnson et al. 2013), which includes Bayesian statistics.
To build the 1–850 μm SED of D1, we used the entire NIRSpec and MRS spectra (resampled to ∼100 points), high angular resolution ALMA archival data (Appendix A), and lower angular resolution far-IR fluxes from Herschel. We measured the central fluxes in the ALMA data using a point-source extraction, and compiled the PACS and SPIRE point-source extracted fluxes from Chu et al. (2017). However, given the large physical area traced by the Herschel data (ranging from ∼5.3 to 34.7″; ∼3.8 to 25 kpc), we considered to set them as upper limits in the fit.
As expected in luminous IR galaxies hosting AGN, including dusty torus and SF components is required to reproduce the observed SED of D1. We include an additional grey body of 57 ± 4 K and β = 1.8 (following the same method as in Kovács et al. 2010). This component corresponds to the relatively cold dust associated with the SF component. Thus, we plot both components together in the left panel of Fig. 4 (blue dashed line).
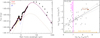 |
Fig. 4. Left panel: IR-to-submm SED of II Zw 096-D1 (black circles: JWST spectrum and ALMA continuum photometric data; black squares: Herschel fluxes from Chu et al. 2017). Orange stars correspond to the derived IR continuum from the observed H2O and CO bands. Dashed brown and dot-dashed blue lines correspond to the torus and SF-extended components. The dotted grey curve represents a grey body of 57 ± 4 K. The solid red line corresponds to the total model. Right panel: Submm vs. IR surface brightness. The magenta vertical line represents the theoretical limit for a warm SB (Thompson et al. 2005). Brown square and grey circles correspond to the surface brightness of D1 found in this work and those of IR galaxies from Falstad et al. (2021). Grey lines correspond to the best linear fit (R = 0.59; log (Σsubmm) = log (ΣIR)×(0.96 ± 0.21) – 10.24 ± 1.53). |
The best-fit torus model (without using any prior information from the bands) overestimated the intrinsic continuum in the range 4.9–7.0 μm relative to the continuum derived from the H2O and CO bands. The resulting fit has a high fractional contribution of the torus to the SED at 7 μm ( ). We can discard this scenario given that this strong central component would produce very deep absorption bands that are not observed in D1. The torus continuum level is indeed constrained by the observed H2O absorption band. This provides an observational limit to the contribution of the torus.
We repeated the fitting process but including the 4.9–7.0 μm SED derived from the H2O and CO analysis (Fig. 4, left). The fractional contribution of the torus to the SED is lower ( ), and the derived torus bolometric luminosity is about nine times smaller. Interestingly, the 4.9–7.0 μm continuum of the SF component is also consistent with that reported in Sect. 3.2. The derived torus diameter is ∼3 pc and ∼11 pc at 5 μm and 1 mm, respectively (see Appendix G). The size of the dusty structure at 5 μm derived from the torus model is roughly twice as large as that determined by the molecular bands fit. This difference arises from the torus models accounting for temperature gradients across the dust, whereas the model of molecular bands includes a single temperature blackbody. Hereafter, we use the size derived from torus models at 5 μm and 1 mm.
The resulting fit in Fig. 4 (left) underestimates the continuum emission at ∼12–15 μm. We further investigate the library of torus models, finding that models that reproduce 9.7 μm silicate absorption band as well as the emission at ∼12–15 μm overestimate the continuum emission at ∼7 μm. One possible explanation for the challenges in reproducing the silicate bands of this source could be related to its sub-solar metallicity2 (Z ∼ 0.6 − 0.8 Z⊙) and its relatively high gas-to-dust ratio (70–135; Appendix H). This suggests that a hard radiation field is present in D1, which might be affecting its dust properties (Rémy-Ruyer et al. 2014). Torus models generally assume the standard Galactic mix of 53% silicates and 47% graphite, which might be different in lower metallicity systems. A different composition of the dust grains can significantly affect the silicate absorption band (e.g. Tsuchikawa et al. 2021, 2022). However, investigating the mineralogical properties of dust grains is beyond the scope of this work.
5. Alternative ways of looking for AGN in D1
The superb sensitivity of the JWST allows us to search for faint high IP lines (see Appendix I). [Ca IV]λ3.21 μm and [Mg IV]λ4.49 μm transitions are detected with a signal-to-noise ratio (S/N) of > 3 (IP: 50.9 and 80.1 eV, respectively). The IP of [Ca IV] is not enough to firmly establish nuclear activity. Similarly, [Mg V] can be detected in non-AGN dominated regions of galaxies with publicly available JWST data, with unclear origin (Pereira-Santaella, in prep.). An emission line at 1.43 μm coincides with the expected position of [Si X] (IP: 351.1 eV), but [Si VI] is not detected, which is typically brighter than [Si X] in AGN (1.8 times on average; Rodríguez-Ardila et al. 2011). This indicates that the emission line observed at 1.43 μm is not likely to be related to [Si X].
Although AGN emission is not clearly detected, there is evidence for the presence of an accreting SMBH in D1. The diameter of the torus is very compact (∼3 and ∼11 pc at 5 μm and 1 mm, respectively) with a very warm dust temperature (∼370 K). Following the same argument as that in Downes & Eckart (2007), we estimate that nearly ∼7 × 10⁵ O stars need to be present in only ∼11 pc (a similar luminosity of M 82 but from a few thousand times smaller volume). The density of the required O stars would be consistent with the value derived from the buried AGN present in Arp 220 (west nucleus; Downes & Eckart 2007). The dusty structure bolometric luminosity is ∼6.8 × 10¹⁰ L⊙ and its IR surface brightness3 (ΣIR) is ∼3.6 × 10⁸ L⊙ pc−2. We plot in Fig. 4 (right) the relationship between the submm surface brightness and that of the IR for luminous IR galaxies (Falstad et al. 2021), finding that both surface brightness broadly correlate (R = 0.59) and the values derived in this work for D1 follow this relation. The elevated surface brightness found for this source is consistent with a buried AGN.
Reconciling the IR surface brightness of D1 with a compact SB is challenging. For instance, Rico-Villas et al. (2022) found a proto-super star cluster in NGC 253, which is extremely buried (NH ∼ 1025 cm−2), with a IR surface brightness of ∼1.3 × 10⁷ L⊙ pc−2, which is ∼30 times smaller than that of D1. In addition, from the theoretical point of view, there is a limit of ∼107 L⊙ pc−2 for a maximal SB (e.g. Thompson et al. 2005; Pereira-Santaella et al. 2021). Although we cannot rule out the possibility of an extreme top-heavy initial mass function (IMF) SB, this is unlikely since these systems are not stable on short timescales of few Myr (see e.g. Pereira-Santaella et al. 2021).
6. Summary and conclusions
We present a JWST NIRSpec+MIRI/MRS study of the IR gas-phase H2O (∼5.3–7.2 μm) and CO (∼4.45–4.95 μm) rovibrational bands from the most enshrouded source (D1) in the interacting system, luminous IR galaxy II Zw 096. Our main results are as follows.
-
We identified several components in the rovibrational H2O and CO bands in D1. By comparing the observed molecular rovibrational bands with radiative transfer models, we find that D1 is a complex structure featuring an IR-bright embedded dusty core (i.e. torus), which is most likely connected to a highly turbulent environment. We also detected widespread PDR emission, which is consistent with the strong emission of the ionised 7.7 μm PAH band in this source.
-
We modelled the IR emission of D1 using dusty torus and SF components, including the constraints at 4.5–7.0 μm SED inferred from the H2O and CO analysis. The size of the dusty structure is very compact (∼3 and ∼11 pc at 5 μm and 1 mm, respectively) with a warm dust temperature (∼370 K). The dusty structure bolometric luminosity is ∼6.8 × 10¹⁰ L⊙ and its IR surface brightness is ∼3.6 × 10⁸ L⊙ pc−2, suggesting the presence of a compact and dust-obscured AGN in D1. The exceptionally high covering factor of the dusty structure inhibits the direct detection of AGN emission.
In summary, this pilot study employing JWST/NIRSpec+MRS spectroscopy demonstrates the potential of the H2O and CO rovibrational bands for gaining insights into the inner regions of luminous IR galaxies, especially when spatially unresolved. New observations of luminous IR galaxies with JWST will allow for subsequent detailed studies, which will be crucial for enhancing the statistical significance of the findings presented here.
In contrast, the submm CO and H2O lines detected with Herschel have comparable strength in Mrk 231 (González-Alfonso et al. 2010).
The extreme PAH flux ratios found in D1 might be related to the low metallicy of this source (see e.g. Li 2020 for a review).
ΣIR = (LIR/2πr2) and Σsubmm = (Fsubmm/2πr2) are calculated using anisotropic IR luminosity and 1 mm flux from the best-fit torus model and a diameter of 11 pc.
Acknowledgments
The authors acknowledge the DD-ERS teams for developing their observing program with a zero–exclusive–access period. I.G.B. and D.R. acknowledge support from STFC through grants ST/S000488/1 and ST/W000903/1. E.G.-A. acknowledges grants PID2019-105552RB-C4 and PID2022-137779OB-C41 funded by the Spanish MCIN/AEI/10.13039/501100011033. M.P.S. acknowledges support from grant RYC2021-033094-I funded by MCIN/AEI/10.13039/501100011033 and the EU NextGenerationEU/PRTR. The authors are extremely grateful to Susana Guadix-Montero for helping with the sketch, and to the JWST helpdesk for their support. Finally, we thank the anonymous referee for their useful comments.
References
- Aalto, S., Martín, S., Costagliola, F., et al. 2015, A&A, 584, A42 [NASA ADS] [CrossRef] [EDP Sciences] [Google Scholar]
- Asplund, M., Amarsi, A. M., & Grevesse, N. 2021, A&A, 653, A141 [NASA ADS] [CrossRef] [EDP Sciences] [Google Scholar]
- Baba, S., Nakagawa, T., Isobe, N., et al. 2018, ApJ, 852, 83 [NASA ADS] [CrossRef] [Google Scholar]
- Bernard-Salas, J., Spoon, H. W. W., Charmandaris, V., et al. 2009, ApJS, 184, 230 [Google Scholar]
- Bohlin, R. C., Hubeny, I., & Rauch, T. 2020, AJ, 160, 21 [Google Scholar]
- Böker, T., Arribas, S., Lützgendorf, N., et al. 2022, A&A, 661, A82 [NASA ADS] [CrossRef] [EDP Sciences] [Google Scholar]
- Bolatto, A. D., Wolfire, M., & Leroy, A. K. 2013, ARA&A, 51, 207 [CrossRef] [Google Scholar]
- Castro, A., Miyaji, T., Shirahata, M., et al. 2014, PASJ, 66, 110 [NASA ADS] [CrossRef] [Google Scholar]
- Chartab, N., Cooray, A., Ma, J., Nayyeri, H., et al. 2022, Nat. Astron., 6, 844 [NASA ADS] [CrossRef] [Google Scholar]
- Chu, J. K., Sanders, D. B., Larson, K. L., et al. 2017, ApJS, 229, 25 [Google Scholar]
- Daniel, F., Dubernet, M.-L., & Grosjean, A. 2011, A&A, 536, A76 [NASA ADS] [CrossRef] [EDP Sciences] [Google Scholar]
- Donnan, F. R., Rigopoulou, D., García-Bernete, I., et al. 2023a, A&A, 669, A87 [NASA ADS] [CrossRef] [EDP Sciences] [Google Scholar]
- Donnan, F. R., García-Bernete, I., Rigopoulou, D., et al. 2023b, MNRAS, 519, 3691 [CrossRef] [Google Scholar]
- Downes, D., & Eckart, A. 2007, A&A, 468, L57 [NASA ADS] [CrossRef] [EDP Sciences] [Google Scholar]
- Efstathiou, A., Hough, J. H., & Young, S. 1995, MNRAS, 277, 1134 [Google Scholar]
- Efstathiou, A., Farrah, D., Afonso, J., et al. 2022, MNRAS, 512, 5183 [NASA ADS] [CrossRef] [Google Scholar]
- Falstad, N., Aalto, S., König, S., et al. 2021, A&A, 649, A105 [NASA ADS] [CrossRef] [EDP Sciences] [Google Scholar]
- García-Bernete, I., Ramos Almeida, C., Landt, H., et al. 2017, MNRAS, 469, 110 [CrossRef] [Google Scholar]
- García-Bernete, I., Rigopoulou, D., Aalto, S., et al. 2022a, A&A, 663, A46 [NASA ADS] [CrossRef] [EDP Sciences] [Google Scholar]
- García-Bernete, I., Rigopoulou, D., Alonso-Herrero, A., et al. 2022b, MNRAS, 509, 4256 [Google Scholar]
- García-Bernete, I., Rigopoulou, D., Alonso-Herrero, A., et al. 2022c, A&A, 666, L5 [NASA ADS] [CrossRef] [EDP Sciences] [Google Scholar]
- García-Bernete, I., González-Martín, O., Almeida, C. R., et al. 2022d, A&A, 667, A140 [NASA ADS] [CrossRef] [EDP Sciences] [Google Scholar]
- García-Bernete, I., Pereira-Santaella, M., González-Alfonso, E., et al. 2024, A&A, 681, L7 [NASA ADS] [CrossRef] [EDP Sciences] [Google Scholar]
- García-Burillo, S., Alonso-Herrero, A., Almeida, C. R., et al. 2021, A&A, 652, A98 [NASA ADS] [CrossRef] [Google Scholar]
- Geballe, T. R., Goto, M., Usuda, T., et al. 2006, ApJ, 644, 907 [NASA ADS] [CrossRef] [Google Scholar]
- Goldader, J. D., Goldader, D. L., Joseph, R. D., et al. 1997, AJ, 113, 1569 [NASA ADS] [CrossRef] [Google Scholar]
- González-Alfonso, E., & Sakamoto, K. 2019, ApJ, 882, 153 [Google Scholar]
- González-Alfonso, E., Cernicharo, J., van Dishoeck, E. F., et al. 1998, ApJ, 502, L169 [CrossRef] [Google Scholar]
- González-Alfonso, E., Wright, C. M., Cernicharo, J., et al. 2002, A&A, 386, 1074 [NASA ADS] [CrossRef] [EDP Sciences] [Google Scholar]
- González-Alfonso, E., Fischer, J., Isaak, K., et al. 2010, A&A, 518, L43 [NASA ADS] [CrossRef] [EDP Sciences] [Google Scholar]
- González-Alfonso, E., Fischer, J., Aalto, S., & Falstad, N. 2014, A&A, 567, A91 [NASA ADS] [CrossRef] [EDP Sciences] [Google Scholar]
- González-Alfonso, E., Pereira-Santaella, M., Fischer, J., et al. 2021, A&A, 645, A49 [EDP Sciences] [Google Scholar]
- González-Alfonso, E., Fischer, J., Goicoechea, J. R., et al. 2022, A&A, 666, L3 [NASA ADS] [CrossRef] [EDP Sciences] [Google Scholar]
- González-Alfonso, E., García-Bernete, I., Pereira-Santaella, M., et al. 2024, A&A, in press, https://doi.org/10.1051/0004-6361/202348469 [Google Scholar]
- Gordon, I. E., Rothman, L. S., Hargreaves, R. J., et al. 2022, J. Quant. Spectr. Rad. Transf., 277, 107949 [NASA ADS] [CrossRef] [Google Scholar]
- Habart, E., Dartois, E., Abergel, A., et al. 2010, A&A, 518, L116 [CrossRef] [EDP Sciences] [Google Scholar]
- Herrero-Illana, R., Pérez-Torres, M. Á., Randriamanakotoet, Z., et al. 2017, MNRAS, 471, 1634 [NASA ADS] [CrossRef] [Google Scholar]
- Hickox, R. C., Mullaney, J. R., Alexander, D. M., et al. 2014, ApJ, 782, 9 [NASA ADS] [CrossRef] [Google Scholar]
- Hollenbach, D., Kaufman, M. J., Bergin, E. A., et al. 2009, ApJ, 690, 1497 [Google Scholar]
- Inami, H., Armus, L., Surace, J. A., et al. 2010, AJ, 140, 63 [NASA ADS] [CrossRef] [Google Scholar]
- Inami, H., Surace, J., Armus, L., et al. 2022, ApJ, 940, L6 [NASA ADS] [CrossRef] [Google Scholar]
- Jakobsen, P., Ferruit, P., Alves de Oliveira, C., et al. 2022, A&A, 661, A80 [NASA ADS] [CrossRef] [EDP Sciences] [Google Scholar]
- Johnson, S. P., Wilson, G. W., Tang, Y., et al. 2013, MNRAS, 436, 2535 [CrossRef] [Google Scholar]
- Klaas, U., & Elsaesser, H. 1993, A&A, 280, 76 [NASA ADS] [Google Scholar]
- Kovács, A., Omont, A., Beelen, A., et al. 2010, ApJ, 717, 29 [CrossRef] [Google Scholar]
- Labiano, A., Azzollini, R., Bailey, J., et al. 2016, Proc. SPIE, 9910, 99102W [NASA ADS] [Google Scholar]
- Labiano, A., Argyriou, I., Álvarez-Márquez, J., et al. 2021, A&A, 656, A57 [NASA ADS] [CrossRef] [EDP Sciences] [Google Scholar]
- Lahuis, F., Spoon, H. W. W., Tielens, A. G. G. M., et al. 2007, ApJ, 659, 296 [Google Scholar]
- Leech, J., Isaak, K. G., Papadopoulos, P. P., et al. 2010, MNRAS, 406, 1364 [NASA ADS] [Google Scholar]
- Levenson, N. A., Sirocky, M. M., Hao, L., et al. 2007, ApJ, 654, L45 [NASA ADS] [CrossRef] [Google Scholar]
- Li, A. 2020, Nat. Astron., 4, 339 [CrossRef] [Google Scholar]
- Luridiana, V., Morisset, C., & Shaw, R. A. 2015, A&A, 573, A42 [NASA ADS] [CrossRef] [EDP Sciences] [Google Scholar]
- Martín-Hernández, N. L., Peeters, E., Morisset, C., et al. 2002, A&A, 381, 606 [NASA ADS] [CrossRef] [EDP Sciences] [Google Scholar]
- Martínez-Paredes, M., Alonso-Herrero, A., Aretxaga, I., et al. 2015, MNRAS, 454, 3577 [CrossRef] [Google Scholar]
- McMullin, J. P., Waters, B., Schiebel, D., et al. 2007, ASP Conf. Ser., 376, 127 [NASA ADS] [Google Scholar]
- Migenes, V., Coziol, R., Cooprider, K., et al. 2011, MNRAS, 416, 1267 [NASA ADS] [CrossRef] [Google Scholar]
- Neufeld, D. A., Ashby, M. L. N., Bergin, E. A., et al. 2000, ApJ, 539, L111 [NASA ADS] [CrossRef] [Google Scholar]
- Neufeld, D. A., Kaufman, M. J., Goldsmith, P. F., et al. 2002, ApJ, 580, 278 [NASA ADS] [CrossRef] [Google Scholar]
- Ohyama, Y., Onishi, S., Nakagawa, T., et al. 2023, ApJ, 951, 87 [NASA ADS] [CrossRef] [Google Scholar]
- Onishi, S., Nakagawa, T., Baba, S., et al. 2021, ApJ, 921, 141 [NASA ADS] [CrossRef] [Google Scholar]
- Pereira-Santaella, M., González-Alfonso, E., Usero, A., et al. 2017a, A&A, 601, L3 [NASA ADS] [CrossRef] [EDP Sciences] [Google Scholar]
- Pereira-Santaella, M., Rigopoulou, D., Farrah, D., et al. 2017b, MNRAS, 470, 1218 [NASA ADS] [CrossRef] [Google Scholar]
- Pereira-Santaella, M., Colina, L., García-Burillo, S., et al. 2021, A&A, 651, A42 [NASA ADS] [CrossRef] [EDP Sciences] [Google Scholar]
- Pereira-Santaella, M., Álvarez-Márquez, J., García-Bernete, I., et al. 2022, A&A, 665, L11 [NASA ADS] [CrossRef] [EDP Sciences] [Google Scholar]
- Pereira-Santaella, M., González-Alfonso, E., García-Bernete, I., et al. 2024, A&A, 681, A117 [NASA ADS] [CrossRef] [EDP Sciences] [Google Scholar]
- Pier, E. A., & Krolik, J. H. 1992, ApJ, 401, 99 [Google Scholar]
- Plume, R., Kaufman, M. J., Neufeld, D. A., et al. 2004, ApJ, 605, 247 [NASA ADS] [CrossRef] [Google Scholar]
- Rémy-Ruyer, A., Madden, S. C., Galliano, F., et al. 2014, A&A, 563, A31 [Google Scholar]
- Ricci, C., Privon, G. C., Pfeifle, R. W., et al. 2021, MNRAS, 506, 5935 [NASA ADS] [CrossRef] [Google Scholar]
- Rico-Villas, F., González-Alfonso, E., Martín-Pintado, J., et al. 2022, MNRAS, 516, 1094 [NASA ADS] [CrossRef] [Google Scholar]
- Rieke, G. H., Wright, G. S., Böker, T., et al. 2015, PASP, 127, 584 [NASA ADS] [CrossRef] [Google Scholar]
- Rigopoulou, D., Spoon, H. W. W., Genzel, R., et al. 1999, AJ, 118, 2625 [Google Scholar]
- Rodríguez-Ardila, A., Prieto, M. A., Portilla, J. G., et al. 2011, ApJ, 743, 100 [CrossRef] [Google Scholar]
- Rupke, D. S. N., Veilleux, S., & Baker, A. J. 2008, ApJ, 674, 172 [NASA ADS] [CrossRef] [Google Scholar]
- Sakamoto, K., Aalto, S., Evans, A. S., et al. 2010, ApJ, 725, L228 [NASA ADS] [CrossRef] [Google Scholar]
- Shirahata, M., Nakagawa, T., Usuda, T., et al. 2013, PASJ, 65, 5 [NASA ADS] [CrossRef] [Google Scholar]
- Spoon, H. W. W., Moorwood, A. F. M., Pontoppidan, K., et al. 2003, A&A, 402, 499 [NASA ADS] [CrossRef] [EDP Sciences] [Google Scholar]
- Thompson, T. A., Quataert, E., & Murray, N. 2005, ApJ, 630, 167 [Google Scholar]
- Tsuchikawa, T., Kaneda, H., Oyabu, S., et al. 2021, A&A, 651, A117 [NASA ADS] [CrossRef] [EDP Sciences] [Google Scholar]
- Tsuchikawa, T., Kaneda, H., Oyabu, S., et al. 2022, ApJ, 941, 50 [NASA ADS] [CrossRef] [Google Scholar]
- Ueda, Y., Akiyama, M., Hasinger, G., et al. 2014, ApJ, 786, 104 [NASA ADS] [CrossRef] [Google Scholar]
- Veilleux, S., Rupke, D. S. N., Kim, D.-C., et al. 2009, ApJS, 182, 628 [Google Scholar]
- Verma, A., Lutz, D., Sturm, E., et al. 2003, A&A, 403, 829 [NASA ADS] [CrossRef] [EDP Sciences] [Google Scholar]
- Wells, M., Pel, J.-W., Glasse, A., et al. 2015, PASP, 127, 646 [NASA ADS] [CrossRef] [Google Scholar]
- Wright, G. S., Wright, D., Goodson, G. B., et al. 2015, PASP, 127, 595 [NASA ADS] [CrossRef] [Google Scholar]
- Wu, H., Wu, Z., Sotnikova, Y., et al. 2022, A&A, 661, A125 [NASA ADS] [CrossRef] [EDP Sciences] [Google Scholar]
- Yang, B., Stancil, P. C., Balakrishnan, N., & Forrey, R. C. 2010, ApJ, 718, 1062 [Google Scholar]
Appendix A: Data reduction
A.1. JWST
We retrieved near-IR to mid-IR (2.87-5.27 μm) data observed using integral-field spectrographs MIRI MRS with a spectral resolution of R∼3700–1300 (Labiano et al. 2021) and NIRSpec with the grating-filter pairs G140H (0.97-1.89 μm), G235H (1.66-3.17 μm) and G395H (2.87-5.27 μm) with R∼2700 (Jakobsen et al. 2022; Böker et al. 2022). We primarily followed the standard MRS pipeline procedure (e.g. Labiano et al. 2016 and references therein) and the same configuration of the pipeline stages described in García-Bernete et al. (2022c) and Pereira-Santaella et al. (2022) to reduce the data. Some hot and cold pixels are not identified by the current pipeline, so we added some extra steps as described in Pereira-Santaella et al. (2024) and García-Bernete et al. (2024) for NIRSpec and MRS, respectively.
We extracted D1 spectrum by simultaneously applying 2D Gaussian models to both D1 and D0 to correctly deblend them at longer wavelengths. To do so, we employed observations of calibration point sources (MRS HD-163466 and IRAS,05248−7007, Programme IDs 1050 and 1049) to measure the width and position angle of a 2D Gaussian for each spectral channel. To obtain the point source flux we used the models of the calibration PSF stars from Bohlin et al. (2020), which is equivalent to applying aperture correction factors. We refer the reader to García-Bernete et al. (2024) for further details. We also note that D1, the primary focus of this study, is several times brighter than D0 (3-5 times in the mid-IR; Inami et al. 2022).
We also downloaded the fully reduced and calibrated NIRCam F356W (λc= 3.563 μm) observations to produce a high angular resolution IR intensity map for the system (see Fig. 1).
A.2. ALMA
II Zw 096 was observed in Bands 7 and 9 using the 12m ALMA array. HCN-vibrational (4–3) 356.256 GHz transition and 350.9 GHz continuum were observed in Band 7 and the 701.5 GHz continuum in Band 9. These data were obtained as part of programmes 2011.0.00612.S, 2012.1.01022.S, and 2017.1.01235.S (PI. S. Stierwalt, and L. Barcos-Muñoz). For the Band 7 data, we combined two datasets using extended and compact array configurations to increase the uv-plane coverage. We used the standard ALMA pipeline (CASA v6.2.1; McMullin et al. 2007) to calibrate and clean the data. The synthesised beam full-width half-maximum (FWHM) is 0 19×0
19×0 16 and the maximum recoverable scale is 5
 7. We also used the standard ALMA scripts to calibrate the Band 9 data. Because of the higher atmospheric variability at Band 9, the default phase calibration was not enough to correct the data. Thus, we self-calibrated the phase of the visibilities using the peak of the CO(6–5) emission. The synthesised beam FWHM is 0
 28×0
28×0 24 and the maximum recoverable scale is 2
 5.
5.
Appendix B: Baseline
We subtract a baseline the continuum emission and the broad PAH emission contribution to the II Zw 096-D1 spectrum. To do so, we have consistently used the same method for fitting the baseline of the CO and H2O bands. First, we fit the PAH profile using a modified version of PAHFIT to work with the higher spectral resolution NIRSpec and MRS data (Donnan et al. 2023b,a). The mid-IR modelling of this source will be presented in Donnan (in prep.). Using the PAH-subtracted spectrum, we then fit a cubic polynomial function masking all the remaining features present in the spectrum (see Fig. B.1).
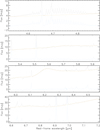 |
Fig. B.1. Fitted baseline of II Zw 096-D1. The JWST/NIRSpec and MRS rest-frame spectra and model fit (i.e. baseline+PAH features) correspond to the solid and orange lines. The baseline subtracted spectra is represented by a solid blue line. |
Appendix C: C2H2, HCN and submm HCN-vib (4-3) detection
We report the detection of HCN and C2H2 IR bands in II Zw 096-D1, which were non-detected in the previous Spitzer/IRS observations. The top panel of Fig. C.1 shows the detected C2H2 and HCN absorption bands in the JWST spectrum. These are considered excellent tracers of buried nuclei (e.g. Lahuis et al. 2007). The HCN 14 μm absorption band is relatively weak in II Zw 096-D1. The presence of the HCN in absorption suggest that the vibrationally pumped submm HCN (HCN-vibrational) emission in this nucleus might be present, given that this feature is responsible for populating the levels originating the HCN-vibrational emission (e.g. González-Alfonso & Sakamoto 2019). Indeed, the bottom panel of Fig. C.1 shows that the HCN-vibrational (4–3) 356.256 GHz is clearly detected in D1 (see Appendix A for details on the ALMA data reduction). This provides further evidence of the compact and deeply embedded nature of II Zw 096-D1 (e.g. Sakamoto et al. 2010; Aalto et al. 2015).
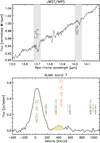 |
Fig. C.1. HCN emission of D1. Top: JWST/MRS spectrum showing the absorption bands of C2H2 and HCN. The spectrum is normalised at 14 μm. Bottom: ALMA submm spectrum showing the HCO+ and HCN-vib emission. |
Appendix D: Molecular grid of models and fitting of emission lines
The model grids are classified into four groups: a) torus, b) outflow, c) SF extended component and d) cold extended component. The torus models (396) have NCO = 1-4×1018 cm−2, Tdust = 300-400 K and 12CO/13CO = 50-70. The outflow models (243) have CO density of 2-8×106 cm−3, Tdust = 300-400 K, 12CO/13CO = 50-70 and velocity dispersion ranging from 200 to 240 km/s. The SF extended component models (243) have NCO = 1-4×1019 cm−2, Tdust = 300-400 K, 12CO/13CO = 50-70 and a range of covering factors to produce the P-R asymmetry. The cold extended component models (81) is represented by a cold component with Tgas = 20-40 K, illuminated by an IR source with Tdust = 300-400 K and 12CO/13CO = 50-70. Each of these 4 groups covers a regular grid in the free parameters. We sample the torus model temperature with ▵Tdust = 10 K to estimate the uncertainty associated to this parameter that is crucial for constraining the torus model.
To model the ro-vibrational H2O and CO bands, we also fit and masked additional emission lines within the spectral range of the molecular bands. While we masked additional emission lines within the H2O band ([Fe II] λ5.34μm, H2 0-0 S(7) λ5.51μm, HI 9-6 λ5.91μm, H2 0-0 S(6) λ6.11μm, [Ni II] λ6.64μm, [Fe II] λ6.72μm, HI 12-7 λ6.77μm, H2 0-0 S(5) λ6.91μm, and [Ar II] λ6.99μm), this is not doable for the CO band for which the individual lines are not as separated in wavelength as in the case of H2O. Thus, we also included emission from H2 0-0 S(9) λ4.58μm, HI 7-5 λ4.65μm, HI 11-6 λ4.67μm, [K III] λ4.62μm and Dn-PAH (4.65 μm). We fixed the FWHM of the PAH feature and the flux ratio of the HI recombination (7-5 and 11-6) and [K III] lines to the values derived in Pereira-Santaella et al. (2024).
Appendix E: Spatially resolved mid-IR CO
Figure E.1 shows the spatially resolved mid-IR 12CO ν = 1-0 P(13) emission in II Zw 096-D1. The narrow component of the CO P(13) emission line is not contaminated by the 13CO and C18O (Fig. 2). Although the intensity map is centrally concentrated (top panel of Fig. E.1), the size fitted with a Gaussian profile is larger than that measured in a calibration point source (NIRSpec TYC 4433-1800-1, Program ID 1128, PI: N. Luetzgendorf). Furthermore, the velocity field of the 12CO 1-0 P(13) emission feature indicates rotation of the SF extended component (bottom panel of Fig. E.1). We note that the comparison between the PSF star and D1 has been done in the cubes oriented in the instrument integral field unit plane (IFUALIGN) to mitigate PSF orientation effects. This is consistent with the extended PDR component found in Section 3.
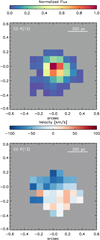 |
Fig. E.1. JWST/NIRSpec 12CO 1-0 P(13) emission map derived using a local continua (see text). Top panel: Intensity map. Bottom panel: Velocity map. |
Appendix F: Residuals of the best-fit model of the molecular bands
Figure F.1 shows the residuals of the best-fit model. The residuals at low-J lines (J< 3) of the 12CO ν = 1-0 band might be related with galactic diffuse or translucent clouds with low gas density and excitation temperature. It is probable that these clouds are also contributing to the H2O ν2 = 1-0 band, which clearly shows residuals in the ro-vibrational lines connected to the ν2 = 0 low-excitation rotational levels (e.g. 110-101). The enhancement of gas-phase H2O ground vibrational states could result from far-ultraviolet (FUV) photodesorption originating from grains coated with ice in translucent clouds, or in the envelopes of molecular clouds (Hollenbach et al. 2009). The latter are detected in the submm (e.g. Neufeld et al. 2000, 2002; Plume et al. 2004), and are not included in this model. As a consequence the fitted cold extended model for reproducing the relatively low-J lines of the CO band is overestimating the ∼R(4) to R(6) transitions. Residuals are also present in high-J transition of the 13CO ν = 1-0 and C18O ν = 1-0 bands, suggesting that the 12CO/13CO (and 12CO/C18O) ratios is higher.
 |
Fig. F.1. Residuals of the best-fit model for the CO and H2O gas-phase rovibrational bands in II Zw 096-D1. |
Appendix G: Best-fit torus model images
We find a high optical depth (τ9.7μm∼14.5) and highly inclined torus (∼80 deg) with a half-opening angle of ∼30 deg from the best-fit torus model. Following the same method as in Efstathiou et al. (1995), we obtain multi-wavelength images of the best-fit torus model (see Fig. G.1). Finally, by fitting a Gaussian, we measured sizes of ∼3 and 11 pc (diameter) at 5 μm and 1 mm, respectively.
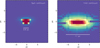 |
Fig. G.1. Intensity map of the best-fit torus model at 5 μm (left) and 1 mm (right). |
Appendix H: Metallicity
We estimated the gas-phase metallicity of D1 using the [Ar II]6.99 μm, [Ar III]8.99 μm, [Ne II]12.81 μm, [Ne III]15.56 μm, and H I 6–5 7.46 μm (Pfα) emission lines (Table H.1). We followed the prescription described in Verma et al. (2003) and used PyNeb v1.1.18 (Luridiana et al. 2015) to derive the emissivities of the Ar, Ne, and H lines.
Ar, Ne, and H extinction corrected fluxes.
For SBs, the ionisation correction factor for Ar is small (< 30%) based photoionisation models (Martín-Hernández et al. 2002). The effect on the Ne abundance is negligible. In addition, no emission from highly ionised Ar and Ne (e.g. García-Bernete et al. 2017; Pereira-Santaella et al. 2017b) related to the AGN (deeply obscured) is detected (see Table H.1). Therefore, we assumed that the ionic abundances derived from the [Ar II], [Ar III], [Ne II] and [Ne III] transitions trace the great majority of Ar and Ne (i.e. Ar/H ≃ (Ar+ + Ar++)/H+ and Ne/H ≃ (Ne+ + Ne++)/H+), respectively.
For an electron temperature of 10000 K (e.g. Bernard-Salas et al. 2009), the derived Ar and Ne abundance corresponds to 0.62–0.79 times the solar value (assuming the solar Ar/H and Ne/H derived in Asplund et al. 2021). This metallicity is lower than the range generally observed in U/LIRGs (Rupke et al. 2008; Pereira-Santaella et al. 2017b; Chartab et al. 2022).
We also derived the dust mass of D1 (2.3×10⁶ M⊙) from the grey body fit in Section 4 (following the same method as in Klaas & Elsaesser 1993). Using the ALMA CO (3–2) flux reported by Wu et al. (2022), the CO (3–2)/CO (1–0) ratio (measured in K km s−1) of 0.5-1 and the conversion factor generally used for ultraluminous IR galaxies (αCO = 0.8 M⊙[K km s−1 pc2]−1; for instance, Bolatto et al. 2013), we obtained a M(H2) of ∼1.6-3.1×10⁸ M⊙ and a hydrogen column density of log NH (cm−2)∼24.1 − 24.4 in a beam of ∼134 pc×107 pc for D1. Leech et al. (2010) reported a CO (3–2)/CO (1–0) ratio of ∼0.5 from integrated values of luminous IR galaxies, but in dense and hot clumps, the CO(3-2) excitation might be higher; thus, we discuss the results using a CO (3–2)/CO (1–0) ratio ranging from 0.5 to 1. We also derived a high excitation temperature (Tex ∼55 K) for the CO (3-2) in D1, which is consistent with the presence of widespread PDRs within the beam (see also Section 3) and intense emission of the ionised 7.7 μm PAH band. Finally, we found a gas-to-dust ratio in D1 of ∼70-135. Given the estimated metallicity of D1, its gas-to-dust ratio is relatively higher than that of "normal" SF galaxies (Rémy-Ruyer et al. 2014). This suggests that a hard radiation field is present in D1, which might be affecting the balance between dust formation and destruction (Rémy-Ruyer et al. 2014) and, thus, its dust properties.
Appendix I: High IP emission lines
Figure I.1 shows the various high IP lines present in II Zw 096-D1 with SNR greater than 3. Question marks indicate those that are not clearly detected.
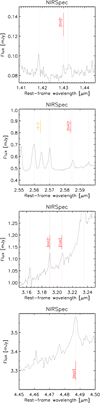 |
Fig. I.1. Potentially detected high IP emission lines in II Zw 096-D1. Black dotted, orange and red solid lines correspond to H2, H recombination and high ionisation potential lines, respectively. |
All Tables
All Figures
|
Fig. 1. IR intensity map of the interacting system II Zw 096. JWST/NIRCam F356W image (which mainly traces the hot dust and the 3.3 μm PAH band). White regions correspond to the A (A0, A1, A2, and A3) and B (B0, B1. B2, B3, B4, and B5) components of the system. Black regions (CO, C1, C2, C3, D0, D1, and D2) are the brightest IR sources in the system. Labeled regions are from Wu et al. (2022). All images are shown in linear colour scale. North is up and east is to the left, offsets are measured relative to D1. |
| In the text | |
|
Fig. 2. Best-fit model for the CO and H2O gas-phase rovibrational bands in II Zw 096-D1. The first panel shows the CO band, while the rest of the panels show the H2O one. The JWST/NIRSpec and MIRI-MRS rest-frame continuum-subtracted spectra and model fits correspond to the black histograms (filled in gray) and red lines, respectively. We show the model for the torus (brown dashed line), outflow (magenta dashed line), SF-extended (blue dashed line), and cold-extended (green dashed line) components. The vertical lines correspond to the main H recombination, H2, and fine structure lines. Black, red and orange ticks indicate the position of the 12CO ν = 1 − 0, 13CO ν = 1 − 0 and C18O ν = 1 − 0 rovibrational lines. The blue ticks indicate the H2O ν2 = 1 − 0 rovibational lines that most contribute to the modelled spectrum. |
| In the text | |
|
Fig. 3. Central region of II Zw 096-D1. The torus, outflow, SF-extended and cold-extended components correspond with the brown, magenta, blue and green colors as in Fig. 2. The orange component corresponds to the torus at 1 mm derived in Sect. 4, which is larger than that at ∼5 μm (brown component). This is expected since submm sizes correspond to the colder and, thus, more external material within the torus (e.g. García-Burillo et al. 2021). |
| In the text | |
|
Fig. 4. Left panel: IR-to-submm SED of II Zw 096-D1 (black circles: JWST spectrum and ALMA continuum photometric data; black squares: Herschel fluxes from Chu et al. 2017). Orange stars correspond to the derived IR continuum from the observed H2O and CO bands. Dashed brown and dot-dashed blue lines correspond to the torus and SF-extended components. The dotted grey curve represents a grey body of 57 ± 4 K. The solid red line corresponds to the total model. Right panel: Submm vs. IR surface brightness. The magenta vertical line represents the theoretical limit for a warm SB (Thompson et al. 2005). Brown square and grey circles correspond to the surface brightness of D1 found in this work and those of IR galaxies from Falstad et al. (2021). Grey lines correspond to the best linear fit (R = 0.59; log (Σsubmm) = log (ΣIR)×(0.96 ± 0.21) – 10.24 ± 1.53). |
| In the text | |
|
Fig. B.1. Fitted baseline of II Zw 096-D1. The JWST/NIRSpec and MRS rest-frame spectra and model fit (i.e. baseline+PAH features) correspond to the solid and orange lines. The baseline subtracted spectra is represented by a solid blue line. |
| In the text | |
|
Fig. C.1. HCN emission of D1. Top: JWST/MRS spectrum showing the absorption bands of C2H2 and HCN. The spectrum is normalised at 14 μm. Bottom: ALMA submm spectrum showing the HCO+ and HCN-vib emission. |
| In the text | |
|
Fig. E.1. JWST/NIRSpec 12CO 1-0 P(13) emission map derived using a local continua (see text). Top panel: Intensity map. Bottom panel: Velocity map. |
| In the text | |
|
Fig. F.1. Residuals of the best-fit model for the CO and H2O gas-phase rovibrational bands in II Zw 096-D1. |
| In the text | |
|
Fig. G.1. Intensity map of the best-fit torus model at 5 μm (left) and 1 mm (right). |
| In the text | |
|
Fig. I.1. Potentially detected high IP emission lines in II Zw 096-D1. Black dotted, orange and red solid lines correspond to H2, H recombination and high ionisation potential lines, respectively. |
| In the text | |
Current usage metrics show cumulative count of Article Views (full-text article views including HTML views, PDF and ePub downloads, according to the available data) and Abstracts Views on Vision4Press platform.
Data correspond to usage on the plateform after 2015. The current usage metrics is available 48-96 hours after online publication and is updated daily on week days.
Initial download of the metrics may take a while.