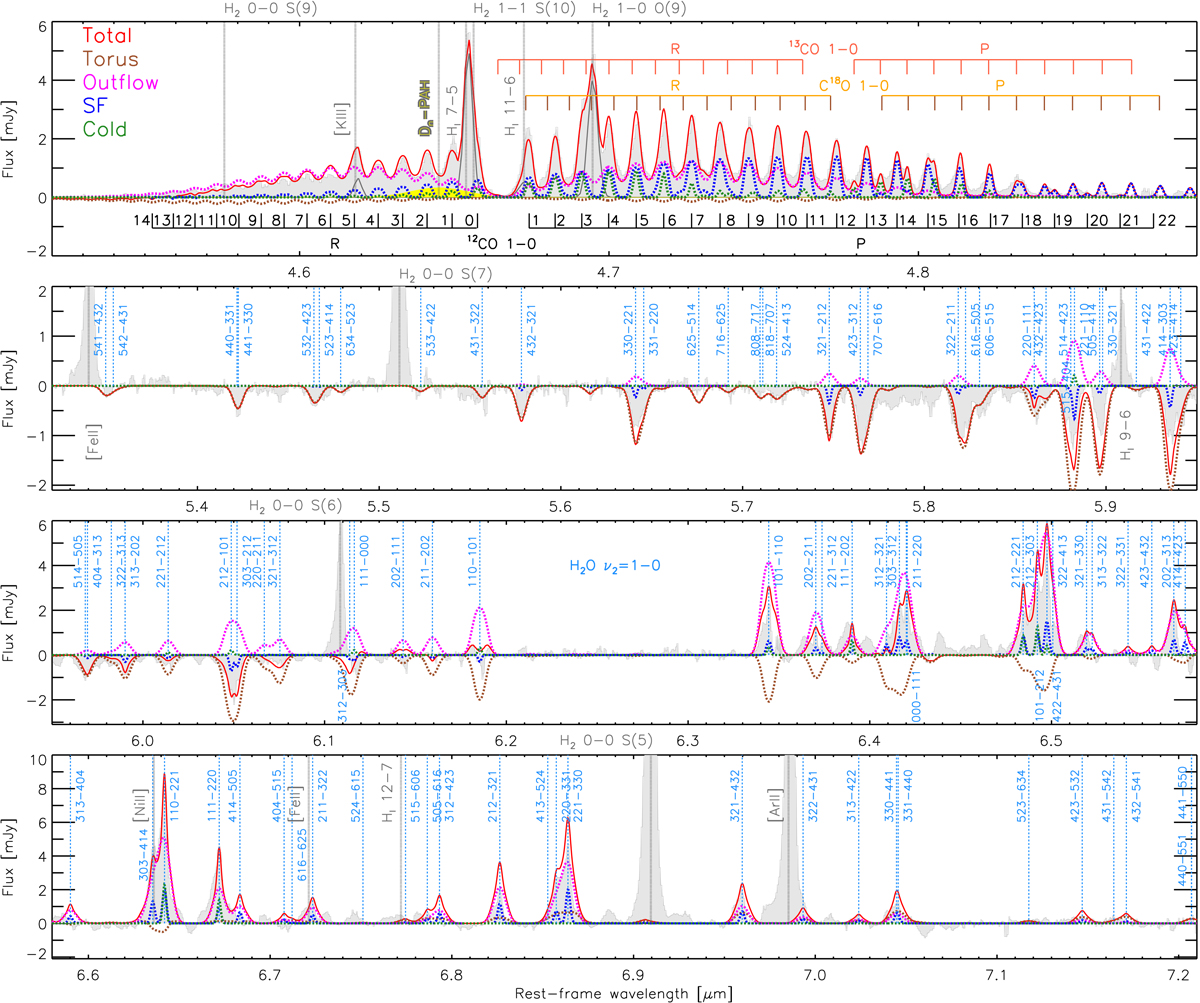
Fig. 2.

Download original image
Best-fit model for the CO and H2O gas-phase rovibrational bands in II Zw 096-D1. The first panel shows the CO band, while the rest of the panels show the H2O one. The JWST/NIRSpec and MIRI-MRS rest-frame continuum-subtracted spectra and model fits correspond to the black histograms (filled in gray) and red lines, respectively. We show the model for the torus (brown dashed line), outflow (magenta dashed line), SF-extended (blue dashed line), and cold-extended (green dashed line) components. The vertical lines correspond to the main H recombination, H2, and fine structure lines. Black, red and orange ticks indicate the position of the 12CO ν = 1 − 0, 13CO ν = 1 − 0 and C18O ν = 1 − 0 rovibrational lines. The blue ticks indicate the H2O ν2 = 1 − 0 rovibational lines that most contribute to the modelled spectrum.
Current usage metrics show cumulative count of Article Views (full-text article views including HTML views, PDF and ePub downloads, according to the available data) and Abstracts Views on Vision4Press platform.
Data correspond to usage on the plateform after 2015. The current usage metrics is available 48-96 hours after online publication and is updated daily on week days.
Initial download of the metrics may take a while.


