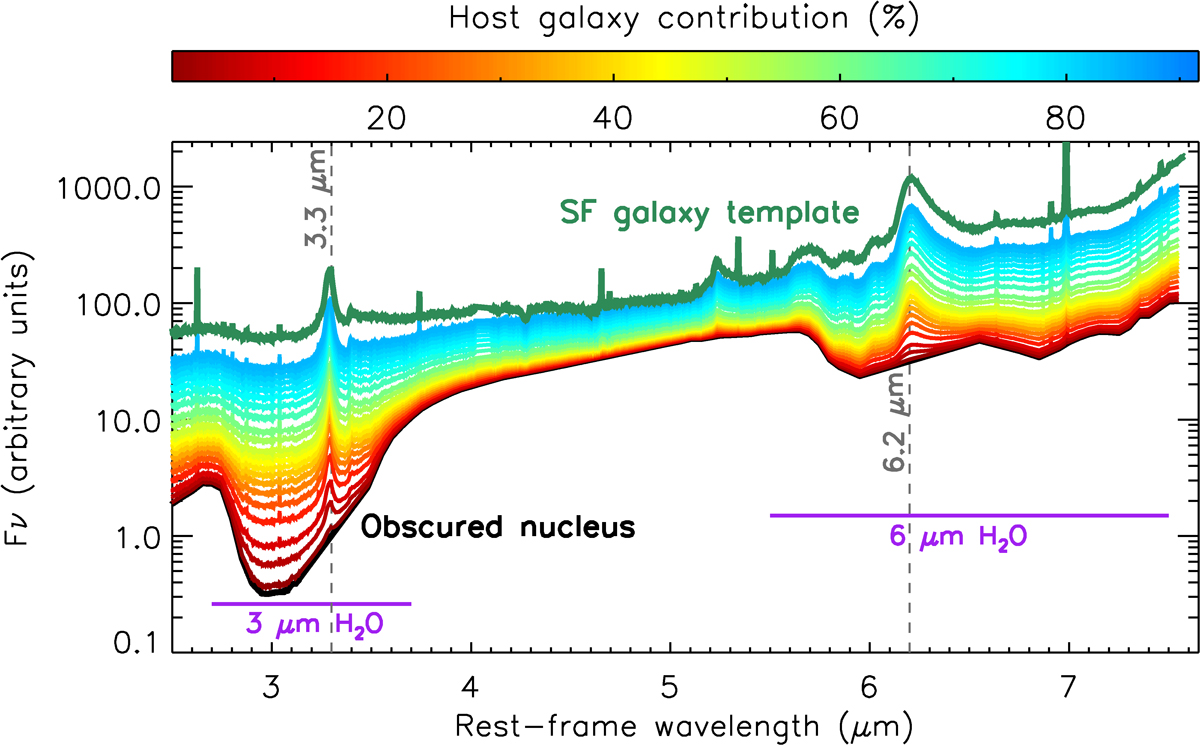
Fig. 1.
Download original image
Expected 2-to-8 μm spectra of galaxies containing a deeply obscured nucleus with a varying specific fraction relative to the host star-forming galaxy. These spectra were generated using different fractions of the host galaxy (represented by the host star-forming galaxy using the JWST spectrum of NGC 3256-N; solid green line) superimposed on the continuum of the buried nucleus NGC 3256-S (solid black line). Solid dark red to blue lines correspond to increasing fractions of the host galaxy contribution with respect to the nuclear source. The vertical dashed gray lines denote the location of the brightest PAH features (3.3 and 6.2 μm) within the 2-to-8 μm spectral region.
Current usage metrics show cumulative count of Article Views (full-text article views including HTML views, PDF and ePub downloads, according to the available data) and Abstracts Views on Vision4Press platform.
Data correspond to usage on the plateform after 2015. The current usage metrics is available 48-96 hours after online publication and is updated daily on week days.
Initial download of the metrics may take a while.