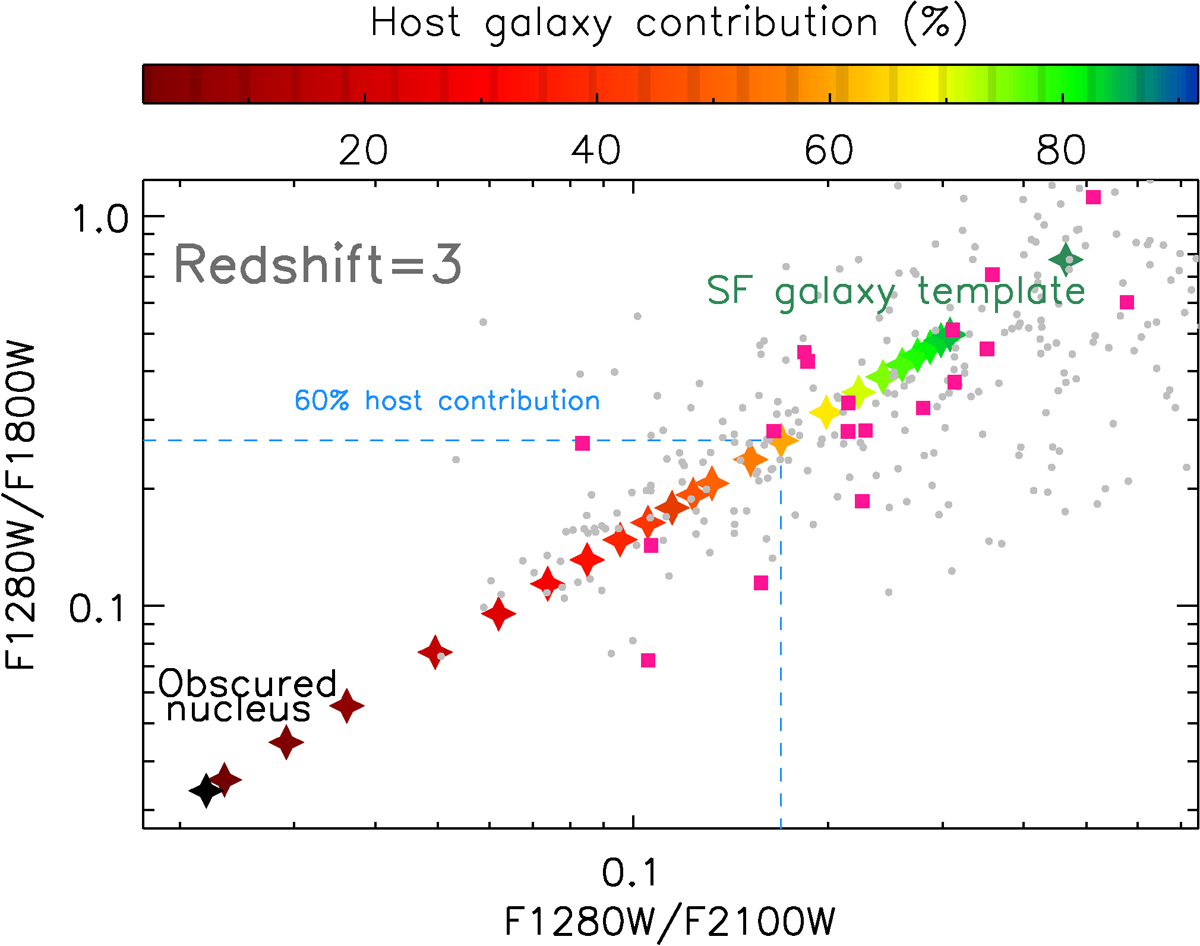
Fig. 4.
Download original image
Color-color diagram (using the continuum) for selecting deeply obscured nuclei at z = 3 using JWST/MIRI filters. Color-coded stars correspond to the host galaxy contribution of the simulated spectra shown in Fig. 1. The dashed blue lines denote the region where sources have a contribution of the buried nuclei greater than 40%. Gray circles correspond to CEERS sources with redshift measurements. Magenta squares represent those sources at redshift ∼2.75–3.25.
Current usage metrics show cumulative count of Article Views (full-text article views including HTML views, PDF and ePub downloads, according to the available data) and Abstracts Views on Vision4Press platform.
Data correspond to usage on the plateform after 2015. The current usage metrics is available 48-96 hours after online publication and is updated daily on week days.
Initial download of the metrics may take a while.