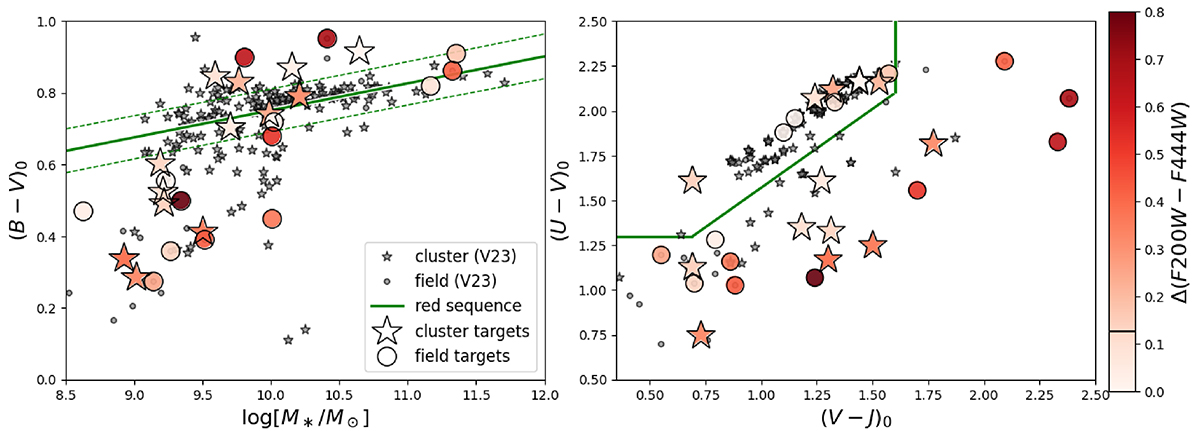
Fig. 2.
Download original image
Rest-frame colors of the galaxies. Stars and circles represent galaxies in the cluster and the field, respectively. Small symbols and gray colors show galaxies from Vulcani et al. (2023) not specifically targeted here. Larger symbols indicate the galaxies analyzed in the present paper and are color coded according to their Δ(F200W-F444W), which is measured as the difference between their measured color and the color they would have if they were on the red sequence given their F200W magnitude. The horizontal black line in the color bar shows the adopted threshold between normal galaxies and red outliers. Left: Rest-frame B-V vs. stellar mass diagram. The green line represents the best fit of the red sequence, along with the 3σ scatter. Right: Rest-frame U-V vs. V-J diagram. The green line represents the separation between star forming and passive galaxies from Labbé et al. (2005).
Current usage metrics show cumulative count of Article Views (full-text article views including HTML views, PDF and ePub downloads, according to the available data) and Abstracts Views on Vision4Press platform.
Data correspond to usage on the plateform after 2015. The current usage metrics is available 48-96 hours after online publication and is updated daily on week days.
Initial download of the metrics may take a while.