Open Access
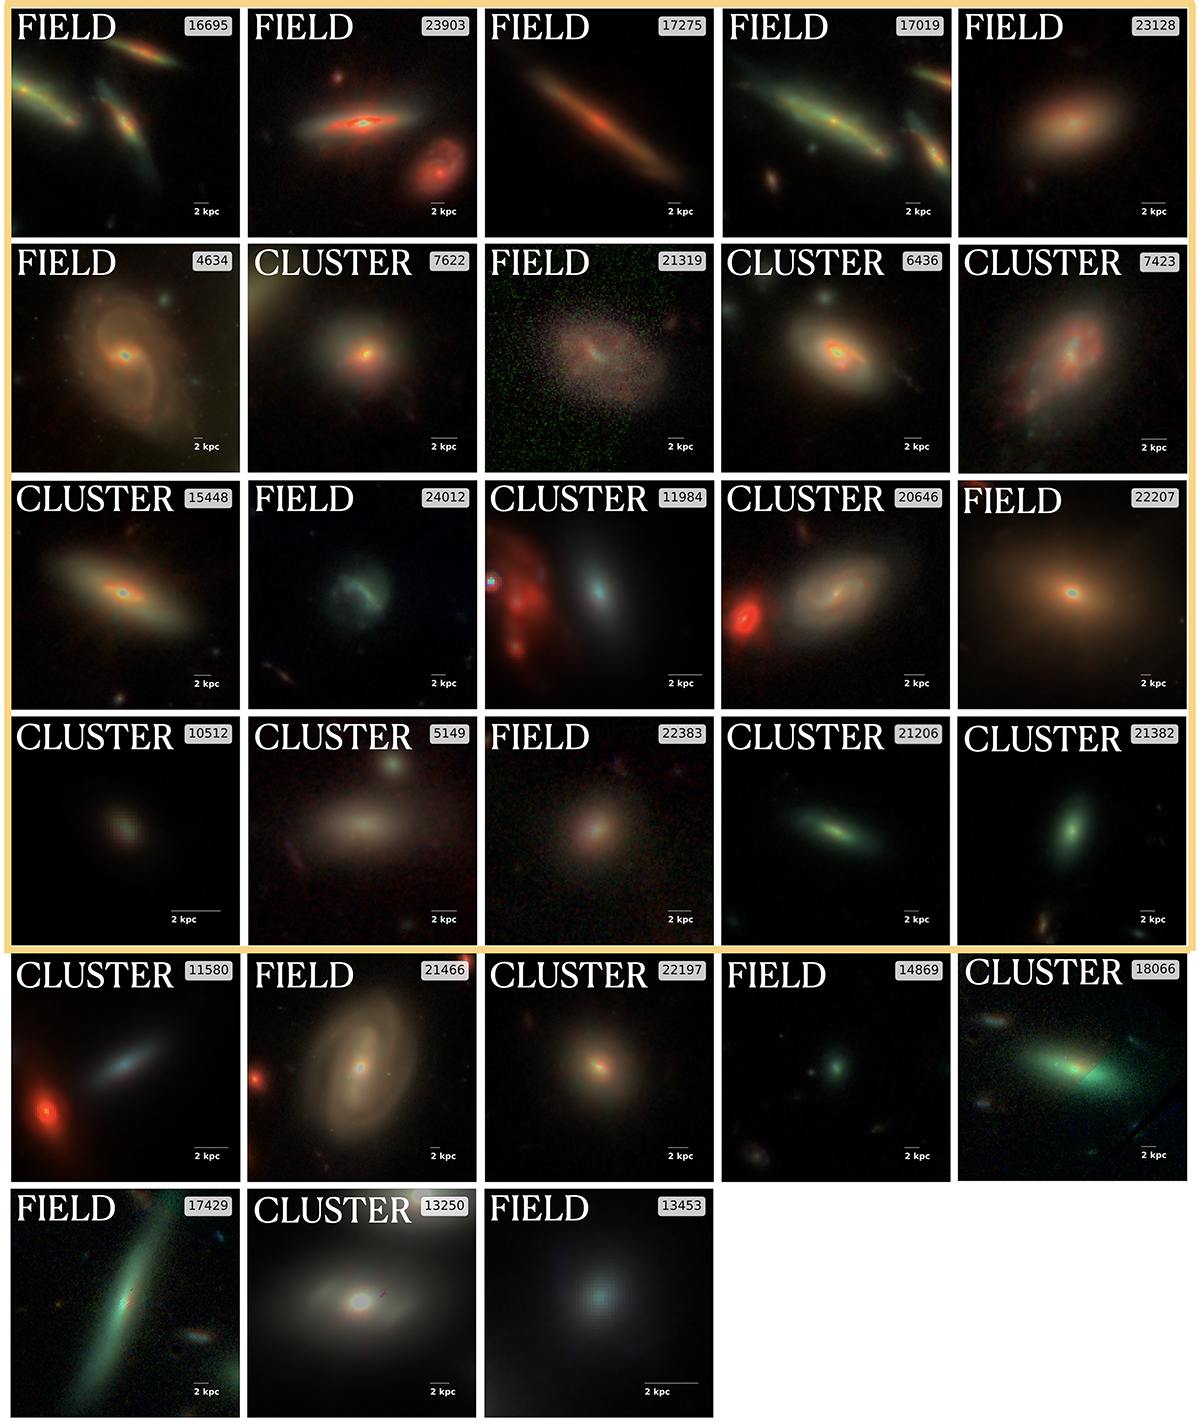
Fig. A.1.
Download original image
(F115W+F200W (or F150W if F200W is not reliable)+F444W images of the galaxies analyzed in this paper. The physical scale is reported in the lower right corners. Galaxies are sorted by decreasing red excess (see Sect. 4). The gold rectangle highlights the red outliers.
Current usage metrics show cumulative count of Article Views (full-text article views including HTML views, PDF and ePub downloads, according to the available data) and Abstracts Views on Vision4Press platform.
Data correspond to usage on the plateform after 2015. The current usage metrics is available 48-96 hours after online publication and is updated daily on week days.
Initial download of the metrics may take a while.