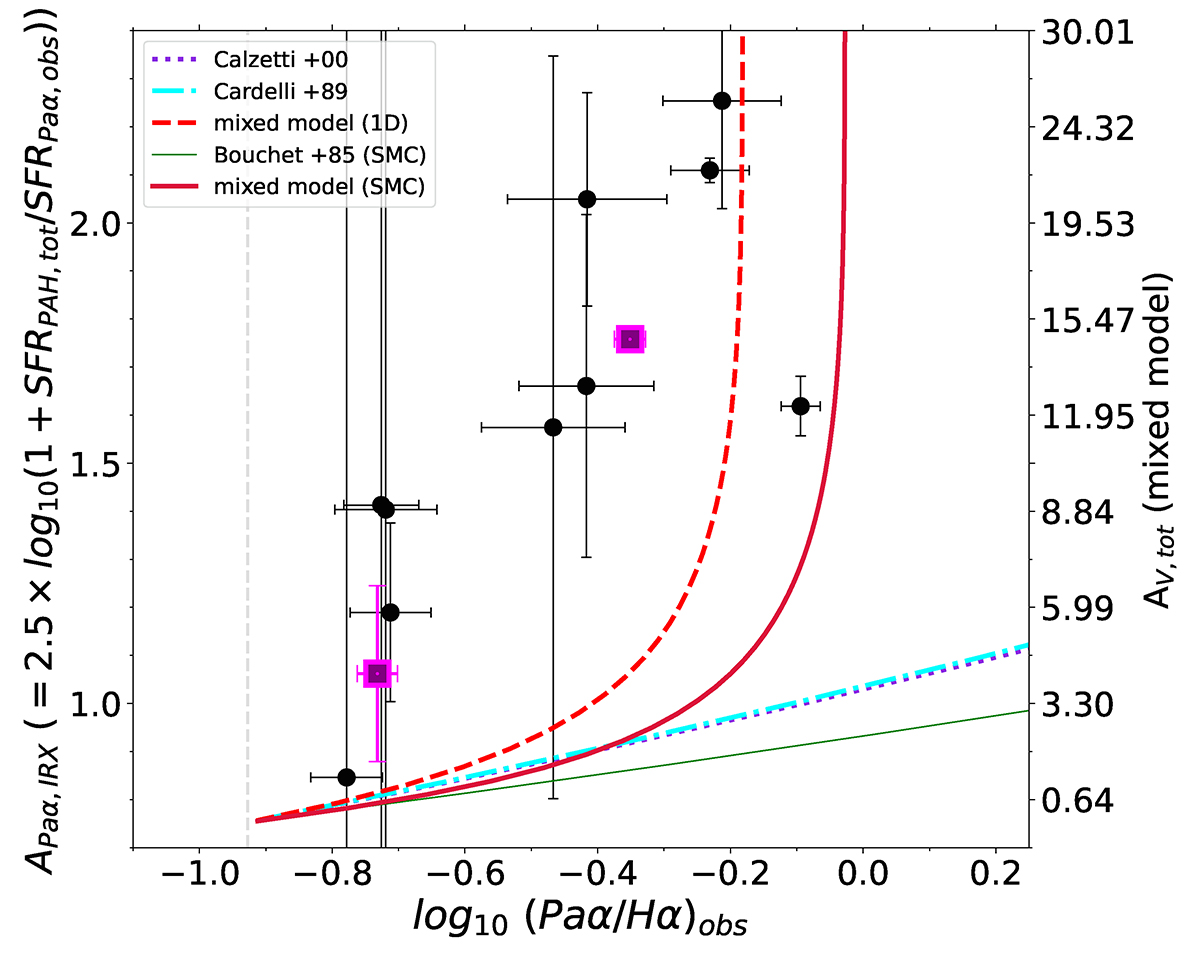
Fig. 11.
Download original image
Diagram comparing the ratio of Hα and Paα and APaα, IRX, that is the ratio of SFRs derived from the observed Paα and the PAH (APaα, IRX = 2.5 × log(1 + SFRPAH, tot/SFRPaα, obs)). Purple squares represent weighted average values in bins of Paα/Hα ratios. Expected values obtained considering different attenuation laws are also overplotted, as explained in the key.
Current usage metrics show cumulative count of Article Views (full-text article views including HTML views, PDF and ePub downloads, according to the available data) and Abstracts Views on Vision4Press platform.
Data correspond to usage on the plateform after 2015. The current usage metrics is available 48-96 hours after online publication and is updated daily on week days.
Initial download of the metrics may take a while.