Fig. 9.
Download original image
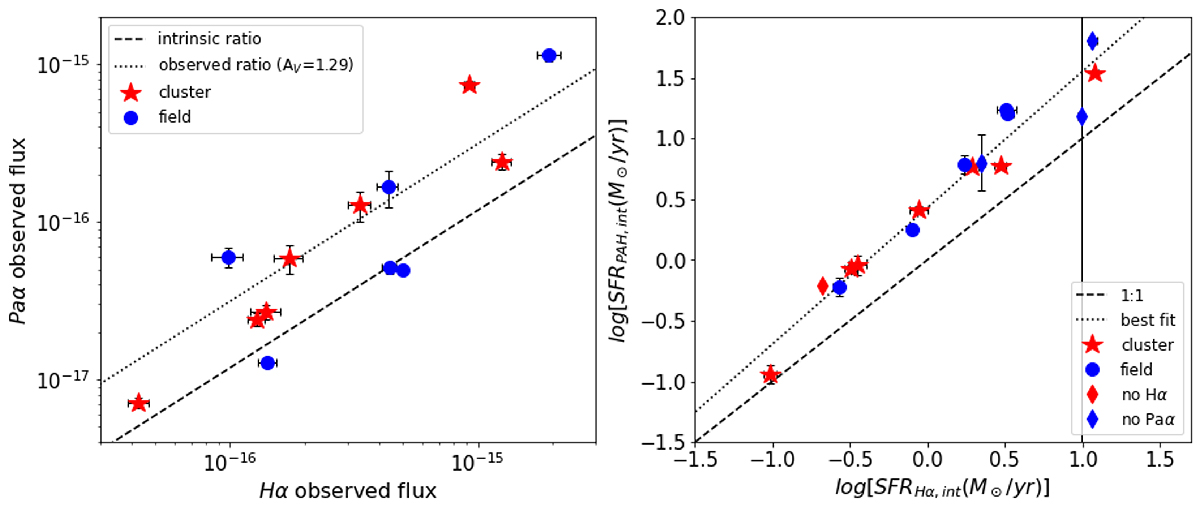
Comparison between Hα properties and other emission lines. Left panel: Observed Paα vs. Hα fluxes for the subset of galaxies with both measurements. The dashed line shows the intrinsic ratio, corresponding to a temperature of T = 104 K and an electron density of ne = 102 cm−3 for Case B recombination (Osterbrock 1989). The dotted line corresponds to the ratio obtained assuming an E(B-V) = 0.41, which is the best fit to our data. Right panel: Comparison between the dust-corrected SFRs obtained from Hα and PAH3.3. In both panels, cluster galaxies are shown in red, and field galaxies are shown in blue.
Current usage metrics show cumulative count of Article Views (full-text article views including HTML views, PDF and ePub downloads, according to the available data) and Abstracts Views on Vision4Press platform.
Data correspond to usage on the plateform after 2015. The current usage metrics is available 48-96 hours after online publication and is updated daily on week days.
Initial download of the metrics may take a while.