Fig. 1.
Download original image
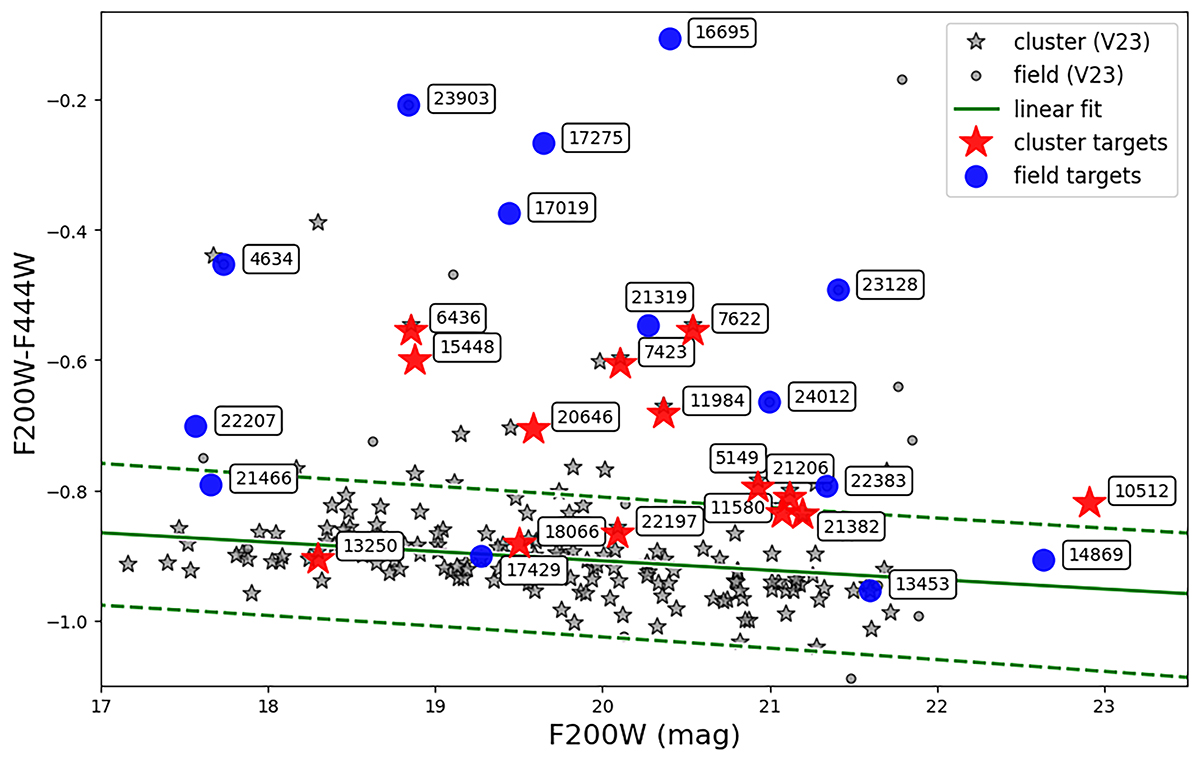
Observed color-magnitude diagram (F200W-F444W vs. F200W). Stars represent galaxies in the cluster, while circles represent galaxies in the field. Small symbols and gray colors show galaxies from Vulcani et al. (2023) not specifically targeted here. Larger symbols and red/blue colors indicate the galaxies analyzed in the present paper. The green solid line represents the best fit of the relation, obtained with an iterative 3σ clipping procedure. The dashed line shows the 3σ error. Galaxies deviating by more than 3σ from the best fit in the F200W-F444W vs. F200W plane are defined as red outliers. Here and throughout the paper, IDs are from Paris et al. (2023).
Current usage metrics show cumulative count of Article Views (full-text article views including HTML views, PDF and ePub downloads, according to the available data) and Abstracts Views on Vision4Press platform.
Data correspond to usage on the plateform after 2015. The current usage metrics is available 48-96 hours after online publication and is updated daily on week days.
Initial download of the metrics may take a while.