Fig. 6.
Download original image
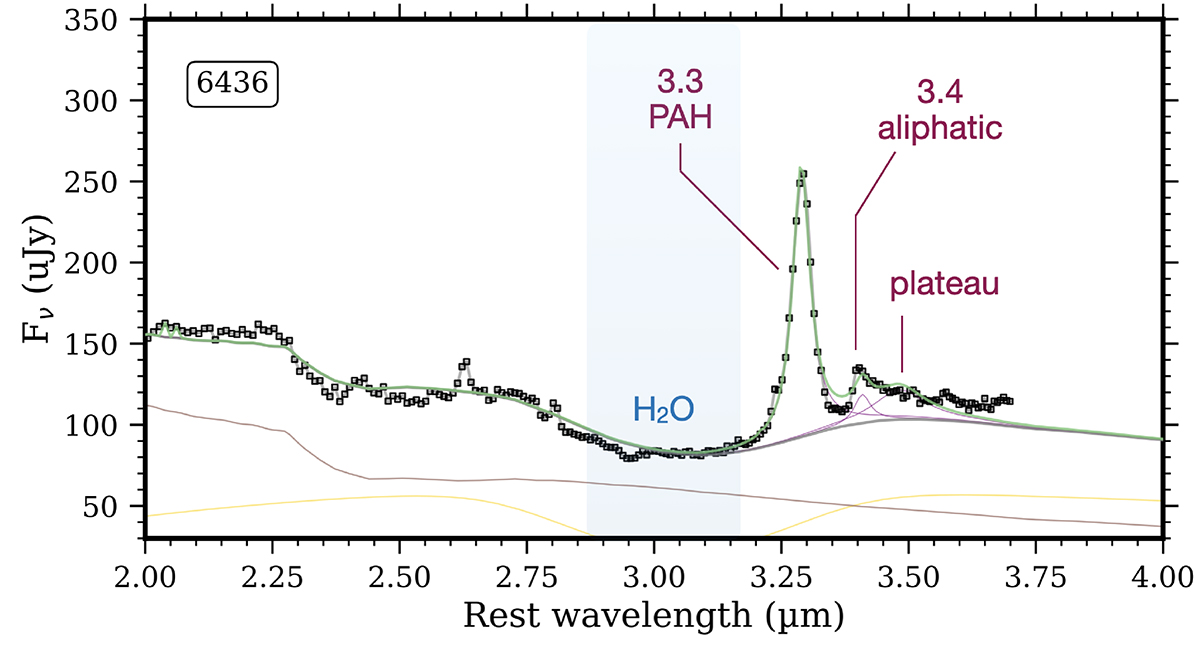
Example of our spectral decomposition result using CAFE on source 6436, which has strong PAH emission together with relatively high ice opacity among the sample. Features of interest are labeled, including the 3.3 μm PAH feature, the 3.4 aliphatic feature, the broad plateau feature, and the water ice absorption at 3.05 μm. Yellow and red lines represent stellar and non-stellar continuum sources. Note that the adopted spectral coverage and simplified treatment do not allow us to obtain a physical significance to individual continuum components.
Current usage metrics show cumulative count of Article Views (full-text article views including HTML views, PDF and ePub downloads, according to the available data) and Abstracts Views on Vision4Press platform.
Data correspond to usage on the plateform after 2015. The current usage metrics is available 48-96 hours after online publication and is updated daily on week days.
Initial download of the metrics may take a while.