| Issue |
A&A
Volume 693, January 2025
|
|
|---|---|---|
| Article Number | A16 | |
| Number of page(s) | 16 | |
| Section | Catalogs and data | |
| DOI | https://doi.org/10.1051/0004-6361/202451996 | |
| Published online | 23 December 2024 | |
A celestial reference frame derived from observations with the Very Long Baseline Interferometry Global Observing System
1
Technische Universität Wien (TU Wien), Department of Geodesy and Geoinformation,
Wiedner Hauptstraße 8-10,
1040
Vienna,
Austria
2
Jet Propulsion Laboratory, California Institute of Technology,
4800 Oak Grove Drive,
91109
Pasadena,
CA,
USA
3
ETH Zurich, Institute of Geodesy and Photogrammetry,
Robert-Gnehm-Weg 15,
8093
Zurich,
Switzerland
4
Laboratoire d’astrophysique de Bordeaux, Univ. Bordeaux, CNRS, B18N, Allée Geoffroy Saint-Hilaire,
33615
Pessac,
France
★ Corresponding author; This email address is being protected from spambots. You need JavaScript enabled to view it.
Received:
26
August
2024
Accepted:
7
November
2024
Abstract
Aims. We computed a celestial reference frame (CRF) from Very Long Baseline Interferometry (VLBI) Global Observing System (VGOS) data after five years of regular observations carried out under the umbrella of the International VLBI Service for Geodesy and Astrometry. In this paper we evaluate its strengths and weaknesses, document the source selection and scheduling strategies for the individual sessions, and investigate the effect of using this new VGOS CRF in the analysis of individual geodetic VLBI sessions where the radio source positions are fixed to their a priori coordinates.
Methods. We estimated the VIE2023-VG CRF in a global adjustment of 155 multi-baseline 24-hour VGOS sessions until 2024.0. We carried out several comparisons with the third version of the International Celestial Reference Frame (ICRF3) adopted by the International Astronomical Union in 2018, and with VIE2023sx CRF which includes VLBI S/X data until 2024.0. Furthermore, we studied the effect of more frequent estimations of tropospheric parameters (30,10, and 5 min for zenith wet delay) on the estimated CRF in the current VGOS network. We evaluated the VIE2023-VG CRF in the geodetic analysis of VGOS sessions by computing the baseline lengths and station positions and statistics on the Earth orientation parameters estimated in the single-session analysis where the source positions were fixed to either the VIE2023-VG CRF or to ICRF3-SX.
Results. The current VIE2023-VG CRF is built with 1.39 million VGOS group delays and includes 418 radio sources, where 172 sources (41%) are introduced in only four research and development sessions alone. We show that the VIE2023-VG CRF has excellent source position precision. The median formal error from the least-squares adjustment is 30 μas for right ascension (scaled by cosine of declination) and 47 μas for declination. In terms of systematic distortions versus ICRF3-SX, the largest terms in the vector spherical harmonics up to the degree and order two, reach in absolute values around 60 μas, caused by correlations between the individual terms. Because of the lack of observations in the southern hemisphere, a constraint for a zero slope in declination difference with respect to ICRF3-SX is imposed in the global adjustment. Therefore, VGOS should prioritize the development of southern stations in order to limit the need for such constraints on the frame. Further we show that fixing the a priori CRF to VIE2023-VG CRF instead of the ICRF3-SX in the single-session analysis improves the weighted root mean square of the baseline length by up to 3 mm, especially for the extremely long baselines (>12 000 km), with a weighted mean difference between the baseline length time series up to 2 mm. Therefore, in order to meet the ambitious goal of 1 mm accuracy for a terrestrial reference frame set by the Global Geodetic Observing System, the development of a VGOS-only CRF is required for use in the geodetic analysis of the new generation VGOS data.
Key words: methods: data analysis / techniques: interferometric / astrometry / reference systems
© The Authors 2024
 Open Access article, published by EDP Sciences, under the terms of the Creative Commons Attribution License (https://creativecommons.org/licenses/by/4.0), which permits unrestricted use, distribution, and reproduction in any medium, provided the original work is properly cited.
This article is published in open access under the Subscribe to Open model. This email address is being protected from spambots. You need JavaScript enabled to view it. to support open access publication.
1 Introduction
The International Very Long Baseline Interferometry (VLBI) Service for Geodesy and Astrometry (IVS; Nothnagel et al. 2017) is in transition from its legacy system, which observed radio signals in the S/X-band (2.3/8.4 GHz), to a new broadband VLBI Global Observing System (VGOS; Petrachenko et al. 2009, 2012). This was driven by the goals set by the Global Geodetic Observing System (GGOS) of the International Association of Geodesy (IAG), which has envisioned a global terrestrial reference frame (TRF) with an accuracy on a decadal scale of 1 mm and an annual stability of at least 0.1 mm/yr (Blewitt et al. 2010; Schuh et al. 2002). A global TRF of such an accuracy is essential, for example for the observation of any subtle geodynamic processes, or glacial and sea ice melting with corresponding sea level changes along the coastlines. VGOS targets the GGOS goals by observing four 512 MHz bands with center frequencies approximately at 3.2 GHz, 5.5 GHz, 6.6 GHz, and 10.4 GHz (Niell et al. 2018; Xu et al. 2022) with small-diameter (12–13 m) radio telescopes, which have high slew speed in azimuth angle of ~12° s−1 and an elevation angle slew speed of ~6° s−1 (Petrachenko et al. 2009). This change in the VLBI equipment and observing scheme in these next generation VGOS sessions also has an impact on the determination of the celestial reference frame (CRF), where the source positions are determined from group delays estimated from the linear phase change across the multiple frequency channels (Cappallo 2014).
In this paper, we analyze the available multi-baseline 24-hour VGOS sessions. The regular observations have been in place since January 2019, and occur with a weekly to bi-weekly cadence. We provide a detailed description of the source selection for the VGOS sessions (Sect. 2) and we continue with a precise explanation of the scheduling strategies (Sect. 3). We assess the differences in the applied scheduling for the operational sessions (VGOS-OPS) and ten research and development (VGOS-R&D) sessions, and show the distribution of scheduled scans and observations per source. The analyzed VGOS sessions with the settings applied in the geodetic VLBI analysis software are described in Sect. 4. We estimate the celestial reference frame VIE2023-VG CRF in a global solution of the VGOS sessions, with consistent TRF and Earth orientation parameters (EOP) and provide the CRF characteristics in Sect. 5.
The main part of the paper (Sect. 6) is devoted to comparisons of the VIE2023-VG CRF with the third version of the International Celestial Reference Frame (ICRF3; Charlot et al. 2020), which is the currently adopted version of the ICRF by the International Astronomical Union (IAU) (Sect. 6.1). We also conduct the comparison with VIE2023sx CRF (Krásná 2024b; Krásná et al. 2023)1, which includes five more years of VLBI sessions than ICRF3 (i.e., until December 2023) similar to VIE2023-VG CRF. In addition, we assess the effects of shorter estimation intervals for the path delays in the neutral atmosphere on the estimated VGOS CRF solutions in the current VGOS network (Sect. 6.2). The evaluations of the VIE2023-VG CRF in a geodetic analysis (Sect. 6.3) are done in terms of baseline length and station position offsets and repeatabilities together with statistics of the estimated five Earth orientation parameters with fixed CRF in the single-session analysis. In Sect. 7, we summarize our main findings.
2 Observed sources
For simplicity, we separated the VGOS sessions into three groups which differ in the strategy applied to select the observed sources.
Phase 1. VGOS sessions up to VT9318 (2019 November 14) were generated using the same 99 sources selected from a source list that is regularly utilized for sessions within the IVS containing a total of 336 sources2. It is important to note that these 99 sources were only considered potential sources during the creation of the schedule. Due to scheduling optimization algorithms, source visibility, source brightness, and other factors, not all of them were used in the final schedule, see Sect. 3 In fact, the average number of scheduled sources per session during this time was only 67. From VT8067 onwards (2018 March 08), the number of potential sources dropped by one to 98 since 0718+792 was removed from the potential list of sources. Surprisingly, two of these sources have never been scheduled (0035−252 and 1357+769), while ten others were scheduled in fewer than five sessions.
Phase 2. From VT9329 onwards (2019 November 25), the list of potential sources considered in the VGOS-OPS sessions was extended to cover more sources from the initial IVS source list. Since then, the number of considered sources has increased to 284. During this time, on average, 77 sources were scheduled per session. However, there is a strong imbalance with respect to the number of scans per source per session. On average, 10% of sources were scheduled in fewer than five scans and 25% in fewer than ten scans. On the other hand, on average, 10% of sources were scheduled in more than 45 scans and 25% in more than 34 scans.
VGOS-R&D. The first VGOS-R&D session VR2101 (2021 July 29, see Fig. 1), was scheduled using the 99 sources from Phase 1, plus 55 other sources from Phase 2 with low residuals in previous VGOS sessions. Thus, the total number of potential sources was 154 out of which 94 sources were scheduled.
Sources for sessions VR2201–VR2205 (2022 January 20 to September 15) were selected based on the performance in previous VGOS sessions. In this context, the performance of a source is defined based on the root mean square of the residuals from observations of this source calculated based on the least-squares adjustment (see Sect. 4), as well as based on the success rate of the observations, meaning the fraction of scheduled observations that were finally used in the analysis. Furthermore, 62 additional sources were added to the list of potential sources out of which 37 were not in the initial source list and 36 had not yet been scheduled with VGOS. These sources were selected by filtering for sources with 400 mJy median flux density for baselines >5000 km at S/X (or C/X in case no S-band flux densities were available) and with the median ratio of X-band flux density over the flux density of the lower band greater than 0.5. From the list of new potential sources, 34 were scheduled in VR2201.
VR2206 (2022 November 09) was scheduled with a list of 142 potential sources out of which 101 were selected based on previous VGOS source performance. The remaining 41 were selected from the ICRF3 defining source list, among which 29 were not in the initial source list and 25 had not been scheduled with VGOS. From the 41 additional sources, 25 new sources were scheduled in this session.
Session VR2301 (2023 January 25) and VR2302 (2023 May 31) were scheduled with a dedicated source-centric scheduling approach as discussed in Sect. 3. While VR2301 was scheduled using sources that perform well with VGOS, allowing for a better comparison of the scheduling approaches, VR2302 extended the potential source list significantly. Initially, the same source list as utilized in VR2301 was used but extended by another 215 sources that either performed well in the previous sessions or had not yet been observed with VGOS but which were theoretically bright enough to be detected. Ultimately, the session included 88 new sources that had not been previously scheduled with VGOS.
Session VR2303 (2023 August 24) was designed to test sources for bandpass calibration and included another 25 new sources. The session was not designed for geodetic or astrometric analysis, thus, it is not representative of the VGOS-R&D programme. The database was not released by the IVS and therefore is beyond the scope of this paper.
Finally, VR2304 (2023 November 16) included another 31 potential sources that had so far not been observed, out of which 25 were scheduled in the session.
In summary, the VGOS-R&D sessions played a significant role in extending the VGOS source list: VR2302 included 88 new sources, VR2201 34, and VR2206 with VR2304 added 25 each. In total, 172 of the 481 sources scheduled in VGOS were introduced in these four sessions alone, while the potential list of additional sources is still significantly larger.
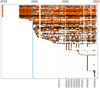 |
Fig. 1 Observed radio sources (y-axis) in VIE2023-VG CRF per session. The x-axis is sorted chronologically with the VGOS-R&D sessions marked. The vertical blue line represents the transition between Phase 1 and Phase 2. ICRF3 defining sources are highlighted in orange. |
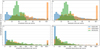 |
Fig. 2 Histograms with distribution of scans (upper panels) and of observations (lower panels) per source based on the generated schedules (left panels) and on the performed good observations (right panels). The histograms are generated separately from VGOS-OPS (blue), VGOS-R&D without VR2301 and VR2302 (orange), and only for VR2301 and VR2302 (green). The normalized number of sources means that the total area under each histogram adds up to one. For example, sessions VR2301 and VR2302 observed 114 and 177 sources, respectively, so the original sample size for deriving the VR2301/02 histogram (in green) was 291. |
3 Scheduling strategy
The VGOS-OPS sessions are scheduled using the “sked” scheduling software (Gipson 2010). The scheduling strategy, relevant to the content of the paper, is the following: in the first step, the software screens the list of potential sources and preselects 100 sources that are further considered in the scheduling process (or 99/98 sources for sessions during Phase 1 discussed in Sect. 2). The scheduling is done using a standard geodetic scheduling approach. From the 100 pre-selected sources, only a subset is scheduled in any given session. Due to the geodetic scheduling approach, there is some severe imbalance with respect to the distribution of scans among sources which is not ideal for deriving a CRF. To counter this situation a bit, a total of 26 sessions included a special “astrometric” scheduling option. This option when applied to a source increases its likelihood of being scheduled. Ten sources were treated this way in each session for a total of 19 unique sources over the 26 sessions. However, it is to be noted that this “astrometric” scheduling option does still not ensure that the listed sources are scheduled in the given session. Furthermore, many of the selected “astrometric” sources have already been observed extensively in previous VGOS sessions, such as 0059+581, 0119+115, 0133+476, 0235+164, 0336−019, and 0454−234, which are among the most-observed VGOS sources. Thus, this strategy only partly helps in extending the VGOS source list and cannot be considered an effective strategy to support the generation of a VGOS CRF. Finally, it is important to note that all of the potential sources observed within the operational VGOS sessions are from the initial IVS source list, which is only a subset of all sources that can be observed with VGOS.
The VGOS-R&D sessions were scheduled using the “VieSched++” scheduling software (Schartner & Böhm 2019). Among the various goals of this research and development program, one goal was to extend the list of observed VGOS sources, as discussed in Sect. 2. As shown in Fig. 2a, almost all sources were scheduled with a minimum of ten scans per session, allowing for a better determination of the source coordinates. Additionally, the scheduling strategy was adjusted several times to ensure a better distribution of scans among sources. Most importantly, a new source-based scheduling approach was developed and partly tested in VR2201 and VR2206 before it was further refined and fully utilized in VR2301 and VR2302. In essence, it aims to provide a more balanced distribution of scans among sources and time. The green histogram in the upper left plot in Fig. 2a shows that the majority of sources in VR2301 and VR2302 were scheduled with in between ten to 30 scans which already provides a good basis for a CRF determination, while the distribution is very inhomogeneous in the standard geodetic VGOS-OPS or VGOS-R&D sessions. The scheduling strategy works by first defining a target number of scans per source, followed by calculating the total up-time of each source based on the given network and a minimum number of stations per scan. Based on these metrics, the optimal repeat time between two scans to the same source is calculated. With this repeat time, the target number of scans can be reached while ensuring a good distribution of scans over time. A further benefit from distributing the scans equally over time is that this way, it also results in a good uv-coverage of the scheduled sources for increased imaging potential. Furthermore, it is likely that a good distribution of scans among sources and in time also improves the geodetic performance of the session since unmodelled systematic effects might be averaged out more equally. More detailed information on the scheduling mode can be found in Schartner et al. (2023).
Due to the imbalanced VGOS network geometry (see Sect. 4) and the complex nature of VLBI scheduling, it is not possible, nor required, to perfectly balance the distribution of scans among sources. Still, the described scheduling strategy used in VR2301 and VR2302 significantly improved the distribution: The 0.10, 0.25, 0.75, and 0.90 quantiles of scans per source are 12,15, 21, and 25 respectively, which is more balanced compared to the VGOS-OPS session with quantiles of 5, 10, 34 and 45, respectively, as discussed in Sect. 2. The green histogram in Fig. 2a further shows that the distribution is also improved compared to that from the eight VGOS-R&D* sessions (i.e., all available VGOS-R&D except VR2301 and VR2302) which include a high number of sources with more than 60 scans. Additionally, significantly more sources can be scheduled per session, which in turn calls for enlarging the pool of suitable sources for VGOS. Session VR2301 observed a total of 114 sources while session VR2302 observed 177 sources. On the other hand, the number is on average 77 for the VGOS-OPS sessions. The difference in the number of sources between VR2301 and VR2302 can be explained by other scheduling settings. While VR2301 followed the operational VGOS approach of observing each scan for 30 seconds, VR2302 utilized an observing time based on the signal-to-noise ratio, resulting in an increase in the average number of scans per station per hour from 35 (VR2301) to 60 (VR2302) which is reflected in the number of observed sources The histogram of the number of observations of the sources for the same three group of sessions (Fig. 2c) highlights the distribution of observations from VGOS-R&D* and from VR2301 and VR2302. There are no sources with fewer than 25 scheduled observations in the VR2301 and VR2302 sessions and very few in the VGOS-R&D* sessions. On the other hand, there is a high number of sources, which were scheduled for more than 800 observations in VGOS-R&D*. The right side plots in Fig. 2 give the discussed histograms for the good observations, which were obtained during the observing sessions and successfully processed with VLBI analysis software. These form the basis of the current VIE2023-VG CRF (Krásná 2024a)3.
In conclusion, based on the statistics displayed in Fig. 2, the scheduling strategy utilized in VR2301 and VR2302 is beneficial for generating a CRF since it allows the observation of more sources with a better distribution of scans among them.
4 Data and analysis settings
The VIE2023-VG CRF was computed from all 24-hour multi-baseline VGOS sessions introduced in Sects. 2 and 3. The first five sessions were observed in December 2017 and regular bi-weekly VGOS sessions started in January 2019. Our dataset ends in December 2023 which makes 155 VGOS sessions in total that are provided through the IVS. The VGOS telescope network used within these 155 sessions included a total of 13 stations, as depicted in Fig. 3.
Our analysis starts with the VLBI group delays, the fundamental observables of geodetic and global astrometric VLBI, which are retrieved after correlation, fringe fitting and preprocessing from IVS databases in vgosDB format (Gipson et al. 2014) via the IVS Data Centers. The analysis is done with Vienna VLBI and Satellite Software (VieVS; Böhm et al. 2018) following the standard a priori models and setup as described in Krásná et al. (2023). Table 1 lists the basic parameterization options chosen for the solution. The weighting of the individual measurements includes an elevation dependent term to account for tropospheric noise (Gipson et al. 2008) with a special treatment for station HOBART12 (Hb). In 2023, a spurious pattern appeared in Hb phase calibration signal (Lucia McCallum, personal communication) which makes the residuals for Hb baselines noisy. Since Hb is a crucial station in this dataset regarding observation of southern sources (cf. Fig. 3), we kept the Hb observations in the adjustment, but we down-weighted them with an additional variance of (5 cm)2 in order to avoid the propagation of the noise via datum definition to other baselines. The a priori positions of the antennas and radio sources were taken from ITRF2020 (Altamimi et al. 2023) and ICRF3-SX (Charlot et al. 2020), respectively. The new NYALE13N (Nn) telescope started its observations in 2022 meaning that its position is not included in ITRF2020. Therefore, we took its a priori coordinates from the recent VLBI terrestrial frame VIE2023 TRF (Krásná 2024c)4.
The datum definition of the global solution was done with no-net-translation (NNT) and no-net-rotation (NNR) condition with respect to the ITRF2020 positions of all included VLBI telescopes except for ISHIOKA (Is) and RAEGSMAR (Sa). The linear velocities of all telescopes were fixed to the a priori values and only the offset in position was estimated (see Fig. 4 for participation of the VGOS telescopes in the VIE2023-VG CRF solution sorted chronologically on the x-axis). The usual way of applying the celestial datum definition is the NNR condition which forces the sum of cross products between the corrections to the angular coordinates and the source positions components themselves over all included sources to be a zero vector (see Jacobs et al. 2010). The NNR condition was applied on 71 ICRF3 defining sources with more than 1000 observations in VIE2023-VG CRF. In addition, a constraint for a zero slope in declination estimates versus declination was applied. The reason is the lack of observations in the southern hemisphere for defining radio sources—only 22 datum sources are located in the southern hemisphere with four of them having declination lower than −20°.
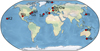 |
Fig. 3 Telescopes in the VGOS network: GGAO12M (Gs), HOBART12 (Hb), ISHIOKA (Is), KATH12M (Ke), KOKEE12M (K2), MACGO12M (Mg), NYALE13N (Nn), ONSA13NE (Oe), ONSA13SW (Ow), RAEGSMAR (Sa), RAEGYEB (Yj), WESTFORD (Wf), WETTZ13S (Ws). |
Parameterization of the VIE2023-VG CRF solution, based on piece-wise linear offsets (PWLOs).
Basic characteristics of VIE2023-VG CRF provided for different groups of sources.
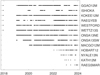 |
Fig. 4 Participating VGOS telescopes in the VIE2023-VG CRF solution per session. |
5 Characteristics of VIE2023-VG CRF
The estimated VIE2023-VG CRF is built with 1.39 · 106 observations collected after five years of regular observations of the VGOS network. The distribution of individual sources is depicted in Fig. 5 where the triangles represent ICRF3 defining sources. There are 418 radio sources in total, 19 of them with fewer than 10 observations, 93 sources with between 10 and 100 observations and the 37 most observed sources with more than 104 observations. The number of observations of southern sources is 9 · 104 which makes up only 6% of the total number of observations. Regarding the number of sessions, 141 sources were observed in one session only, and 31 sources in two sessions only. On the other hand, 91 sources were included in more than 50 sessions (see Fig. 1).
The raw formal errors, derived directly from the global adjustment, are depicted in Fig. 6. The median formal errors (Table 2) over all sources are 30 μas for α* (α* is right ascension scaled by the cosine of declination (δ) of the source, that is, α* = α · cos δ) and 47 μas for δ. Median formal errors for ICRF3 defining sources with more than 1000 observations in VIE2023-VG CRF (used for datum definition) are 7 μas for α* and 17 μas for δ. A careful investigation of the accuracy of estimated source positions from the VGOS sessions needs to be done in order to report realistic uncertainties instead of the raw formal errors and will be a topic for our follow-on research. Note that in the case of the ICRF3-SX, the raw formal errors were scaled by 1.5 and a noise floor of 30 μas was added in quadrature to each coordinate uncertainty (Charlot et al. 2020). The ratio of the semi-axes of the error ellipse for each source is depicted in the left panels in Fig. 7. Considering sources that were observed repeatedly (more than one thousand times), the ratio of semi-axes shows steady elongation starting with one for the northern declinations increasing to four for sources with zero declination. For poorly observed sources, the large ratio of error ellipse semi-axes shows that the uncertainty in one direction is more than five times worse compared to the uncertainty in the perpendicular direction. The right panels in Fig. 7 depict that the semi-major axes are mostly in the north-south directions (rotation about 90° counting from the east) with the median value 101.2° meaning that the estimates in declination are weaker than in right ascension. The way to improve the declination estimates of the sources in the south is to enlarge the VGOS observing network with more telescopes located in the southern latitudes. The addition of stations at Hartebeesthoek, South Africa, and La Plata in South America would be especially helpful (Hase & Pedreros 2014; Mayer et al. 2014; Gómez et al. 2024).
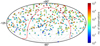 |
Fig. 5 Distribution of all sources with the number of observations in VIE2023-VG CRF color-coded (see color bar at right). Defining ICRF3 sources are depicted as triangles, non-defining as circles. |
Sources with a normalized angular separation Dn between VIE2023-VG CRF and ICRF3-SX larger than 15.
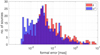 |
Fig. 6 Histogram of raw formal errors of source positions from the VIE2023-VG CRF solution. |
6 Comparison and evaluation
6.1 Comparison of VIE2023-VG CRF to ICRF3-SX
We carried out a comparison to the IAU-adopted CRF estimated from S/X observations, which is currently the ICRF3-SX. The ICRF3 was computed in 2018 with S/X observations collected from August 1979 until March 2018. The differences of estimated coordinates in VIE2023-VG CRF with respect to ICRF3-SX are shown in Fig. 8 where the colors represent the number of observations to each source in the analyzed VGOS dataset.
Different methods exist for outlier detection as was discussed by Lambert & Malkin (2023) or Malkin (2024), among others. They show that the several possible methods detect a similar group of radio sources. We compute the normalized angular separation Dn following Mignard et al. (2016) from normalized coordinate differences Xα*, Xδ:
![Mathematical equation: $\[X_{\alpha^{*}}=\frac{\Delta \alpha^{*}}{\sigma_{\Delta \alpha^{*}}}=\frac{\Delta \alpha^{*}}{\sqrt{\sigma_{\alpha^{*}, V G}^{2}+\sigma_{\alpha^{*}, S X}^{2}}},\]$](/articles/aa/full_html/2025/01/aa51996-24/aa51996-24-eq1.png) (1)
(1)
![Mathematical equation: $\[X_{\delta}=\frac{\Delta \delta}{\sigma_{\Delta \delta}}=\frac{\Delta \delta}{\sqrt{\sigma_{\delta, V G}^{2}+\sigma_{\delta, S X}^{2}}}\]$](/articles/aa/full_html/2025/01/aa51996-24/aa51996-24-eq2.png) (2)
(2)
and taking into account the correlation coefficient C of the combined formal errors σ reported in the CRF catalogs:
![Mathematical equation: $\[C=\frac{\sigma_{\alpha^{*}, V G} \cdot \sigma_{\delta, V G} \cdot C_{V G}+\sigma_{\alpha^{*}, S X} \cdot \sigma_{\delta, S X} \cdot C_{S X}}{\sqrt{\left(\sigma_{\alpha^{*}, V G}^{2}+\sigma_{\alpha^{*}, S X}^{2}\right)\left(\sigma_{\delta, V G}^{2}+\sigma_{\delta, S X}^{2}\right)}},\]$](/articles/aa/full_html/2025/01/aa51996-24/aa51996-24-eq3.png) (3)
(3)
as
![Mathematical equation: $\[D_n^2=\left[\begin{array}{ll}X_{\alpha^*} & X_\delta\end{array}\right]\left[\begin{array}{cc}1 & C \\C & 1\end{array}\right]^{-1}\left[\begin{array}{c}X_{\alpha^*} \\X_\delta\end{array}\right].\]$](/articles/aa/full_html/2025/01/aa51996-24/aa51996-24-eq4.png) (4)
(4)
We identified ten radio sources with Dn between VIE2023-VG CRF and ICRF3-SX greater than 15, and 85 radio sources with Dn greater than 5. The weighted root mean square (wrms) of Δα* and Δδ are 142 μas and 166 μas, respectively, computed over sources with Dn < 15, and 80 μas and 100 μas for sources with Dn < 5.
The ten radio sources with Dn > 15 are listed in Table 3. In the last two columns, we included the source structure index (SI; Fey & Charlot 1997) for X-band observations of the sources provided in the Bordeaux VLBI Image Database (BVID5, Collioud & Charlot 2019) and the date of the S/X session used for the image. We picked up the most recent X-band image provided in the BVID which had a proper resolution from long intercontinental baselines. All of these ten sources have the SI around 3 and 4, which indicates spatially extended sources. Five of them were observed in fewer than three VGOS sessions.
For the four most observed ones, 0119+115, 0229+131, 0355+508 (NRAO150), and 0642+449, we plotted the time series of their position estimates since 1990 from S/X sessions and available VGOS sessions with respect to their ICRF3-SX coordinates (Fig. 9). We plotted only estimates from sessions where the source has more than 20 good observations. In these single-session solutions, we estimated the coordinates of the respective sources without any constraints and we used the same parameterization for the S/X and VGOS sessions. The visual inspection reveals that the measured location of the radio sources is variable over time and this evolution follows a similar pattern from both S/X and VGOS sessions, although with different intensities. To characterize the scatter of the position estimates over the same time span, we computed the weighted standard deviation (wstd) and the weighted Allan deviation (wadev; Malkin 2008) of the estimates for both datasets from sessions since 2019 (Table 4). In addition, we inspected the available images of the sources. The X-band image of 0119+115 shows a sub-structure in the north-south direction which projects into the declination estimates of the source. The wstd of Δδ (560 μas for S/X data, and 757 μas for VGOS) is a factor of two higher than for the respective Δα* estimates. Images of 0229+131 and 0642+449 reveal a sub-structure in the east-west direction which propagates into the α* estimates. The declination estimates of 0229+131 from VGOS are rather effected by some outlier sessions (Fig. 9).
In addition, we computed the difference between the mean source coordinates from S/X and VGOS single-session estimates weighted by their formal errors from 2019.0 to 2024.0. By excluding the S/X sessions before 2019.0 we ruled out the variations in position estimates that the radio sources exhibited before the beginning of VGOS measurements, but which—of course—influenced the ICRF3-SX positions. Indeed, we see that the removal of data prior to 2019.0 reduces the estimated position offset between the S/X and VGOS data by several tens of percent for the discussed outlier sources 0119+115, 0229+131, and 0642+449 in Δα* of 55%, 34%, 43%, and in Δδ of 95%, 65%, and 58% for the respective three sources.
Source NRAO150 is special due to its location in the Galactic plane (Galactic latitude = −1.6°) where the interstellar medium of our Galaxy is broadening the signal at the discussed radio frequencies which has the consequence that most of its flux gets resolved out on very long baselines. Therefore, there are observations from short baselines only which causes the large scatter with large uncertainties of the NRAO150 position estimates in both coordinates over the entire observation history. Therefore, when we compared the coordinate difference between VIE2023-VG CRF and ICRF3-SX versus the weighted mean difference from 2019.0 to 2024.0 we got similar values: −43 μas versus −50 μas for Δα*, and −688 μas versus −648 μas for Δδ. This suggests that the main error part for NRAO150—the interstellar medium scattering—does not change over time.
Weighted standard deviation (wstd, Cols. 2–5) and weighted Allan deviation (wadev, Cols. 6–9) of position estimates in α* and δ, with the difference of weighted mean (Δw.mean, VGOS minus SX sessions) in α* and δ (Cols. 10–11).
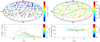 |
Fig. 7 Characteristics of error ellipses in VIE2023-VG CRF. The panels on the left depict the ratio of semi-major to semi-minor axes for all sources. In the panels on the right the direction of the semi-major axes is shown, counting counterclockwise from the east. The lower panels show the error ellipse characteristics with respect to declination of the sources with a color-coded number of observations. |
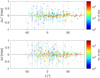 |
Fig. 8 Differences in VIE2023-VG CRF source position with respect to ICRF3-SX with color-coded number of observations in VIE2023-VG CRF. The wrms of Δα* and Δδ are 80 μas and 100 μas, respectively, computed over sources with normalized angular separation lower than 5. |
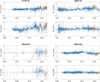 |
Fig. 9 Session-wise position of sources 0119+115, 0229+131, 0355+508 (NRAO150), and 0642+449 with respect to ICRF3-SX from S/X sessions (blue points) and from VGOS sessions (orange points) with more than 20 good observations of the given source in the session. The error bars are formal errors from the single-session solutions. |
Vector spherical harmonics
After excluding the ten outlier sources from the dataset (Dn > 15), we computed for the remaining 408 common sources the vector spherical harmonics (VSH; Mignard & Klioner 2012) up to degree and order two (i.e., 16 parameters) to examine possible systematic differences with respect to ICRF3-SX (Table 5, Col. 2). The largest systematic effect reaches 61 μas. There are three parameters with absolute values around 60 μas: R1 = +56 ± 16 μas, D2 = −61 ± 16 μas, ![Mathematical equation: $\[a_{2,1}^{e, R e}\]$](/articles/aa/full_html/2025/01/aa51996-24/aa51996-24-eq5.png) = −59 ± 16 μas. If we compare the VIE2023-VG CRF to the VIE2023sx which includes VLBI sessions until 2024.0, the VSH are reduced only marginally (the largest absolute value of the VSH is
= −59 ± 16 μas. If we compare the VIE2023-VG CRF to the VIE2023sx which includes VLBI sessions until 2024.0, the VSH are reduced only marginally (the largest absolute value of the VSH is ![Mathematical equation: $\[a_{2,1}^{e, R e}\]$](/articles/aa/full_html/2025/01/aa51996-24/aa51996-24-eq6.png) = −54 ± 15 μas). We note that there are correlations between the solved 16 VSH. Solving for just three rotations between VIE2023-VG CRF and ICRF3-SX (including the 408 sources with Dn < 15), one gets following values: R1 = −8 ± 10 μas, R2 = +12 ± 10 μas, R3 = −16 ± 8 μas. If we lower the limit for outlier detection to Dn > 5, the largest absolute values of the 16 VSH with respect to both, ICRF3-SX (333 radio sources) and VIE2023sx (327 radio sources), are below 30 μas suggesting that the VSH distortion are due at least in part to source structure in the outlier sources.
= −54 ± 15 μas). We note that there are correlations between the solved 16 VSH. Solving for just three rotations between VIE2023-VG CRF and ICRF3-SX (including the 408 sources with Dn < 15), one gets following values: R1 = −8 ± 10 μas, R2 = +12 ± 10 μas, R3 = −16 ± 8 μas. If we lower the limit for outlier detection to Dn > 5, the largest absolute values of the 16 VSH with respect to both, ICRF3-SX (333 radio sources) and VIE2023sx (327 radio sources), are below 30 μas suggesting that the VSH distortion are due at least in part to source structure in the outlier sources.
VSH parameters up to degree and order two for VIE2023-VG CRF with respect to ICRF3-SX and VIE2023sx.
6.2 Assessment of the estimation of path delays in the neutral atmosphere in VGOS CRF solutions
One of the currently discussed topics in the geodetic analysis of the VGOS sessions is the optimal interval for estimation of the tropospheric parameters since the troposphere is one of the dominant error sources which influence the VLBI measurements. As an example, let us assume a typical wind speed of 10 m s−1 and an elevation of 6°. Then the time for a wet troposphere at a height of 1–2 km to be carried over the site from zenith to the horizon is the time to travel 10–20 km (i.e., troposphere height divided by the sine of elevation) which equals to 16–32 minutes. The VGOS-OPS have observed typically around 40 scans per hour, whereas the scheduling approach of VGOS-R&D led to a 2.3-fold increase in the number of scheduled scans per station in 2022 (Schartner et al. 2024). The high cadence of observations during a VGOS session enables estimation of the wet delay in the zenith direction (zwd) and of the horizontal tropospheric gradients in dense intervals. The horizontal gradients describe the deviation from the azimuthal symmetry of the troposphere and we took the mean site gradients computed from Data Assimilation Office (DAO; MacMillan & Ma 1997) as a priori values.
In our default solution VIE2023-VG CRF we estimated the zwd each 30 min and tropospheric gradients every 3 hours. The parameterization was done with piece-wise linear offsets with relative constraints of 15 mm and 0.5 mm between the consecutive zwd and gradient estimates, respectively. To examine the impact of shorter estimation intervals of zwd and gradients on the CRF, we ran the following four test solutions: first, we reduced the zwd estimation interval to 10 min and set the gradient estimation interval in the following three solutions zwd10gr180, zwd10gr60, and zwd10gr20 to 180 min, 60 min, and 20 min, respectively. Finally, we computed a solution zwd05gr10 with 5 min zwd interval and 10 min gradient intervals. As an example, we show zwd estimates (Fig. 10) at antennas Hb and Wf during the VGOS-R&D session VR2302.
We characterize the difference between the zwd estimates from the four solutions with respect to VIE2023-VG CRF (i.e., zwd30gr180) with the mean difference and the rms (Fig. 11). The statistics were computed from all VGOS sessions and the zwd values were interpolated to the five-minute intervals that correspond to the solution zwd05gr10. The mean difference of the zwd estimates at all telescopes is less than 0.5 mm, except for Hb and Ke. For Ke the largest mean difference in the zwd is 3 mm between solutions zwd05gr10 and zwd30gr180. For Ke there were a limited number of sessions for the statistics since it participated in only five VGOS sessions (Fig. 4). Ke and Hb are the only stations in the southern hemisphere, meaning that the mutual observations with telescopes in the northern hemisphere do not allow uniform sky coverage, which limits their capability to estimate the tropospheric parameters.
The rms values of zwd differences (Fig. 11, lower panel) from solutions with zwd interval 10 min with respect to zwd30gr180 are between 3–4 mm at the majority of stations. The variation of gradient intervals does not affect the rms for zwd significantly. The rms of zwd differences for a solution with short zwd intervals of 5 min with respect to the default solution is about 1 mm larger than from the other solutions. The exceptions are again telescopes Hb and Ke, where the rms with respect to default are twice to three times larger than at other stations. We also examined the horizontal gradients from these four solutions comparing them to zwd30gr180 where the statistics show that differences in the mean and rms at all stations are below 1 mm.
Focusing on the estimated CRFs in these solutions, the differences in source positions as a function of declination from the four test solutions with respect to the default zwd30gr180 are plotted in Fig. 12 and the corresponding formal errors from the four solutions with respect to the formal errors of the default CRF in Fig. 13. In both figures only sources with more than 25 observations are plotted (cf. Fig. 2). In Table 6 we summarize the mean of the formal error differences with respect to solution zwd30gr180 individually for three groups of sources dependent on their declination, with the empirical declination limits −30° and +20°. The larger position scatter between the CRFs is observed for sources in the southern hemisphere up to δ about +20° (Fig. 12, lower panel). The negative values of differences in formal errors (Fig. 13) in the declination range approximately between −30° and +20° show that for most of the sources especially the declination estimates have lower formal errors in the test solutions with shorter estimation intervals of the zwd than in the default solution (e.g., the mean difference between declination formal errors for zwd05gr10 with respect to zwd30gr180 is −14 μas; see Table 6). This can be explained by the fact that these sources were observed at lower elevation angles by the north antennas. The more frequent zwd estimates at the antennas with good sky coverage allow one to estimate the declination component of the “low elevation sources” with a formal error lower by several tens of microarcseconds for several sources. For the northern sources (δ > +20°) there is no such improvement in the declination formal errors (mean difference is −4 μas between zwd05gr10 and zwd30gr180), suggesting that the more frequent zwd estimates have no significant effect on the estimated position of sources observed at high elevation angles. On the other hand, for the majority of southern sources with declination lower than −30° their formal errors of the position estimates are higher in the solution zwd05gr10 (5 μas difference for both coordinates). The position of these sources is sensitive to the zwd estimates at stations Hb and Ke which lack sufficient sky coverage for frequent zwd and horizontal gradient estimates.
In Table 7, we summarize the statistics on the source coordinate estimates (mean and rms) for the four solutions with respect to zwd30gr180. Here we computed the mean and rms for three subgroups of sources depending on the minimal number of observations in the CRF (50, 25, and 2). In contrast to the pure mean and rms which differ in dependence on the sources in the group, the weighted mean and weighted rms are independent of the selection of sources. There is no significant bias (not higher than 10 μas) between the four solutions and zwd30gr180, if computed for sources with a minimum of 25 observations. If also sources with 2–25 observations are included in the statistics, the mean difference in declination between zwd05gr10 and zwd30gr180 is 38 μas. It is important to consider that sources with a limited number of observations are in general sensitive to the parameterization options (such as the interval for the zwd and gradient estimation) during a CRF estimation. This is of importance especially when fixing the coordinates of the radio sources to a given CRF in the VLBI analysis.
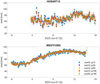 |
Fig. 10 Time series of estimated zenith wet delays at stations Hb (upper plot) and Wf (lower plot) in session VR2302. Five different solutions were computed with varying estimation intervals for zwd and tropospheric gradients (interval lengths are given in the legend in minutes). |
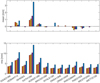 |
Fig. 11 Mean and rms for the differences in the zwd time series with respect to default solution zwd30grd180 at individual stations from all VGOS sessions. The legend for the four solutions is given in Fig. 10. |
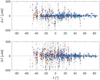 |
Fig. 12 Differences in α* and δ for four test CRFs with varied estimation intervals for zwd and tropospheric gradients with respect to default VIE2023-VG CRF (zwd30gr180). Only sources with more than 25 observations are plotted. The legend for the four solutions is given in Fig. 13. |
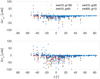 |
Fig. 13 Differences in formal errors of α* and δ for four test CRFs with varied estimation intervals for zwd and tropospheric gradients with respect to default VIE2023-VG CRF (zwd30gr180). Only sources with more than 25 observations are plotted. |
Mean difference between formal errors in right ascension and declination estimates for the four CRF solutions with respect to zwd30gr180.
Statistics for difference in Δα* and Δδ for four CRF solutions with respect to VIE2023-VG CRF (i.e., zwd30gr180).
6.3 Evaluation of VIE2023-VG CRF in geodetic analysis
The standard procedure for the estimation of all five EOP and antenna positions in the operational geodetic VLBI analysis is to fix the source positions to their a priori coordinates given in the CRF catalog. Up to now, a priori catalogs estimated from S/X measurements, such as ICRF3-SX, have been taken as standard in the analysis of VGOS sessions within the IVS. Recently, Diamantidis & Haas (2023) investigated whether the EOP repeatabilities are related to the CRF definition. They constructed a VGOS-adjusted ICRF3-SX catalog from a weighted mean of source estimates which they obtained by favoring source coordinate over EOP corrections in a Kalman filter on a session-wise basis, and evaluated it in terms of EOP and station positions. Their results show an improvement in station position and baseline length repeatabilities in both on the level of 0.3–0.5 mm for all but the east component, and they obtain a lower wrms of the EOP estimates by approximately 50–60%.
We analyzed the full set of VGOS-OPS and VGOS-R&D sessions until 2024.0 with the standard parameterization (Table 1) and created two groups of session-wise solutions: S1 with source coordinates fixed to ICRF3-SX, and S2 with source coordinates fixed to VIE2023-VG CRF. The a priori station positions were ITRF2020 (Nn is the exception) and the NNT/NNR condition was imposed session-wise with respect to all ITRF2020 stations to follow the current standard way of VGOS analysis (Table 8). Additionally, two other solutions (S3 and S4) with updated a priori station positions from VIE2023 TRF and applied NNT/NNR with respect to VIE2023 TRF on all stations were created.
Differences between single-session solutions S1–S4.
6.3.1 Comparison of ITRF2020 and VIE2023 TRF for VGOS telescopes
VIE2023 TRF is a terrestrial reference frame computed from S/X and VGOS sessions until 2024.0 which comes from an updated global solution described in Krásná et al. (2023). Therefore, it includes three additional years of VLBI data compared to ITRF2020, which is crucial for determining the positions and velocities of new VGOS antennas.
In Fig. 14, we compare VIE2023 TRF with respect to ITRF2020 for the VGOS antennas in terms of the difference in the position offset for the common reference epoch 2015.0 (upper panel) and the difference in the linear velocity (lower panel) in the local coordinate systems: height (h), east (e), north (n). We also depict the reported TRF uncertainties as error bars separately for VIE2023 TRF (in red) and ITRF2020 (in black). The importance of the updated TRF especially for the new VGOS telescopes like Sa (three sessions in ITRF2020) and Mg (seven sessions in ITRF2020) is already discussed in Krásná et al. (2023). The values for the Sa telescope exceed the y-axis limits in Fig. 14 but they are summarized with all other VGOS telescopes in Table 9.
The weighted mean differences in the position offset at epoch 2015.0 computed over the plotted VGOS telescopes are 2.1 mm, 0.6 mm, −3.5 mm for the h, e, n components, respectively, and the mean differences for the linear velocity are 0.15 mm/yr, 0.02 mm/yr, −0.12 mm/yr. The systematic positive difference between the estimated heights in VIE2023 TRF with respect to ITRF2020 confirms the known discrepancy between the VLBI TRF and ITRF2020 scale (Altamimi et al. 2023; Krásná et al. 2023). The systematic negative trend observed for the northern component of the station position differences is likely to be related to differences in the assumed declination of the radio sources (fixing source positions to ICRF3-SX in the IVS contribution to ITRF2020 (Hellmers et al. 2022) versus estimated source positions in the VIE2023 global solution). However, this discrepancy needs further investigation.
Comparison of VIE2023 TRF and ITRF2020 for the VGOS telescopes.
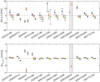 |
Fig. 14 Differences between VIE2023 TRF with respect to ITRF2020 for the VGOS telescopes. The position offset for the reference epoch 2015.0 (upper panel) and the difference in the linear velocity (lower panel) are shown for the height component as blue dots, for the east component as orange dots, and for the north component as green dots. The VIE2023 TRF uncertainties are plotted as red error bars, and the ITRF2020 uncertainties as black error bars. The differences at Sa exceed the y-axis limits (see Table 9 for the exact values). |
6.3.2 Baseline length and station position
Figure 15 depicts the baseline length repeatability (computed as wrms of estimated baseline length from all VGOS sessions) from solutions S1 and S2 (upper panel), and the difference in wrms computed as S1 minus S2 in the two lower panels. We show only baselines that were observed in more than ten sessions. As the length of the baselines gets larger, the improvement in the wrms for individual baselines in solution S2 over S1 increases. This change is described with a fitted linear regression line as Δwrms = 0.14 · L − 0.42 (mm) with L being the length of a baseline in megameters. The largest improvement of 2.7 mm is seen for the baseline Hb-Wf (12 350 km). The mean improvement computed over extremely long baselines only (i.e., longer than 12 000 km) is 1.9 mm. In this VGOS dataset, all baselines longer than 11 000 km scheduled in more than five sessions include Hb and due to the geometry, all those common observations are conducted at very low elevation angles. In general, the number of observations for those extremely long baselines is lower than for the others (see color-codes in the middle plot of Fig. 15). The number of baseline length determinations in our current dataset is depicted in the lower plot of Fig. 15. Other possible causes for the increasing difference in baseline length wrms with increasing baseline length, such as the larger projection of the frequency-dependent offset between the ICRF3-SX and VIE2023-VG CRF positions on the long baselines, require further investigation. In addition to the baseline length scatter represented by the wrms, we computed the weighted mean between the absolute baseline length time series differences from solution S1 with respect to S2 (Fig. 16). For most of the baselines the absolute value of the weighted mean of the baseline length differences is lower than 1 mm. Nevertheless, the weighted mean offsets for long baselines especially with Hb reach up to 2.4 mm.
In addition to the baseline length, we present the impact of the two fixed CRFs on the station position time series. The wrms for each of the three components of the local coordinate system h, e, n are shown for each telescope in Figs. 17–19. In addition to the comparison of the already discussed solutions S1 (blue circles) and S2 (orange x-signs), we computed the wrms from solutions S3 (yellow circles) and S4 (green x-signs), where the only difference is in the a priori TRF. Instead of ITRF2020, we took VIE2023 TRF as a priori TRF in solutions S3 and S4. With VIE2023 TRF a priori, the wrms in height is below 20 mm for all antennas, while that in the horizontal plane is below 10 mm for all antennas. The differences in wrms between the solutions S1 and S2 (black dots) and between S3 and S4 (red diamonds) are depicted in the lower plots of Figs. 17–19. For the height component, there is an improvement in wrms at all stations from fixing to the VIE2023-VG CRF instead of fixing to the ICRF3-SX. The mean value of Δwrms is 0.7 mm for the height regardless of the a priori terrestrial frame. The Δwrms for the east component are in the range from −0.5 to 1.5 mm, with the mean value 0.1 mm. For the north component, there is, similar to the height, an improvement in the wrms at all stations by fixing to the VIE2023-VG CRF. The mean difference is 0.2 mm for ITRF2020 a priori, and 0.3 mm for VIE2023 TRF a priori. We assume that the slightly higher sensitivity to fixing the CRF on the north component than on the east component of station positions is due to the mapping of uncertainties in declination estimates from individual sources into the north component (i.e., latitude) of the stations.
As an example of station position estimate time series from which the wrms in Figs. 17–19 were computed, we select station Sa (Fig. 20). It participated in seven VGOS sessions till 2024.0 (cf. Fig. 4) and it is the station with largest difference between the reported linear velocity in ITRF2020 and VIE2023 TRF among all VGOS telescopes. The session-wise position estimates in Fig. 20 are plotted with respect to the a priori TRF used in the respective solutions, that is with respect to ITRF2020 in S1–S2 and with respect to VIE2023 TRF in S3–S4. The differences between the a priori catalog position of Sa telescope in mid 2023 based on VIE2023 TRF with respect to ITRF2020 are 43 mm, −5 mm, 36 mm in the local h, e, n coordinate components. The respective mean differences between the S1 and S3 position estimates are 26.7 mm, 0.0 mm, 20.5 mm (the same values for the mean differences are obtained between the S2 and S4 estimates). The mean estimates with respect to the a priori catalogs are lower than the difference of the a priori positions themselves which is caused by the inclusion of the Sa station in the NNT/NNR condition.
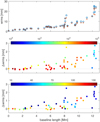 |
Fig. 15 Baseline length repeatability (upper panel) from all VGOS sessions in solution S1 (blue circles) and in solution S2 (orange x-signs). The lower plots show the difference in wrms computed as S1 minus S2 with the total number of observations (middle panel) and with the number of baseline length determinations (bottom panel) color-coded for each baseline. Only baselines included in more than ten sessions are shown. |
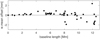 |
Fig. 16 Weighted mean of differences (S1 minus S2) between the absolute baseline length time series obtained from VGOS sessions. Only baselines observed in more than ten sessions are shown. |
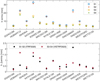 |
Fig. 17 Wrms of the height position time series from all VGOS sessions in solution S1 (ICRF3, ITRF2020) and in solution S2 (VIE2023-VG CRF, ITRF2020). In addition, wrms from solutions with VIE2023 TRF a priori are shown: S3 (ICRF3, VIE2023 TRF) and S4 (VIE2023-VG CRF, VIE2023 TRF). The lower plot depicts the difference in wrms computed as solutions with fixed ICRF3 minus solutions with fixed VIE2023-VG CRF. |
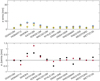 |
Fig. 18 Wrms of the east component of station position time series from all VGOS sessions (see Fig. 17 for description). |
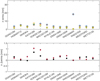 |
Fig. 19 Wrms of the north component of station position time series from all VGOS sessions (see Fig. 17 for description). |
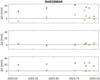 |
Fig. 20 Position estimate time series for station Sa from solutions S1–S4 with respect to a priori TRFs (see Fig. 17 for legend). |
6.3.3 Earth orientation parameters
From the solutions S1 and S2, we evaluated the impact of the fixed source positions on EOP. The Earth rotation parameters (polar motion (xp, yp) and UT1-UTC) are estimated as piecewise linear offsets for 0 UTC before the start, inside and after the end of each 24 h session with a relative constraint of 1 mas between the estimates. The nutation is estimated as celestial pole offsets (dX, dY) in the middle of the sessions.
Figure 21 summarizes statistics for all five EOP computed jointly for the VGOS-OPS and VGOS-R&D sessions from S1 (blue) and S2 (orange) solutions. The statistics are given in terms of a median value with respect to the IERS EOP combined series 20C046. The height of the box represents the lower and upper quartiles and the bar length depicts the minimum and maximum values not being outliers. The outliers are here defined as values more than 1.5 times of the interquartile range away from the top or bottom of the box. In terms of wrms with respect to IERS 20C04, lower values are obtained in solution S2 with fixed VIE2023-VG CRF for all five EOP. Namely, the wrms computed for detrended time series of xp, yp, UT1-UTC, dX, and dY from solutions S1/S2 are 329/293 μas, 263/237 μas, 14/13 μs, 105/97 μas, and 123/105 μas, respectively (Table 10). This makes an improvement of the wrms in S2 compared to S1 of about 10% for the first four EOP and of about 15% for dY.
The median of the absolute deviation for celestial pole offsets is 70–80 μas for both S1 and S2 with respect to IERS 20C04 with the exception of the dY between S1 and IERS 20C04. In Fig. 22, we plot the time series of dX and dY from S1 (blue) and S2 (orange) with respect to the IERS 20C04 celestial pole offsets. For clarity we highlight the ten estimates coming from the VGOS-R&D sessions with black edges. It shows that there is a trend in the dY estimated from S1 before the year 2021, where dY from the solution with fixed VIE2023-VG CRF are closer to IERS 20C04 (weighted mean: 84/3 μas, wrms: 175/116 μas, trend: −48/21 μas/yr computed from S1/S2 time series until 2021). The reason for this systematic difference, which disappears after 2021, is unclear to us at this time.
The statistics computed for the ten VGOS-R&D sessions only, reveals wrms for the five EOP (xp, yp, UT1-UTC, dX, and dY) from solutions S1/S2 with respect to IERS 20C04: 139/120 μas, 109/128 μas, 11/10 μs, 40/56 μas, and 86/60 μas. Hence, one sees even from this limited dataset of ten sessions and regardless of the different scheduling techniques used in these sessions that there is an improvement of the geodetic performance of the VGOS-R&D compared with VGOS-OPS measured by the wrms of the detrended EOP series.
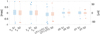 |
Fig. 21 Visualization of all five EOP time series from VGOS sessions with respect to IERS 20C04 for solution S1 with fixed ICRF3-SX (in blue) and solution S2 with fixed VIE2023-VG CRF (in orange). The box charts display the median with the lower and upper quartiles. The bar length depicts the minimum and maximum values of the time series that are not outliers. The outliers are shown as dots. |
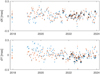 |
Fig. 22 Nutation time series (dX, dY) with respect to IERS 20C04 from solution S1 (blue, fixed ICRF3-SX) and S2 (orange, fixed VIE2023-VG CRF). The estimates from VGOS-R&D are plotted as larger circles with black edges. |
Statistics on EOP estimated from 155 VGOS sessions with respect to IERS 20C04. Values are provided for solution S1 (ICRF3-SX) and S2 (VIE2023-VG CRF).
7 Conclusions
In this paper, we introduced the VIE2023-VG CRF comprised of positions of 418 radio sources computed from 1.39 · 106 broadband group delays, available at https://doi.org/10.48436/m6j36-s1082 (Krásná 2024a). In the global solution, we analyzed 145 VGOS-OPS and ten VGOS-R&D sessions until December 2023. Our conclusions are as follows:
The VIE2023-VG CRF has excellent source position precision. The median precision is 30 μas in α* and 47 μas in δ computed over all 418 radio sources (formal errors directly from the least-squares adjustment).
The ten VGOS-R&D sessions play a significant role in extending the VGOS source list. Several adjustments of the new source-centric scheduling strategy enabled the addition of 172 radio sources from only four VGOS-R&D sessions with the potential to expand the number of sources even further. The source-centric scheduling strategy (Schartner et al. 2023), fully utilized in VR2301 and VR2302, is beneficial for generating a CRF since it allows one to observe more sources with a better distribution of scans among them within a 24-hour session.
The systematic distortions of VIE2023-VG CRF versus ICRF3-SX for the common 408 radio sources (ten outliers eliminated) in terms of the VSH up to the degree and order two, reach in absolute values about 60 μas for R1, D2, and
![Mathematical equation: $\[a_{2,1}^{e, R e}\]$](/articles/aa/full_html/2025/01/aa51996-24/aa51996-24-eq17.png) . We note that removing 85 outliers (Dn > 5) reduces the VHS distortions by about a factor of two, suggesting that source structure in these outlier sources might be a significant contributor to distortions in the current VGOS network.
. We note that removing 85 outliers (Dn > 5) reduces the VHS distortions by about a factor of two, suggesting that source structure in these outlier sources might be a significant contributor to distortions in the current VGOS network.In VIE2023-VG CRF in addition to the NNR condition, we stabilized the solution by constraining the slope in declination estimates versus declination to agree with ICRF3-SX. This was necessary because of the lack of good observations from the southern hemisphere in this dataset. Therefore, in order to limit VSH distortions in the CRF by the VGOS data itself, new southern stations will need to be added to the network, and the existing southern stations maintained. We especially commend the efforts at Hartebeesthoek, South Africa, and La Plata, Argentina, to join the VGOS network and hope they will be part of the network soon.
-
We identified ten radio sources as outliers with a normalized angular separation Dn with respect to ICRF3-SX greater than 15. We provided a detailed examination of the position time series of the four sources with the largest normalized angular separation with respect to ICRF3-SX: 0119+115, 0229+131, 0355+508 (NRAO150), and 0642+449. By lowering the limit of Dn to 5, the number of outliers becomes 85.
Recently, a study done by Petrov (2024) concluded that frequency-dependent source position errors do not exceed 70 μas and that the development of frequency-dependent reference frames of the entire sky is therefore not warranted for applications requiring accuracy at crude levels.
We show that the removal of S/X data prior to 2019.0 reduces the offset between the position from the S/X and VGOS data by several tens of percent for the discussed outlier sources (Tables 3 and 4). Common adjustment of all S/X and VGOS sessions would unnecessarily degrade the accuracy of the source position that is achieved with VGOS-only adjustment, especially for sources with observed variable positions over time as shown in Sect. 6.1. Therefore, we do not recommend computing a single CRF from all available VLBI sessions observed at different radio frequencies for applications requiring the highest accuracy. Our conclusion is supported by evaluating VIE2023-VG CRF in the geodetic analysis of VGOS sessions.
We show that fixing to the VIE2023-VG CRF instead of the ICRF3-SX a priori in the single-session analysis improves the wrms of the baseline length up to 3 mm, especially for the extremely long baselines (>12 000 km). An improvement larger than 1 mm is achieved on the majority of baselines longer than 8000 km. Additionally, a difference up to 2 mm in terms of a weighted mean between the estimated baseline length time series in these two solutions is obtained for several long baselines. This difference in the baseline length offset and repeatability is essential for meeting the strategic goals of 1 mm station position accuracy and 0.1 mm/yr velocity stability set by the GGOS of the IAG.
In this paper we also studied the estimation of the path delay in the neutral atmosphere. In the VIE2023-VG CRF we estimated zenith wet delay every 30 min and horizontal gradients every three hours. We show that in the current VGOS network, higher estimation rates for zwd (10 or 5 min) lower the mean formal errors for δ estimates for sources with declinations between approximately −30° and 20° by about 12 μas. On the other hand, there is an increase in the position formal errors for southern sources with declination lower than approximately −30° caused by the poor sky coverage of the isolated southern telescopes. Therefore, to tap the full potential of the VGOS also for the southern telescopes, construction of new VGOS telescopes serving as observing partners in the southern hemisphere is of the utmost importance.
In the EOP study, we concentrated on the effect of fixing VIE2023-VG CRF instead of ICRF3-SX a priori on the estimated EOP. Our results show that the fixed VIE2023-VG CRF instead of the fixed ICRF3-SX lowers the wrms of all five EOP with respect to IERS 20C04 of about 10–15%. Furthermore, the statistics reveal that the wrms computed over VGOS-OPS (145 sessions) versus VGOS-R&D (ten sessions) is considerably lower for the VGOS-R&D sessions, although caution is advised due to the limited number of VGOS-R&D sessions. The discussed wrms values by fixed VIE2023-VG CRF are 293 versus 120 μas for x-pole, 237 versus 128 μas for y-pole, 13 versus 10 μs for UT1-UTC, 97 versus 56 μas for dX, and 105 versus 60 μas for dY. Based on this evidence of superior geodetic performance of the VGOS-R&D sessions, we strongly support making the source-centric mode the nominal default scheduling strategy for VGOS sessions.
Acknowledgements
The authors thank Zinovy Malkin, the referee, for his comments and suggestions which helped to improve the manuscript. The authors acknowledge the International VLBI Service for Geodesy and Astrometry (IVS) and all its components for providing VLBI data. HK and PC acknowledge the Austrian Science Fund (FWF) [10.55776/P35920]. The research was carried out in part at the Jet Propulsion Laboratory, California Institute of Technology, under a contract with the National Aeronautics and Space Administration (80NM0018D0004). Copyright 2024. All rights reserved.
References
- Altamimi, Z., Rebischung, P., Collilieux, X., Métivier, L., & Chanard, K. 2023, J. Geod., 97 [Google Scholar]
- Blewitt, G., Altamimi, Z., Davis, J., et al. 2010, Geodetic Observations and Global Reference Frame Contributions to Understanding Sea-Level Rise and Variability (John Wiley and Sons, Ltd), 256 [CrossRef] [Google Scholar]
- Böhm, J., Böhm, S., Boisits, J., et al. 2018, PASP, 130, 044503 [CrossRef] [Google Scholar]
- Cappallo, R. 2014, in IVS GM Proceedings, eds. D. Behrend, K. D. Baver, & K. L. Armstrong (Beijing: Science Press), 91 [Google Scholar]
- Charlot, P., Jacobs, C. S., Gordon, D., et al. 2020, A&A, 644, A159 [EDP Sciences] [Google Scholar]
- Collioud, A., & Charlot, P. 2019, in Proceedings of the 24th European VLBI Group for Geodesy and Astrometry Working Meeting, eds. R. Haas, S. Garcia-Espada, & J. A. López-Fernández, 219 [Google Scholar]
- Diamantidis, P.-K., & Haas, R. 2023, Earth Planets Space, 75, 1 [CrossRef] [Google Scholar]
- Fey, A. L., & Charlot, P. 1997, ApJS, 111, 95 [Google Scholar]
- Gipson, J. 2010, in IVS GM Proceedings, eds. D. Behrend & K. Baver (NASA), 77 [Google Scholar]
- Gipson, J., MacMillan, D., & Petrov, L. 2008, in IVS GM Proceedings, eds. A. Finkelstein, & D. Behrend, 157 [Google Scholar]
- Gipson, J., Böhm, J., Bolotin, S., et al. 2014, in IVS Annual Report 2013, ed. K. D. Baver, D. Behrend, & K. L. Armstrong (NASA), 11–25 [Google Scholar]
- Gómez, M. E., Fernández, L. I., & Hase, H. 2024, J. Geod., 98, 87 [CrossRef] [Google Scholar]
- Hase, H., & Pedreros, F. 2014, J. Geod., 88, 989 [NASA ADS] [CrossRef] [Google Scholar]
- Hellmers, H., Modiri, S., Bachmann, S., et al. 2022, in IAG Symposia (Springer Berlin Heidelberg), 1 [Google Scholar]
- Jacobs, C., Heflin, M., Lanyi, G., Sovers, O., & Steppe, J. 2010, in IVS GM Proceedings, eds. D. Behrend, & K. D. Baver (NASA), 305 [Google Scholar]
- Krásná, H. 2024a, Celestial reference frame 2023 from VGOS sessions, (1.0.0) [Data set], TU Wien, https://doi.org/10.48436/m6j36-s1082 [Google Scholar]
- Krásná, H. 2024b, Global Reference Frame VLBI solution VIE2023 from S/X-band, (1.0.0) [Data set], TU Wien, https://doi.org/10.48436/yt390-wfm94 [Google Scholar]
- Krásná, H. 2024c, Global Reference Frame VLBI solution VIE2023 (SX&VG), (1.0.0) [Data set], TU Wien, https://doi.org/10.48436/76404-a3492 [Google Scholar]
- Krásná, H., Baldreich, L., Böhm, J., et al. 2023, A&A, 679, A53 [NASA ADS] [CrossRef] [EDP Sciences] [Google Scholar]
- Lambert, S., & Malkin, Z. 2023, A&A, 669, A138 [NASA ADS] [CrossRef] [EDP Sciences] [Google Scholar]
- MacMillan, D. S., & Ma, C. 1997, Geophys. Res. Lett., 24, 453 [NASA ADS] [CrossRef] [Google Scholar]
- Malkin, Z. 2008, J. Geod., 82, 325 [NASA ADS] [CrossRef] [Google Scholar]
- Malkin, Z. 2024, AJ, 167, 229 [NASA ADS] [CrossRef] [Google Scholar]
- Mayer, D., Böhm, J., Combrinck, L., Botai, J., & Böhm, S. 2014, Acta Geod. Geophys., 49, 313 [NASA ADS] [CrossRef] [Google Scholar]
- Mignard, F., & Klioner, S. 2012, A&A, 547, A59 [NASA ADS] [CrossRef] [EDP Sciences] [Google Scholar]
- Mignard, F., Klioner, S., Lindegren, L., et al. 2016, A&A, 595, A5 [NASA ADS] [CrossRef] [EDP Sciences] [Google Scholar]
- Niell, A., Barrett, J., Burns, A., et al. 2018, Radio Sci., 53, 1269 [NASA ADS] [CrossRef] [Google Scholar]
- Nothnagel, A., Artz, T., Behrend, D., & Malkin, Z. 2017, J. Geod., 91, 711 [Google Scholar]
- Petrachenko, B., Niell, A., Behrend, D., et al. 2009, Design Aspects of the VLBI2010 System. Progress Report of the VLBI2010 Committee, Technical Memorandum NASA/TM-2009-214180 [Google Scholar]
- Petrachenko, B., Niell, A. E., Corey, B. E., et al. 2012, in Geodesy for Planet Earth, eds. S. Kenyon, M. C. Pacino, & U. Marti (Berlin, Heidelberg: Springer Berlin Heidelberg), 999 [Google Scholar]
- Petrov, L. 2024, AJ, 168, 76 [NASA ADS] [CrossRef] [Google Scholar]
- Schartner, M., & Böhm, J. 2019, PASP, 131, 084501 [Google Scholar]
- Schartner, M., Collioud, A., Charlot, P., Xu, M. H., & Soja, B. 2023, J. Geod., 97 [Google Scholar]
- Schartner, M., Petrachenko, B., Titus, M., et al. 2024, arXiv e-prints [arXiv:2407.13323] [Google Scholar]
- Schuh, H., Charlot, P., Hase, H., et al. 2002, in IVS Annual Report 2001, ed. N. Vandenberg & K. D. Baver (NASA), 13 [Google Scholar]
- Xu, M. H., Savolainen, T., Anderson, J. M., et al. 2022, A&A, 663, A83 [NASA ADS] [CrossRef] [EDP Sciences] [Google Scholar]
All Tables
Parameterization of the VIE2023-VG CRF solution, based on piece-wise linear offsets (PWLOs).
Basic characteristics of VIE2023-VG CRF provided for different groups of sources.
Sources with a normalized angular separation Dn between VIE2023-VG CRF and ICRF3-SX larger than 15.
Weighted standard deviation (wstd, Cols. 2–5) and weighted Allan deviation (wadev, Cols. 6–9) of position estimates in α* and δ, with the difference of weighted mean (Δw.mean, VGOS minus SX sessions) in α* and δ (Cols. 10–11).
VSH parameters up to degree and order two for VIE2023-VG CRF with respect to ICRF3-SX and VIE2023sx.
Mean difference between formal errors in right ascension and declination estimates for the four CRF solutions with respect to zwd30gr180.
Statistics for difference in Δα* and Δδ for four CRF solutions with respect to VIE2023-VG CRF (i.e., zwd30gr180).
Statistics on EOP estimated from 155 VGOS sessions with respect to IERS 20C04. Values are provided for solution S1 (ICRF3-SX) and S2 (VIE2023-VG CRF).
All Figures
|
Fig. 1 Observed radio sources (y-axis) in VIE2023-VG CRF per session. The x-axis is sorted chronologically with the VGOS-R&D sessions marked. The vertical blue line represents the transition between Phase 1 and Phase 2. ICRF3 defining sources are highlighted in orange. |
| In the text | |
|
Fig. 2 Histograms with distribution of scans (upper panels) and of observations (lower panels) per source based on the generated schedules (left panels) and on the performed good observations (right panels). The histograms are generated separately from VGOS-OPS (blue), VGOS-R&D without VR2301 and VR2302 (orange), and only for VR2301 and VR2302 (green). The normalized number of sources means that the total area under each histogram adds up to one. For example, sessions VR2301 and VR2302 observed 114 and 177 sources, respectively, so the original sample size for deriving the VR2301/02 histogram (in green) was 291. |
| In the text | |
|
Fig. 3 Telescopes in the VGOS network: GGAO12M (Gs), HOBART12 (Hb), ISHIOKA (Is), KATH12M (Ke), KOKEE12M (K2), MACGO12M (Mg), NYALE13N (Nn), ONSA13NE (Oe), ONSA13SW (Ow), RAEGSMAR (Sa), RAEGYEB (Yj), WESTFORD (Wf), WETTZ13S (Ws). |
| In the text | |
|
Fig. 4 Participating VGOS telescopes in the VIE2023-VG CRF solution per session. |
| In the text | |
|
Fig. 5 Distribution of all sources with the number of observations in VIE2023-VG CRF color-coded (see color bar at right). Defining ICRF3 sources are depicted as triangles, non-defining as circles. |
| In the text | |
|
Fig. 6 Histogram of raw formal errors of source positions from the VIE2023-VG CRF solution. |
| In the text | |
|
Fig. 7 Characteristics of error ellipses in VIE2023-VG CRF. The panels on the left depict the ratio of semi-major to semi-minor axes for all sources. In the panels on the right the direction of the semi-major axes is shown, counting counterclockwise from the east. The lower panels show the error ellipse characteristics with respect to declination of the sources with a color-coded number of observations. |
| In the text | |
|
Fig. 8 Differences in VIE2023-VG CRF source position with respect to ICRF3-SX with color-coded number of observations in VIE2023-VG CRF. The wrms of Δα* and Δδ are 80 μas and 100 μas, respectively, computed over sources with normalized angular separation lower than 5. |
| In the text | |
|
Fig. 9 Session-wise position of sources 0119+115, 0229+131, 0355+508 (NRAO150), and 0642+449 with respect to ICRF3-SX from S/X sessions (blue points) and from VGOS sessions (orange points) with more than 20 good observations of the given source in the session. The error bars are formal errors from the single-session solutions. |
| In the text | |
|
Fig. 10 Time series of estimated zenith wet delays at stations Hb (upper plot) and Wf (lower plot) in session VR2302. Five different solutions were computed with varying estimation intervals for zwd and tropospheric gradients (interval lengths are given in the legend in minutes). |
| In the text | |
|
Fig. 11 Mean and rms for the differences in the zwd time series with respect to default solution zwd30grd180 at individual stations from all VGOS sessions. The legend for the four solutions is given in Fig. 10. |
| In the text | |
|
Fig. 12 Differences in α* and δ for four test CRFs with varied estimation intervals for zwd and tropospheric gradients with respect to default VIE2023-VG CRF (zwd30gr180). Only sources with more than 25 observations are plotted. The legend for the four solutions is given in Fig. 13. |
| In the text | |
|
Fig. 13 Differences in formal errors of α* and δ for four test CRFs with varied estimation intervals for zwd and tropospheric gradients with respect to default VIE2023-VG CRF (zwd30gr180). Only sources with more than 25 observations are plotted. |
| In the text | |
|
Fig. 14 Differences between VIE2023 TRF with respect to ITRF2020 for the VGOS telescopes. The position offset for the reference epoch 2015.0 (upper panel) and the difference in the linear velocity (lower panel) are shown for the height component as blue dots, for the east component as orange dots, and for the north component as green dots. The VIE2023 TRF uncertainties are plotted as red error bars, and the ITRF2020 uncertainties as black error bars. The differences at Sa exceed the y-axis limits (see Table 9 for the exact values). |
| In the text | |
|
Fig. 15 Baseline length repeatability (upper panel) from all VGOS sessions in solution S1 (blue circles) and in solution S2 (orange x-signs). The lower plots show the difference in wrms computed as S1 minus S2 with the total number of observations (middle panel) and with the number of baseline length determinations (bottom panel) color-coded for each baseline. Only baselines included in more than ten sessions are shown. |
| In the text | |
|
Fig. 16 Weighted mean of differences (S1 minus S2) between the absolute baseline length time series obtained from VGOS sessions. Only baselines observed in more than ten sessions are shown. |
| In the text | |
|
Fig. 17 Wrms of the height position time series from all VGOS sessions in solution S1 (ICRF3, ITRF2020) and in solution S2 (VIE2023-VG CRF, ITRF2020). In addition, wrms from solutions with VIE2023 TRF a priori are shown: S3 (ICRF3, VIE2023 TRF) and S4 (VIE2023-VG CRF, VIE2023 TRF). The lower plot depicts the difference in wrms computed as solutions with fixed ICRF3 minus solutions with fixed VIE2023-VG CRF. |
| In the text | |
|
Fig. 18 Wrms of the east component of station position time series from all VGOS sessions (see Fig. 17 for description). |
| In the text | |
|
Fig. 19 Wrms of the north component of station position time series from all VGOS sessions (see Fig. 17 for description). |
| In the text | |
|
Fig. 20 Position estimate time series for station Sa from solutions S1–S4 with respect to a priori TRFs (see Fig. 17 for legend). |
| In the text | |
|
Fig. 21 Visualization of all five EOP time series from VGOS sessions with respect to IERS 20C04 for solution S1 with fixed ICRF3-SX (in blue) and solution S2 with fixed VIE2023-VG CRF (in orange). The box charts display the median with the lower and upper quartiles. The bar length depicts the minimum and maximum values of the time series that are not outliers. The outliers are shown as dots. |
| In the text | |
|
Fig. 22 Nutation time series (dX, dY) with respect to IERS 20C04 from solution S1 (blue, fixed ICRF3-SX) and S2 (orange, fixed VIE2023-VG CRF). The estimates from VGOS-R&D are plotted as larger circles with black edges. |
| In the text | |
Current usage metrics show cumulative count of Article Views (full-text article views including HTML views, PDF and ePub downloads, according to the available data) and Abstracts Views on Vision4Press platform.
Data correspond to usage on the plateform after 2015. The current usage metrics is available 48-96 hours after online publication and is updated daily on week days.
Initial download of the metrics may take a while.