| Issue |
A&A
Volume 665, September 2022
|
|
|---|---|---|
| Article Number | A121 | |
| Number of page(s) | 7 | |
| Section | Celestial mechanics and astrometry | |
| DOI | https://doi.org/10.1051/0004-6361/202243852 | |
| Published online | 20 September 2022 | |
Effect of Galactic aberration on Earth orientation parameters: From the ICRF2 to the ICRF3
1
School of Astronomy and Space Science, Key Laboratory of Modern Astronomy and Astrophysics (Ministry of Education), Nanjing University,
163 Xianlin Avenue,
210023
Nanjing, PR China
e-mail: This email address is being protected from spambots. You need JavaScript enabled to view it.
2
School of Earth Sciences and Engineering, Nanjing University,
Nanjing
210023, PR China
3
Pulkovo Observatory,
St. Petersburg
196140, Russia
4
Research Center for Computation, National Research and Innovation Agency (BRIN),
Jalan Raya Jakarta-Bogor,
16915
Bogor, Indonesia
5
SYRTE, Observatoire de Paris, Université PSL, CNRS, Sorbonne Université, LNE,
Paris, France
Received:
23
April
2022
Accepted:
12
July
2022
Abstract
Aims. At the beginning of 2019 the third realization of the International Celestial Reference Frame (ICRF3) replaced the previous version (ICRF2). In the current International Celestial Reference Frame (ICRF), a major improvement is the inclusion of the Galactic aberration (GA) effect. The Earth orientation parameters (EOP), which link the celestial and terrestrial reference frames, are thus accordingly affected. This paper investigates the influence of the ICRF evolution and the modeling of the GA effect on the determination of the EOP.
Methods. The EOP time series derived within the frame of two official ICRF realizations, as well as different ways of handling the GA effect, were estimated based on the very long baseline interferometry (VLBI) observational data obtained over the past 40 yr. The correlation between the station network and the GA contribution to the EOP was then analyzed by comparison of IVS R1 and R4 routine observations, which have a different distribution of antennas. We also studied the effect of GA on nutation and free core nutation amplitudes by least-squares fits.
Results. The application of different reference frames (ICRF2 and ICRF3) in VLBI solutions leads to constant offsets of 315 microarcsec in the components of dX, dY, and dUT 1. This difference is mainly the reflection of the orientation offsets between the two realizations of the International Celestial Reference System. In a separate study of the GA effect, an approximate 0.3 ± 0.3 uas yr−1 bias is found in dY, while other components are not significantly affected. This bias results in an increasing offset in precession which is non-negligible after several tens of years. We further found that the bias caused by the GA effect will decrease when using a set of more uniformly distributed sources or stations in the most recent decades.
Key words: astrometry / techniques: interferometric / proper motions / reference systems
© J. Yao et al. 2022
 Open Access article, published by EDP Sciences, under the terms of the Creative Commons Attribution License (https://creativecommons.org/licenses/by/4.0), which permits unrestricted use, distribution, and reproduction in any medium, provided the original work is properly cited.
This article is published in open access under the Subscribe-to-Open model. This email address is being protected from spambots. You need JavaScript enabled to view it. to support open access publication.
1 Introduction
The International Celestial Reference Frame (ICRF), the realization of the International Celestial Reference System (ICRS), is based on a set of precise coordinates of compact extragalactic radio sources monitored by very long baseline interferometry (VLBI). The first realization of the ICRF (hereafter ICRF1) was constructed in 1995 based on the positions of 608 compact extragalactic radio sources (Ma & Feissel 1997; Ma et al. 1997), in which 212 were selected as defining sources. The second generation (ICRF2), containing 3414 compact extragalactic radio sources was constructed in 2009 (Ma et al. 2009), and 295 new defining sources were selected (Fey et al. 2015). Some defining sources with extended structure were excluded and new defining sources were added to make a more uniform distribution. The third realization of the ICRF (ICRF3) was adopted by the International Astronomical Union (IAU) at its 30th General Assembly in August 2018 to replace the ICRF2 starting on January 1, 2019. Also established by the VLBI observations, this new frame was enriched with new observations at K band and X/Ka band (Charlot et al. 2020). At the S/X band, the ICRF3 contains 4536 compact extragalactic radio sources of which 303 are defining sources.
The Earth orientation parameters (EOP), which describe the variation in the Earth’s rotation, are crucial in the transformation between the celestial and the terrestrial reference frames (CRF and TRF). The EOP contains dUT1 for describing the change in the rotation rate of the Earth, the offsets in precession-nutation dX and dY for the positions of the Celestial Intermediate Pole (CIP) in the ICRS, and the polar motion xp and yp for the position of CIP in the International Terrestrial Reference System (ITRS). Since the EOP are solved simultaneously with the CRF and TRF in VLBI solutions, they inevitably depend on the realizations of the celestial reference system. The change in celestial reference frame from the ICRF2 to the ICRF3 will result in systematic offsets in the estimation of the EOP, due to the inclusion of the Galactic aberration effect and improvements in the observational accuracy and the distribution of the sources.
When establishing the ICRF, we consider that proper motions of extragalactic sources are not detectable. However, the Galactic aberration (GA) effect caused by the acceleration of the solar system barycenter (SSB) produces non-negligible apparent proper motion towards the Galactic center for all sources on the celestial sphere (Kovalevsky 2003; Kopeikin & Makarov 2006). It is a newly added feature to the ICRF3 that the source positions are epoch-dependent. This conceptual change in the celestial reference frame will influence the measurement of the EOP. Titov et al. (2011) detected the acceleration of the SSB by using radio source coordinate time series, and then several other groups followed (Xu et al. 2012; Titov & Lambert 2013; Titov & Krâsnâ 2018). The amplitude of Galactic acceleration is in the range from 5.2 µas yr−1 to 6.4 µas yr−1, and the value 5.8 µas yr−1 was adopted in the ICRF3 (MacMillan et al. 2019; Charlot et al. 2020).
To study the influence of Galactic aberration on the precession model, Malkin (2011) derived precession parameters based on VLBI observations. The linear trends on the celestial pole offsets are found to be about 0.1 µas yr−1 and 0.2 µas yr−1 for the precession components dX and dY, respectively. Liu et al. (2012) investigate theoretically the systematic effect of the GA on the ICRS realization and the precession rates. They show that the GA effect strongly depends on the distribution of the sources that are used to realize the ICRS. In different realizations of the ICRS at that time (ICRF1 and ICRF2), the effect on the precession components dX and dY is in the range of about 1 to 100 µas per century. For the Earth rotation angle (ERA), the contribution of the GA effect ranges from 4 | as to several tens per century.
In this paper, we investigate the influence of the transition from the ICRF2 to the ICRF3 on the EOP, with an emphasis on the GA effect. In Sect. 2, we introduce the data and methods used in our analysis. The result of the EOP estimated in the VLBI global solutions is given in Sect. 3.1. We then consider how the source distribution (Sect. 3.2) and station network (Sect. 3.3) affect the GA contribution. Finally, we summarize our conclusions in Sect. 4.
2 Data and methods
The VLBI data used in this work are taken from the International VLBI Service for Geodesy and Astrometry (IVS; Nothnagel et al. 2017) data center. From 1979.5 to 2020.5, we selected 4683 sessions (a total of about 13.1 million delays) with more than one baseline and weighted root mean square (wrms) of the fitting residuals less than 1000 ps. The data were analyzed with the Vienna VLBI and Satellite Software (VieVS), developed and maintained by the Vienna University of Technology (Böhm et al. 2018).
From the ICRF2 to the ICRF3, one important change is the adoption of the GA effect in the new reference frame (Charlot et al. 2020). To study the influence of this change on the EOP, three global solutions were run with the following reference systems: (i) ICRF3/SX position without GA correction; (ii) ICRF2 position without GA correction; (iii) ICRF3/SX position with GA correction. The comparison of the first two solutions helps us to understand the difference in EOP between the ICRF2 and ICRF3, while the purpose of adding the third solution is to analyze the GA effect itself. Hereafter we refer to these three global solutions as ICRF3nGA, ICRF2nGA, and ICRF3GA, respectively.
According to the GA effect, the position of an extragalactic source in an observational epoch is slightly biased from its position at the selected basic epoch. Therefore, a specific epoch J2015.0 (Charlot et al. 2020) which is close to the mean epoch of the VLBI observations was selected in the ICRF3. In the software VieVS, the GA effect is corrected by adding time-dependent corrections to the source positions at different epochs.
The GA effect caused by the Galactic acceleration a can be expressed as
 (1)
(1)
where p is the position vector of a target, A = a/c is called the “Galactic aberration constant” (Malkin 2011; the amplitude of the effect) in the unit of angular proper motions, and g is the direction of the Galactic center. Here, we take the equatorial coordinates of the Galactic center and the target source at the basic epoch as (α0, δ0) and respectively. Then the proper motions resulting from the GA effect in the right ascension and declination are such that (Titov 2010; Liu et al. 2012)
 (2)
(2)
where d1 = A cos α0 cos δ0, d2 = A sin α0 cos δ0, and d3 = A sin δ0. Considering the very long period of the motion of the SSB around the Galactic center, the motion caused by Galactic aberration can be approximated as linear within the VLBI observation timescale. Therefore, the position shift caused by the GA effect can be written as
 (3)
(3)
where t0 is the initial date and t the date for each session. In the solution ICRF3GA, it is natural to take the basic epoch of the ICRF3 (J2015.0) as to in Eq. (3) to correct the GA effect. We adopt 5.8 µas yr−1 (MacMillan et al. 2019) as the GA constant and α0 = 266.4°, δ0 = −29.0° as the position of the Galactic center (Charlot et al. 2020). For the solution without GA correction (solutions ICRF2nGA and ICRF3nGA), we take a zero value for the GA constant A. All the other models are the same for all three global solutions. The common features of these solutions are the following:
The clocks and troposphere were estimated and corrected in single-session analysis. The corrected values were then used in the global solution;
The station and source coordinates were estimated globally in the solutions. The station velocities were fixed to their prior values in the ITRF 2014 (Altamimi et al. 2016);
The EOP time series were estimated every 24 h in the global solution.
3 Result and discussion
3.1 EOP differences in three global solutions
The estimated EOP time series from solutions ICRF3GA, ICRF3nGA, and ICRF2nGA are consistent at the milliarcsecond level. Figure 1 presents the differences between the EOP time series from our three solutions. Figure 1a is the differential EOP time series in sense of [ICRF2nGA–ICRF3nGA], while Fig.1b shows the difference [ICRF3nGA–ICRF3GA]. Figure 1b shows that the differences in the EOP are not zero at J2015.0 when the GA correction calculated by Eq. (3) is zero. The reason is that the GA correction applied in global solutions also influences the estimation of other global parameters, such as source positions and station coordinates. Since global parameters and the EOP series are solved together in the solution, the differences in the global parameter estimation will affect the EOP at all epochs. Finally, this results in the dispersed EOP series and the non-zero offset at J2015.0 shown in Fig. 1b.
As mentioned in Sect. 1, the polar motion components xp and yp are the coordinates of the CIP in the ITRS. They should be less affected by the changes in source coordinates on the celestial sphere. Although the points in the top two panels of Fig. 1 are slightly diffused, the mean value (<2.5 µas) and wrms (<4 µas) verify that the differences are not significant in xp and yp between these three solutions.
Except the polar motion, the other three components of the EOP (ΔdUT 1, ΔdX, and ΔdY) in Fig. 1 are fitted to a straight line. The fitting results corresponding to Fig. 1a and b are given in the lines [ICRF2nGA – ICRF3nGA] and [ICRF3nGA – ICRF3GA] of Table 1. For dUT1, the fitting results of [ICRF2nGA – ICRF3nGA] show an overall constant offset of about 0.5 µs (6.3 µas). Similar constant offsets are also found in the dX and dY components, which are about 15 µas and 3 µas, respectively. As pointed out by Liu et al. (2012), the constant offsets for dUT 1, dX, and dY can be understood as the reflection of the rotation angles of the ICRS axes transforming from the ICRS to the revised realization (denoted as ICRS’ in Liu et al. 2012). Using Eq. (33) from their work we can conversely derive the rotation angles of different reference frames from the EOP offsets. Substituting the constant terms of [ICRF2nGA – ICRF3nGA] (see Table 1) into that equation, we find that the ICRF2 and ICRF3 orientation offsets for each axis are from 3 to 15 µas. Consistent results can be found in Charlot et al. (2020) where the rotation angles between these two reference frames (up to 15 µas) are derived by fitting positional offsets of common sources in the
ICRF2 and the ICRF3/SX catalogs using the vector spherical harmonics.
In the lines [ICRF3nGA – ICRF3GA] in Table 1, the linear drift term of about 0.3 µas yr−1 for the dY component is of particular interest. Since the differential EOP time series of [ICRF3nGA – ICRF3GA] directly reveals the influence of the GA effect, this numerical result for the precession rate should be the systematic bias caused by the Galactic aberration. In addition, we applied an empirical model composed of a straight line plus a 18.6yr term (the largest term in the nutation series), which was also used in Malkin (2011) to model the long-term behavior of precession-nutation parameters dX and dY. As listed in Table 2, the coefficients of the linear terms are consistent with that in Table 1. For the line of [ICRF3nGA-ICRF3GA] in Tables 1 and 2, the wrms before and after removing the linear trend are calculated. In both cases, the wrms of the dY component are reduced by more than 10%, while the wrms for the other components remain unchanged. This also confirms that the GA effect has the largest effect on the rate of dY among the EOP.
To verify the stability of our results, we ran two solutions similar to ICRF3nGA and ICRF3GA using another widely used software, Calc/Solve, for VLBI data analysis. As expected, the long-term deviations in EOP series derived by Calc/Solve, including the 0.3 µas yr−1 drift in the dY component, are consistent with those estimated by VieVS (see Table 1).
We also compared our results with those of Malkin (2011), who evaluated the effect of the Galactic aberration on the estimation of celestial pole offsets (CPOs) using VLBI observations between January 1984 and March 2010. In Malkin (2011), a drift rate about 0.2 ± 0.8 µas yr−1 was obtained for the dY component of CIP. The corresponding rate 0.3 µas yr−1 in this study is slightly higher, but still consistent with the Malkin (2011) value within the uncertainties. Thanks to the longer period of VLBI observations, the uncertainties have improved by a factor of 23. We note that the accuracy of the recent precession model is about 1 µas per century (Capitaine et al. 2003), the accumulated effect over the past 40 yr (> 10 µas on dY) cannot be neglected for the high-accuracy precession model. This proves the necessity of modeling the Galactic aberration in the ICRF3. Moreover, we find that this trend on the dY in Fig. 1b has almost disappeared in recent decades, which can be seen from a separated linear fit of the series over the last ten years (see the lower part of Table 1). This suggests that the performance of the GA effect on the EOP may be affected by some observational factors, and we discuss this in the following sections.
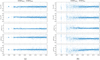 |
Fig. 1 Differences of estimated EOP time series for ICRF3GA, ICRF3nGA, and ICRF2nGA. (a) [ICRF2nGA – ICRF3nGA]. (b) [ICRF3nGA – ICRF3GA]. The components Δxp, Δyp, ΔdX, and ΔdY are in units of microarcseconds and ΔdUT 1 is in units of microseconds. |
Linear fits of differential EOP for the three solutions.
Linear plus 18.6 yr periodic term fits of differential celestial pole offsets, where t0 is J2015.0.
3.2 Source distribution
According to Liu et al. (2012), the effect of the Galactic aberration on the dUT 1, dX, and dY can be calculated based on the coordinates for a set of sources on the sky. The proper motion of sources caused by the GA effect can be calculated by Eq. (2), and the changes in source positions from observation epoch t to basic epoch t0 can be derived by Eq. (3). Then the frame rotation angles ϵx, ϵy, and ϵz caused by GA can be estimated by least-squares fits using the following equations (Mignard & Klioner 2012):
 (4)
(4)
Finally, substituting the rotation angles ϵx, ϵy, and ϵz into Eq. (33) of Liu et al. (2012), we obtain
 (5)
(5)
For each session of VLBI observations, the GA effect on dUT 1, dX, and dY can be calculated according to the above equations once the observation epoch and the coordinates of sources in that session are given. Figure 2 plots the estimated dUT 1, dX, and dY for all sessions in our solutions. In the fitting, the correlation coefficients for ϵx, ϵy, and ϵz are mostly between −0.1 and 0.1, showing good independence of these three angles. The trend of the median values (central red lines) is similar to that in Fig. 1b. The drift rates on the dY for all points and the post-2011.0 portion in Fig. 2 are 1.73 and 0.75 µas yr−1, respectively, which are higher than the corresponding coefficients in Table 1. This discrepancy is mainly caused by the different weights of each session and the constraints on EOP estimation in the global solution.
In principle, the Galactic aberration is represented by a pure glide proper motion field (which is perpendicular to the field of rotation at any point) on the celestial sphere. However, only rigid rotation can be considered to study the Earth’s orientation in different celestial reference frames that are affected or unaffected by the GA effect since the axes of CRF and TRF must remain orthogonal. In this case a small global rotation of the reference system can be estimated from the GA-induced apparent proper motions due to the non-uniform distribution of sources (Liu et al. 2012). Figure 3 presents the source distributions in the past years. From 1985 to 2015, the number of sources increased and the distribution of observed sources became more uniform. From the dY component in Fig. 1b and Table 1, we find that a more uniform source distribution helps reduce the influence of the GA effect. This result is also consistent with the conclusion in Liu et al. (2012).
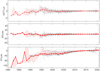 |
Fig. 2 Theoretical influence of GA effect on dUT 1, dX, and dY. The gray points represent the influence on each session and the red lines are the median value in each year. The pink shadow gives the 10th and 90th quantiles of the data. |
3.3 Network effect
Malkin (2009) and Heinkelmann & Schuh (2010) pointed out that the distribution of the VLBI antenna network may contribute to the uncertainty of the VLBI observed EOP. From 2002, the IVS organized two 24 h rapid experiments R1 (Monday) and R4 (Thursday), mainly for EOP measurements. To understand the impact of station distribution on the GA effect, we carried out a study using only R1 or R4 observations whose networks are different (Lambert & Gontier 2006). Until 2020.5, there were 953 sessions for R1 and 952 sessions for R4. The station distributions are plotted in Fig. 4 where the baselines are drawn to show the frequently used working networks.
We used the R1 and the R4 sessions to run the solution ICRF3GA and ICRF3nGA with the same configurations in VLBI solutions as in the previous analysis. Figure 5 shows the difference of dUT 1, dX, and dY in sense of [ICRF3nGA – ICRF3GA] with the R1 and R4 data. These three components are almost the same except for a small difference in the dX and dY components in the first half of the period. We further perform linear fits with the pre-2011.0 and the post-2011.0 data to obtain the coefficients in Table 3. All the fitted coefficients in the pre-2011.0 portion of the R4 result are larger than those of R1. As shown in Fig. 4, in this period the network used in the R1 observation is larger, while the R4 network is limited to the western hemisphere. This indicates that the GA effect on EOP relates to the geometry of the network, and a larger network is preferred to reduce the GA effect. The bottom two panels in Fig. 4 are the station distributions after 2011.0. One important improvement in the R1 and R4 networks is the addition of three new stations YARRA12M (Australia), KATH12M (Australia), and WARK12M (New Zealand) in 2011 and 2012. For both R1 and R4 observations, these new southern stations added several long north-south baselines and leads to a more symmetrical station distribution on the Earth. In addition, for the R4 network, stations in Oceania and Africa participated in many sessions after 2011.0 which also brings a significant increase in the size of the observation network. These changes in the networks are also reflected in the estimated EOP: in Table 3, the drift rates on the dX and dY in both R1 and R4 are smaller after 2011.0. This confirms that the GA effect decreases in a larger network, and points out the important role of southern hemisphere stations.
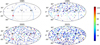 |
Fig. 3 Distribution evolution of VLBI observed sources in equatorial coordinates in 1985, 1995, 2005, and 2015. The color of the points represents the observation times of each source during this time. The red star gives the position of the Galactic center and the blue dashed line is the Galactic plane. |
Linear fits of EOP offsets between solution ICRF3nGA and ICRF3GA ([ICRF3nGA – ICRF3GA]) with R1 and R4 observations.
3.4 GA effect on nutation and the free core nutation amplitudes
To investigate the influence of the GA effect on the current nutation model, periodic fits of the CPO series from solutions ICRF3GA and ICRF3nGA were performed. The free core nutation (FCN) is removed from the original series before fitting. The nutation periods are taken from the IAU 2000–2006 model (Mathews et al. 2002) and only the largest 42 terms are fitted in this work. Figure 6 is the fitting result, showing that the amplitudes of two solutions are consistent in all terms with offsets of less than 1 µas. Considering the accuracy of the current nutation model (~10 µas; Coppola et al. 2009), these deviations caused by the GA effect can be neglected.
The free core nutation is a free retrograde diurnal motion of the Earth’s rotation axis relative to the Earth, appearing as the motion of CIP in the ICRS (Petit & Luzum 2010). Caused by the interaction of the mantle and the fluid-ellipsoidal core as the Earth rotates, FCN is essentially unaffected by the reference frame transition. We use the ZM3 FCN model (Malkin 2017) to fit the CPO series from solutions ICRF3GA and ICRF3nGA. The upper two panels in Fig. 7 show the fitting results from two solutions, while the bottom panel gives their differences in each component. The largest difference here (about 20 µas) is less than the accuracy of the FCN model (about 50 µas), indicating that the Galactic aberration also has no significant effect on the FCN.
4 Conclusions
In this paper we investigated the influence of the transition from the ICRF2 to the ICRF3 on the Earth orientation parameters (EOP) with a focus on the GA effect. Three sets of global solutions (ICRF3GA, ICRF3nGA, and ICRF2nGA) with different reference system realizations were derived for comparison. The EOP time series estimated in the ICRF2 and ICRF3 show constant offsets (3–15 µas) in dX, dY, and dUT 1. These constant offsets are mainly caused by the small orientation offset between ICRF2 and ICRF3. We independently analyzed the Galactic aberration (GA) effect and found that it caused a linear drift of about 0.3 ± 0.3 µas yr−1 in the dY component of precession-nutation.
The uncertainty on the correction has improved remarkably compared to previous estimates. The cumulative effect from the GA effect is about 10 µas in the Y component of the precession in the last 40 yr, which has a non-negligible impact on the current precession-nutation model.
According to the evolution of the source distribution in VLBI observations, we found that a uniform distribution of sources could help to reduce the influence of the GA effect. After analyzing the observations from the R1 and R4 networks, we conclude that a larger and more uniformly distributed network makes the EOP less affected by the GA effect. Adding stations in the southern hemisphere is an effective way to reduce the magnitude of the GA effect. In recent decades the additional rate caused by the GA effect almost vanished thanks to a more uniform distribution of stations and sources.
The GA effect on the 42 largest nutation terms and on the free core nutation (FCN) amplitudes was also investigated. The result shows that the modeling of Galactic aberration has no significant influence on the current nutation model and FCN model.
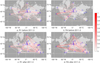 |
Fig. 4 Station distributions of (a) IVS-R1 before 2011.0, (b) IVS-R4 before 2011.0, (c) IVS-R1 after 2011.0, and (d) IVS-R4 after 2011.0. The blue triangles represent the stations. The color of the baseline shows its working frequency calculated as n/nmax, where n is the working times of the baseline and nmax is the total observation number. |
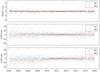 |
Fig. 5 Differences for dUT 1, dX, and dY between solution ICRF3GA and ICRF3nGA ([ICRF3nGA – ICRF3GA]). The blue points are for the results of R1 and the orange points are for the results of R4. |
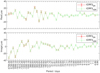 |
Fig. 6 Nutation amplitude estimation for CPO series for the solution ICRF3GA and ICRF3nGA. |
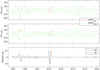 |
Fig. 7 Estimated FCN from the solution ICRF3GA and ICRF3nGA with the ZM3 model (top two panels) and Amplitude deviations between these two solution (bottom panel). |
Acknowledgements
We are grateful to the referee for his/her valuable comments and suggestions for improving the paper. This work is supported by the National Natural Science Foundation of China (NSFC) under grant No. 11833004. N. Liu is supported by the NSFC (Grant Number: 12103026) and the China Postdoctoral Science Foundation (Grant Number: 2021M691530). We also thank the Research Unit Higher Geodesy of the GEO Department at TU Wien for developing VieVS and the International VLBI Service for Geodesy and Astrometry (IVS) for providing the data used in this work.
References
- Altamimi, Z., Rebischung, P., Métivier, L., & Collilieux, X. 2016, J. Geophys. Res.: Solid Earth, 121, 6109 [CrossRef] [Google Scholar]
- Böhm, J., Böhm, S., Boisits, J., et al. 2018, PASP, 130, 044503 [CrossRef] [Google Scholar]
- Capitaine, N., Wallace, P. T., & Chapront, J. 2003, A&A, 412, 567 [NASA ADS] [CrossRef] [EDP Sciences] [Google Scholar]
- Charlot, P., Jacobs, C. S., Gordon, D., et al. 2020, A&A, 644, A159 [EDP Sciences] [Google Scholar]
- Coppola, V., Seago, J., & Vallado, D. 2009, Adv. Astronaut. Sci., 134, 919 [Google Scholar]
- Fey, A. L., Gordon, D., Jacobs, C. S., et al. 2015, AJ, 150, 58 [Google Scholar]
- Heinkelmann, R., & Schuh, H. 2010, in Relativity in Fundamental Astronomy: Dynamics, Reference Frames, and Data Analysis, eds. S. A. Klioner, P. K. Seidelmann, & M. H. Soffel, 261, 286 [NASA ADS] [Google Scholar]
- Kopeikin, S. M., & Makarov, V. V. 2006, AJ, 131, 1471 [Google Scholar]
- Kovalevsky, J. 2003, A&A, 404, 743 [NASA ADS] [CrossRef] [EDP Sciences] [Google Scholar]
- Lambert, S. B., & Gontier, A.-M. 2006, in Proceedings of the IVS 2006 General Meeting, Concepción, Chile, January, 264 [Google Scholar]
- Liu, J. C., Capitaine, N., Lambert, S. B., Malkin, Z., & Zhu, Z. 2012, A&A, 548, A50 [NASA ADS] [CrossRef] [EDP Sciences] [Google Scholar]
- Ma, C., & Feissel, M. 1997, IERS Technical Note, 23 [Google Scholar]
- Ma, C., Arias, E. F., Eubanks, T. M., et al. 1997, IERS Technical Note, 23, 2 [Google Scholar]
- Ma, C., Arias, E. F., Bianco, G., et al. 2009, IERS Technical Note, 35, 1 [Google Scholar]
- MacMillan, D. S., Fey, A., Gipson, J. M., et al. 2019, A&A, 630, A93 [NASA ADS] [CrossRef] [EDP Sciences] [Google Scholar]
- Malkin, Z. 2009, J. Geodesy, 83, 547 [NASA ADS] [CrossRef] [Google Scholar]
- Malkin, Z. 2017, J. Geodesy, 91, 839 [NASA ADS] [CrossRef] [Google Scholar]
- Malkin, Z. M. 2011, Astron. Rep., 55, 810 [NASA ADS] [CrossRef] [Google Scholar]
- Mathews, P. M., Herring, T. A., & Buffett, B. A. 2002, J. Geophys. Res.: Solid Earth, 107, ETG [Google Scholar]
- Mignard, F., & Klioner, S. 2012, A&A, 547, A59 [NASA ADS] [CrossRef] [EDP Sciences] [Google Scholar]
- Nothnagel, A., Artz, T., Behrend, D., & Malkin, Z. 2017, J. Geodesy, 91, 711 [NASA ADS] [CrossRef] [Google Scholar]
- Petit, G., & Luzum, B. 2010, IERS Technical Note, 36, 1 [NASA ADS] [Google Scholar]
- Titov, O. 2010, MNRAS, 407, L46 [NASA ADS] [CrossRef] [Google Scholar]
- Titov, O., & Krásná, H. 2018, A&A, 610, A36 [NASA ADS] [CrossRef] [EDP Sciences] [Google Scholar]
- Titov, O., & Lambert, S. 2013, A&A, 559, A95 [NASA ADS] [CrossRef] [EDP Sciences] [Google Scholar]
- Titov, O., Lambert, S. B., & Gontier, A. M. 2011, A&A, 529, A91 [NASA ADS] [CrossRef] [EDP Sciences] [Google Scholar]
- Xu, M. H., Wang, G. L., & Zhao, M. 2012, A&A, 544, A135 [NASA ADS] [CrossRef] [EDP Sciences] [Google Scholar]
All Tables
Linear plus 18.6 yr periodic term fits of differential celestial pole offsets, where t0 is J2015.0.
Linear fits of EOP offsets between solution ICRF3nGA and ICRF3GA ([ICRF3nGA – ICRF3GA]) with R1 and R4 observations.
All Figures
|
Fig. 1 Differences of estimated EOP time series for ICRF3GA, ICRF3nGA, and ICRF2nGA. (a) [ICRF2nGA – ICRF3nGA]. (b) [ICRF3nGA – ICRF3GA]. The components Δxp, Δyp, ΔdX, and ΔdY are in units of microarcseconds and ΔdUT 1 is in units of microseconds. |
| In the text | |
|
Fig. 2 Theoretical influence of GA effect on dUT 1, dX, and dY. The gray points represent the influence on each session and the red lines are the median value in each year. The pink shadow gives the 10th and 90th quantiles of the data. |
| In the text | |
|
Fig. 3 Distribution evolution of VLBI observed sources in equatorial coordinates in 1985, 1995, 2005, and 2015. The color of the points represents the observation times of each source during this time. The red star gives the position of the Galactic center and the blue dashed line is the Galactic plane. |
| In the text | |
|
Fig. 4 Station distributions of (a) IVS-R1 before 2011.0, (b) IVS-R4 before 2011.0, (c) IVS-R1 after 2011.0, and (d) IVS-R4 after 2011.0. The blue triangles represent the stations. The color of the baseline shows its working frequency calculated as n/nmax, where n is the working times of the baseline and nmax is the total observation number. |
| In the text | |
|
Fig. 5 Differences for dUT 1, dX, and dY between solution ICRF3GA and ICRF3nGA ([ICRF3nGA – ICRF3GA]). The blue points are for the results of R1 and the orange points are for the results of R4. |
| In the text | |
|
Fig. 6 Nutation amplitude estimation for CPO series for the solution ICRF3GA and ICRF3nGA. |
| In the text | |
|
Fig. 7 Estimated FCN from the solution ICRF3GA and ICRF3nGA with the ZM3 model (top two panels) and Amplitude deviations between these two solution (bottom panel). |
| In the text | |
Current usage metrics show cumulative count of Article Views (full-text article views including HTML views, PDF and ePub downloads, according to the available data) and Abstracts Views on Vision4Press platform.
Data correspond to usage on the plateform after 2015. The current usage metrics is available 48-96 hours after online publication and is updated daily on week days.
Initial download of the metrics may take a while.